Copyright
©2010 Baishideng Publishing Group Co.
World J Cardiol. Jul 26, 2010; 2(7): 163-170
Published online Jul 26, 2010. doi: 10.4330/wjc.v2.i7.163
Published online Jul 26, 2010. doi: 10.4330/wjc.v2.i7.163
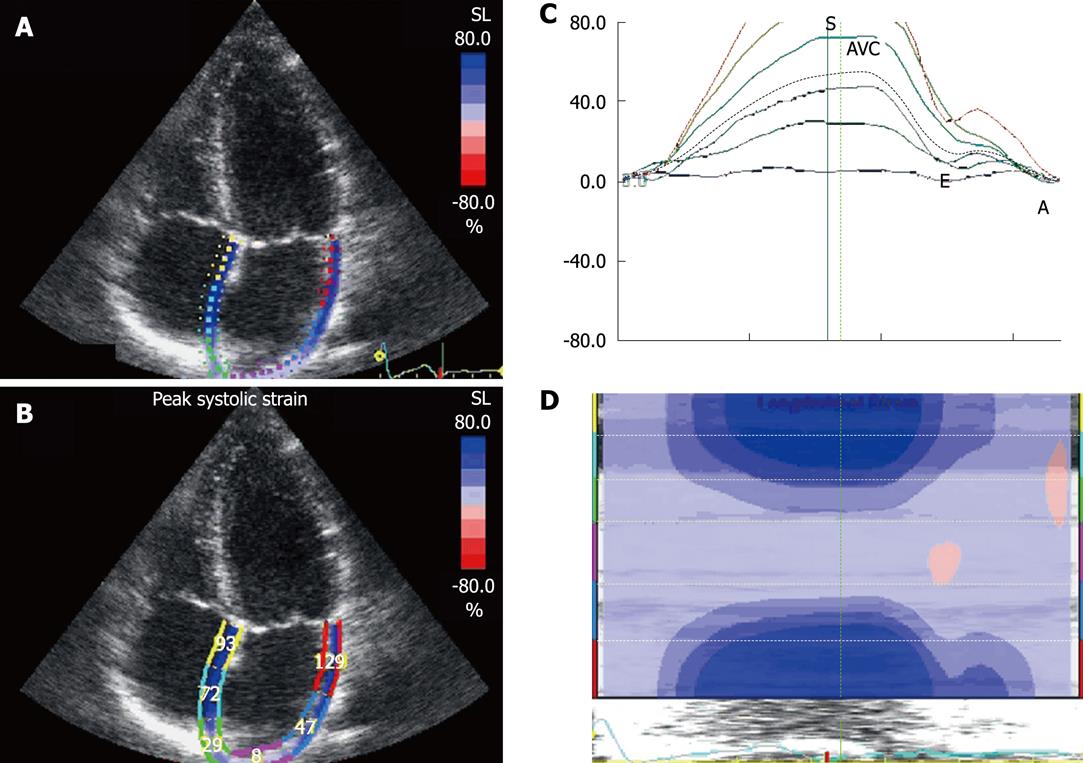
Figure 4 Measurement of 2D longitudinal atrial strain with speckle tracking.
Quad view. A: Once the atrial endocardial border is traced, atrial thickness is traced automatically; B: Strain value of the reservoir in the six atrial walls; C: Longitudinal strain curves of the six atrial segments. The dotted line represents average atrial longitudinal strain. During the period in which the atrium acts as a reservoir (includes isovolumic contraction, ejection and isovolumic relaxation phases), atrial strain increases, reaching a peak (S) at the end of filling from pulmonary vein flow, just before mitral opening. During the conduit atrial phase, atrial strain decreases (E), with a plateau during diastasis and a negative peak at the end of atrial contraction (A); D: Curved anatomical M-mode: the light blue color indicates that atrial roof strain is lower than that of the rest of the walls, colored in blue. AVC: Aortic valve closure.
- Citation: Cianciulli TF, Saccheri MC, Lax JA, Bermann AM, Ferreiro DE. Two-dimensional speckle tracking echocardiography for the assessment of atrial function. World J Cardiol 2010; 2(7): 163-170
- URL: https://www.wjgnet.com/1949-8462/full/v2/i7/163.htm
- DOI: https://dx.doi.org/10.4330/wjc.v2.i7.163


