
















Copyright: ©Author(s) 2026.
World J Gastrointest Surg. Nov 27, 2026; 18(11): 125182
Published online Nov 27, 2026. doi: 10.4240/wjgs.125182
Published online Nov 27, 2026. doi: 10.4240/wjgs.125182
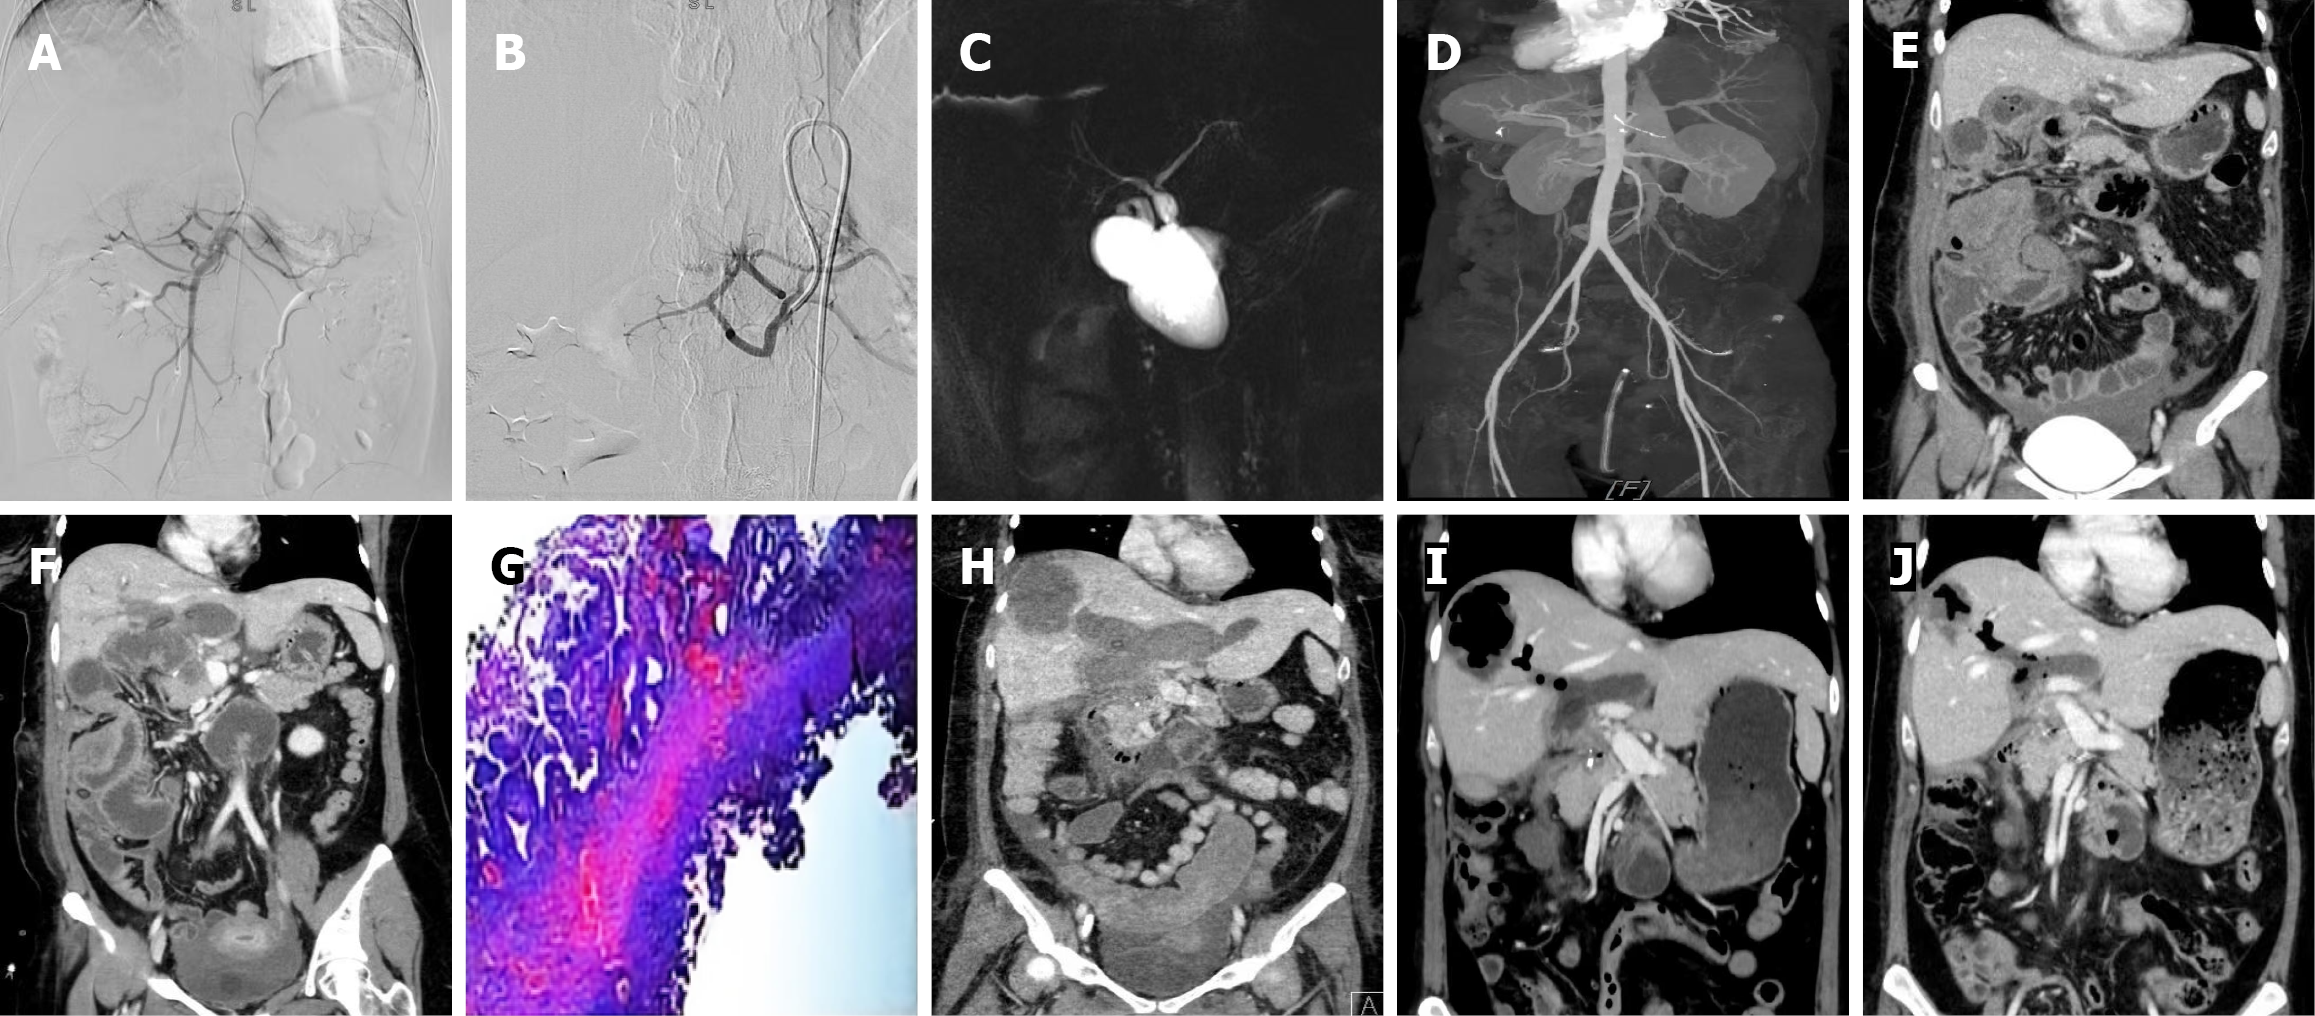
Figure 1 Perioperative imaging examinations.
A and B: Digital subtraction angiography revealing suspected extravasation of the contrast agent at the transitional area of the first branch of the superior mesenteric artery, gastric right artery, and gastric duodenal artery, and preventive embolization was performed; C: Nuclear magnetic resonance imaging revealing cystic dilation of the extrahepatic bile duct; D and E: Computed tomography (CT) angiography and coronal views highlighting ascites and hematoma in the abdominal cavity; F: Coronal views of CT revealing increased ascites and hematoma in the abdominal cavity; G: Postoperative pathology of the common bile duct cyst suggests a benign epithelial cyst of the bile duct alongside microtissue hyperplasia of the cyst wall and scattered chronic inflammatory cell infiltration, consistent with the diagnosis of bile duct cyst; H: Coronary views of CT indicating the formation of liver abscess and pelvic effusion; I: Coronary views of CT indicating a reduction in the abscess cavity and a decrease in the pus volume of the liver abscess; J: Coronary views of CT indicating that the abscess cavity of the liver abscess has basically healed.
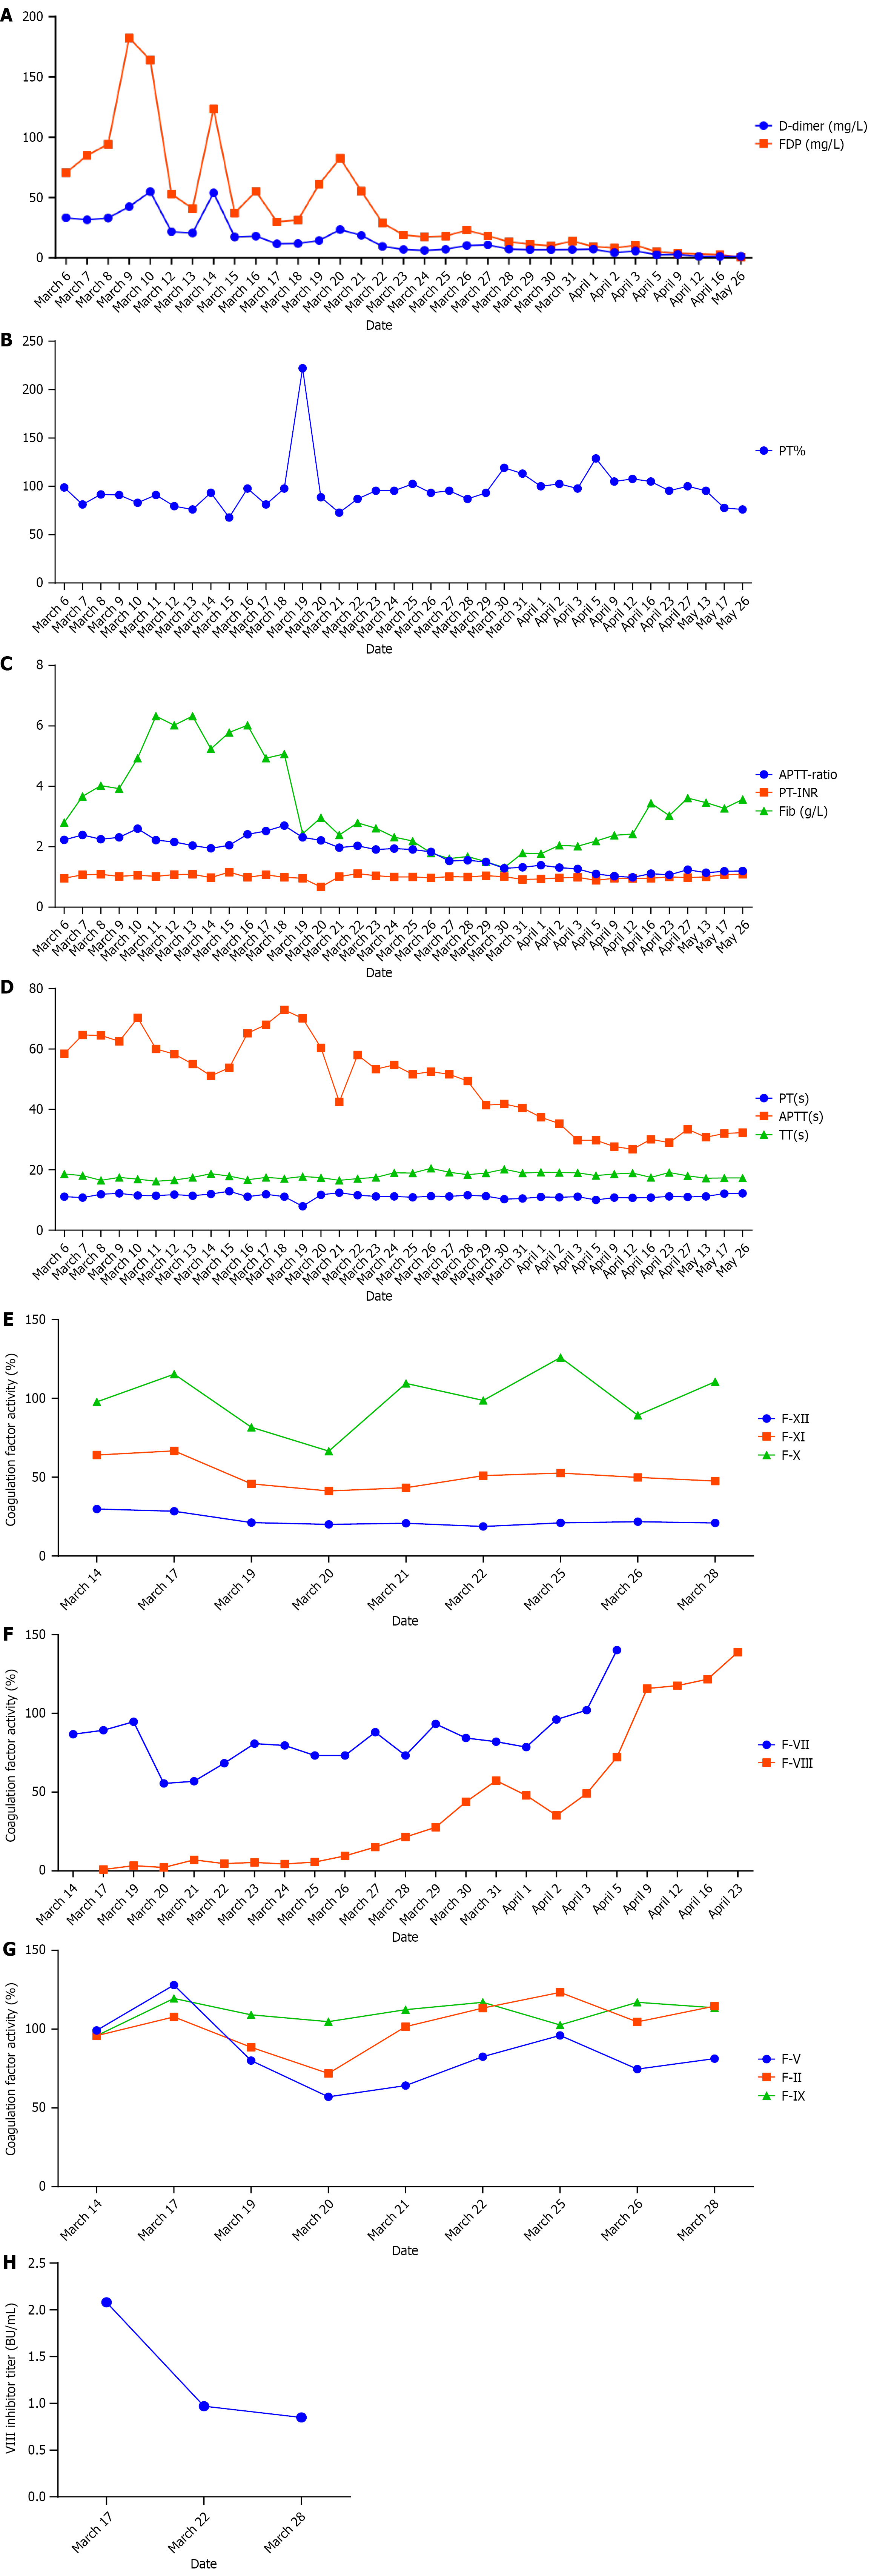
Figure 2 Timeline of changes in coagulation indices.
A-H: Activated partial thromboplastin time (APTT) gradually decreased from 58.4 seconds at the time of admission to 26.8 seconds on April 12, 2024, and the APTT ratio returned to 0.99. Factor VIII (FVIII) activity continuously increased from 0.9% to 138.9% on April 23, 2024. The FVIII inhibitor titer decreased from 2.08 to 0.85 BU/mL and eventually turned negative. D-dimer and fibrin degradation product levels decreased from significantly elevated levels to normal ranges, and the patient’s coagulation function stabilized. FDP: Fibrin degradation product; PT: Prothrombin time; VIII: Factor VIII; APTT: Activated partial thromboplastin time; PT-INR: Prothrombin time-international normalized ratio; TT: Thrombin time.
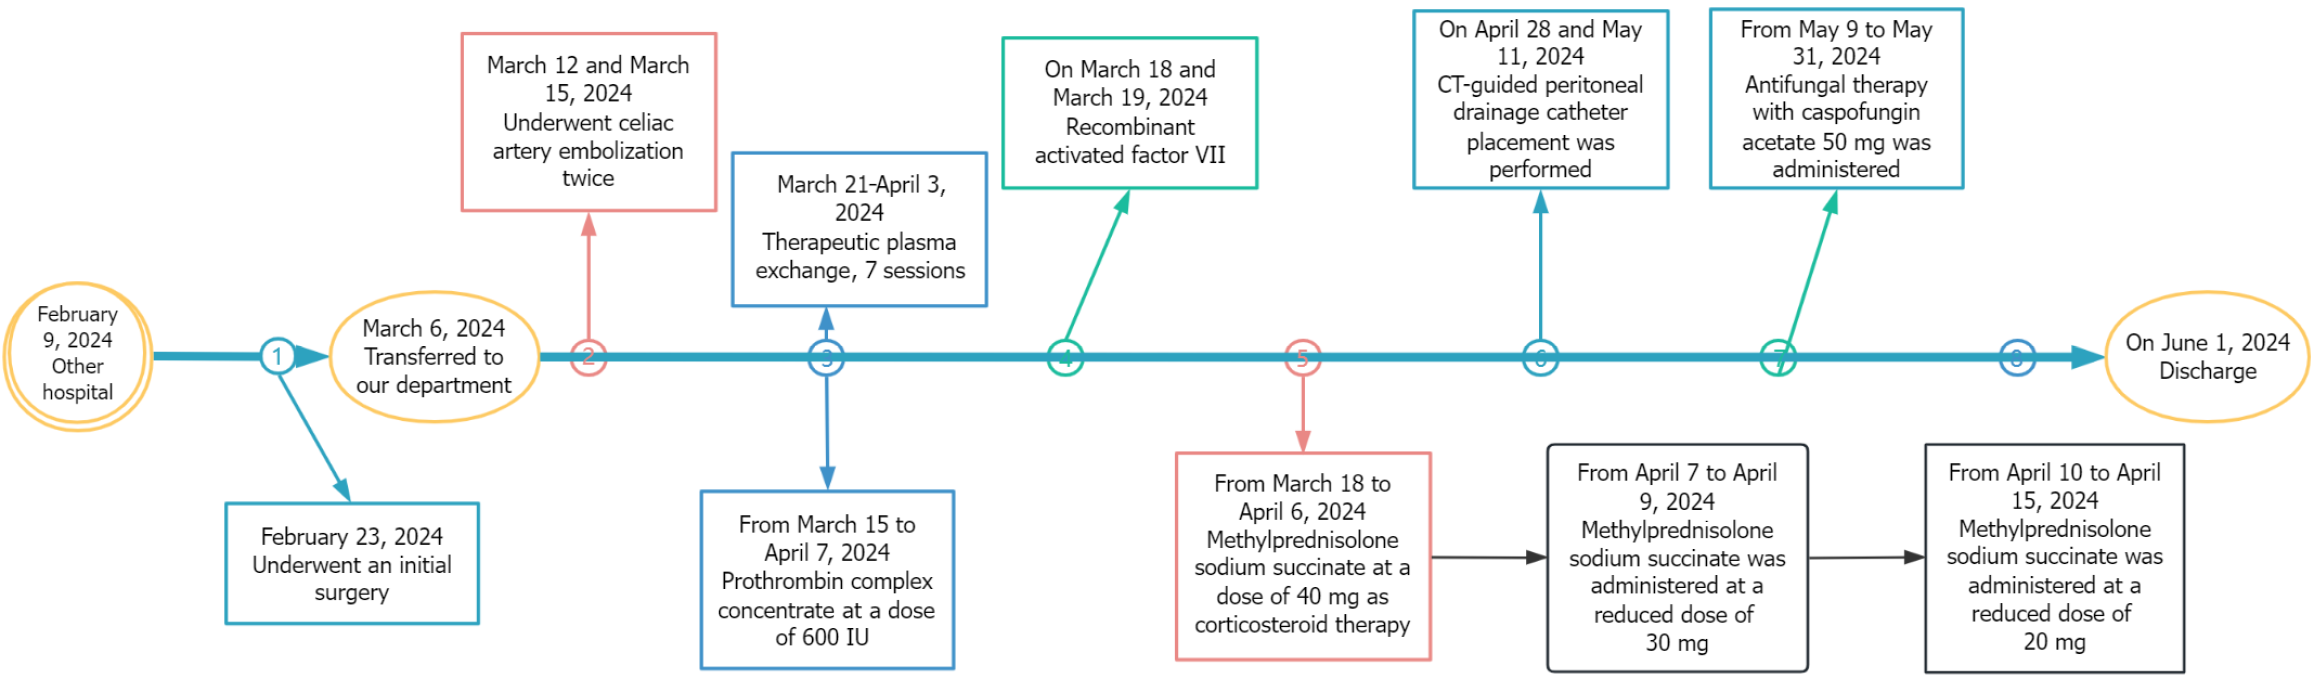
Figure 3 Treatment timeline.
CT: Computed tomography.
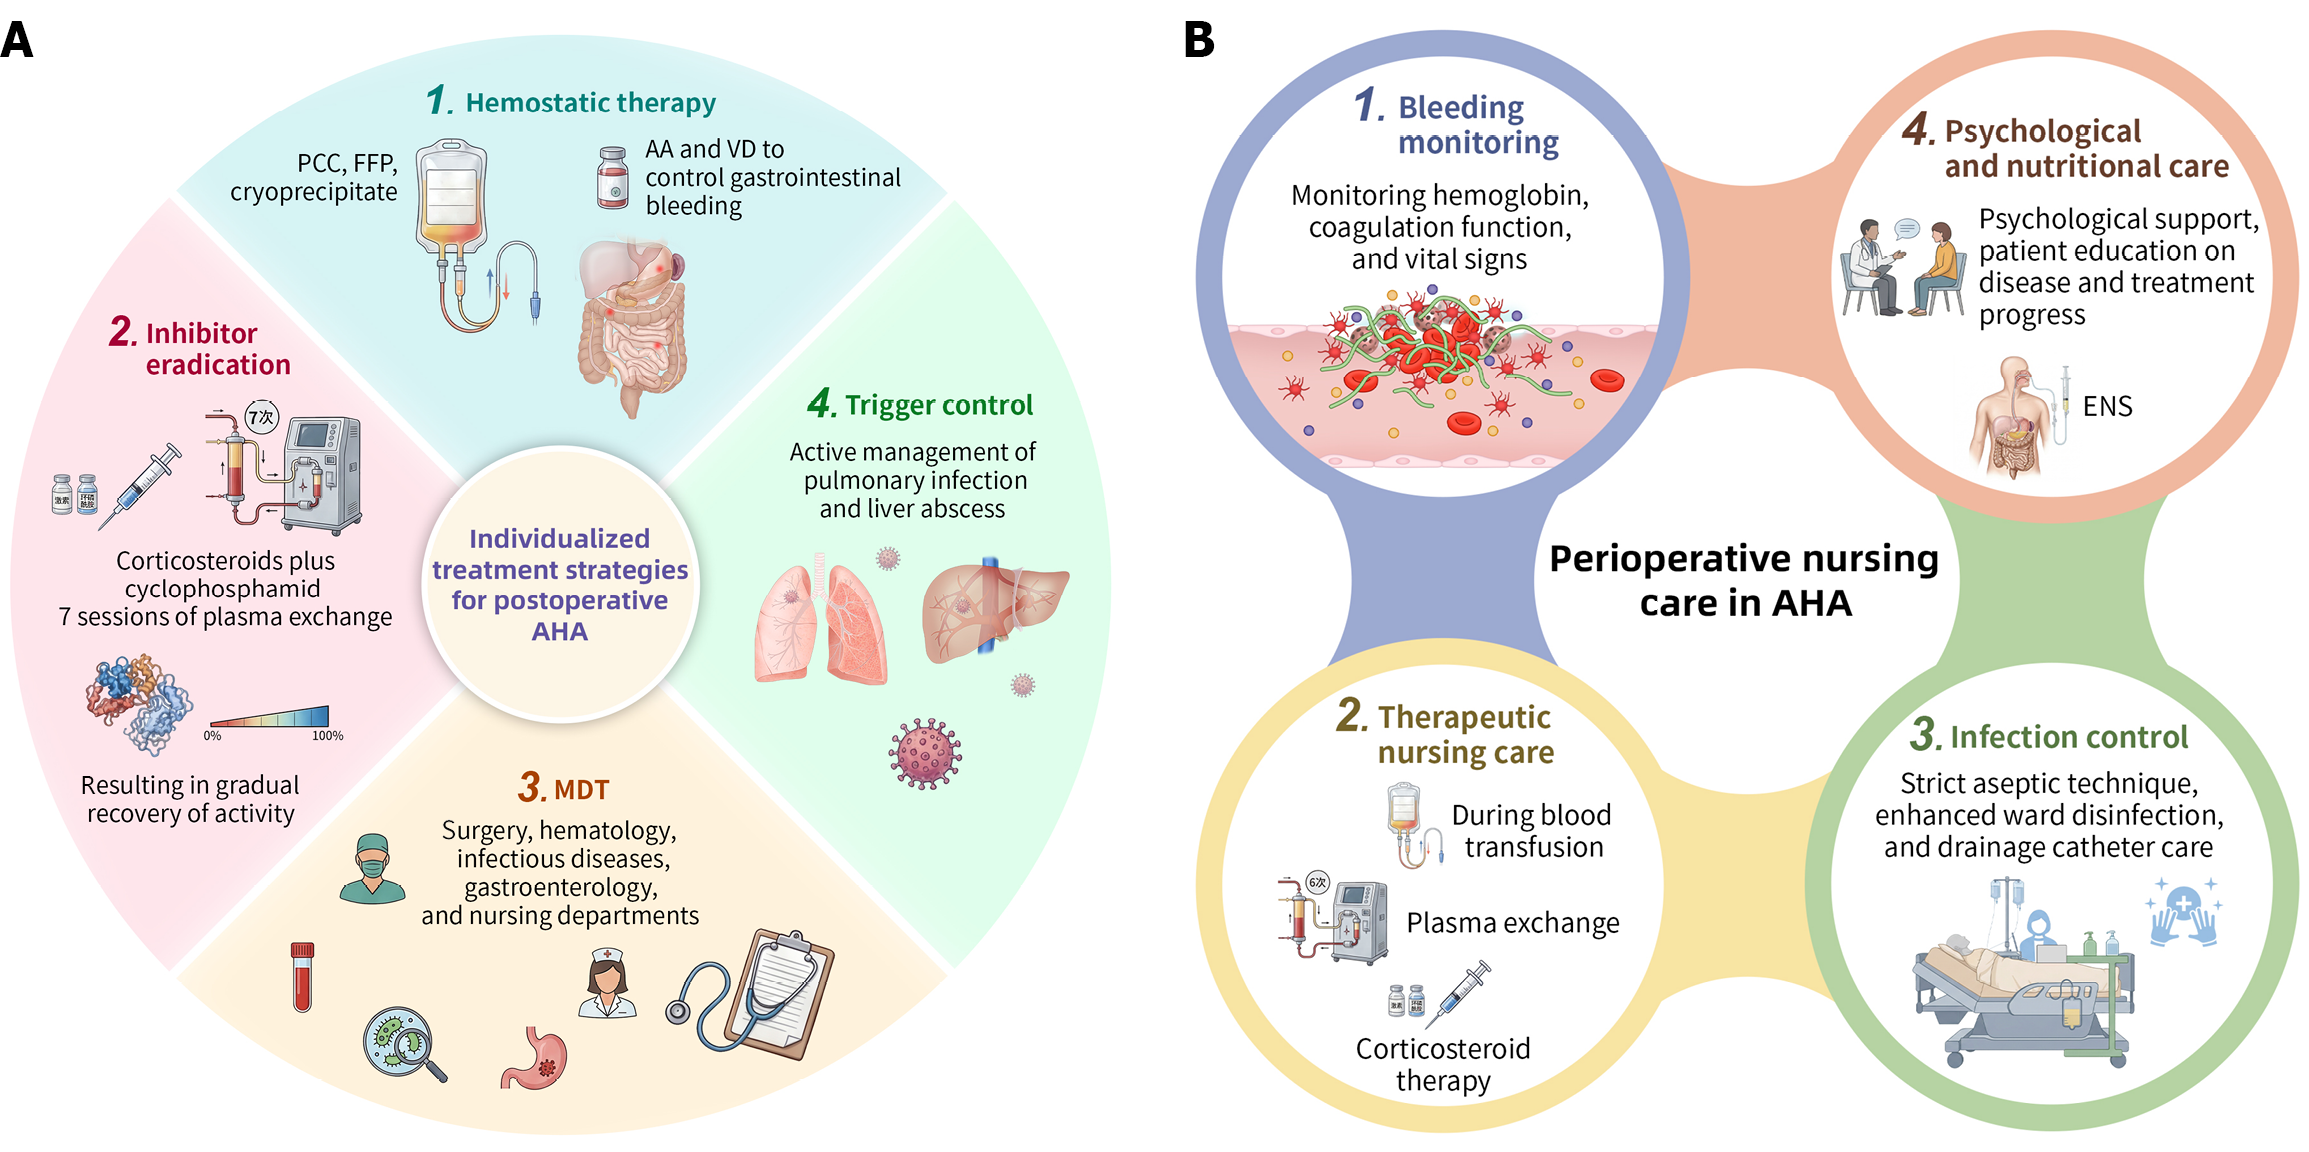
Figure 4 Treatment strategy and nursing key points chart.
A: Individualized treatment strategies for postoperative acquired hemophilia A (AHA); B: Perioperative nursing care for AHA. AHA: Acquired hemophilia A; PCC: Prothrombin complex concentrate; FFP: Fresh frozen plasma; AA: Antifibrinolytic agents; VD: Vasoactive drugs; FVIII: Factor VIII; MDT: Multidisciplinary collaboration; ENS: Enteral nutritional support.
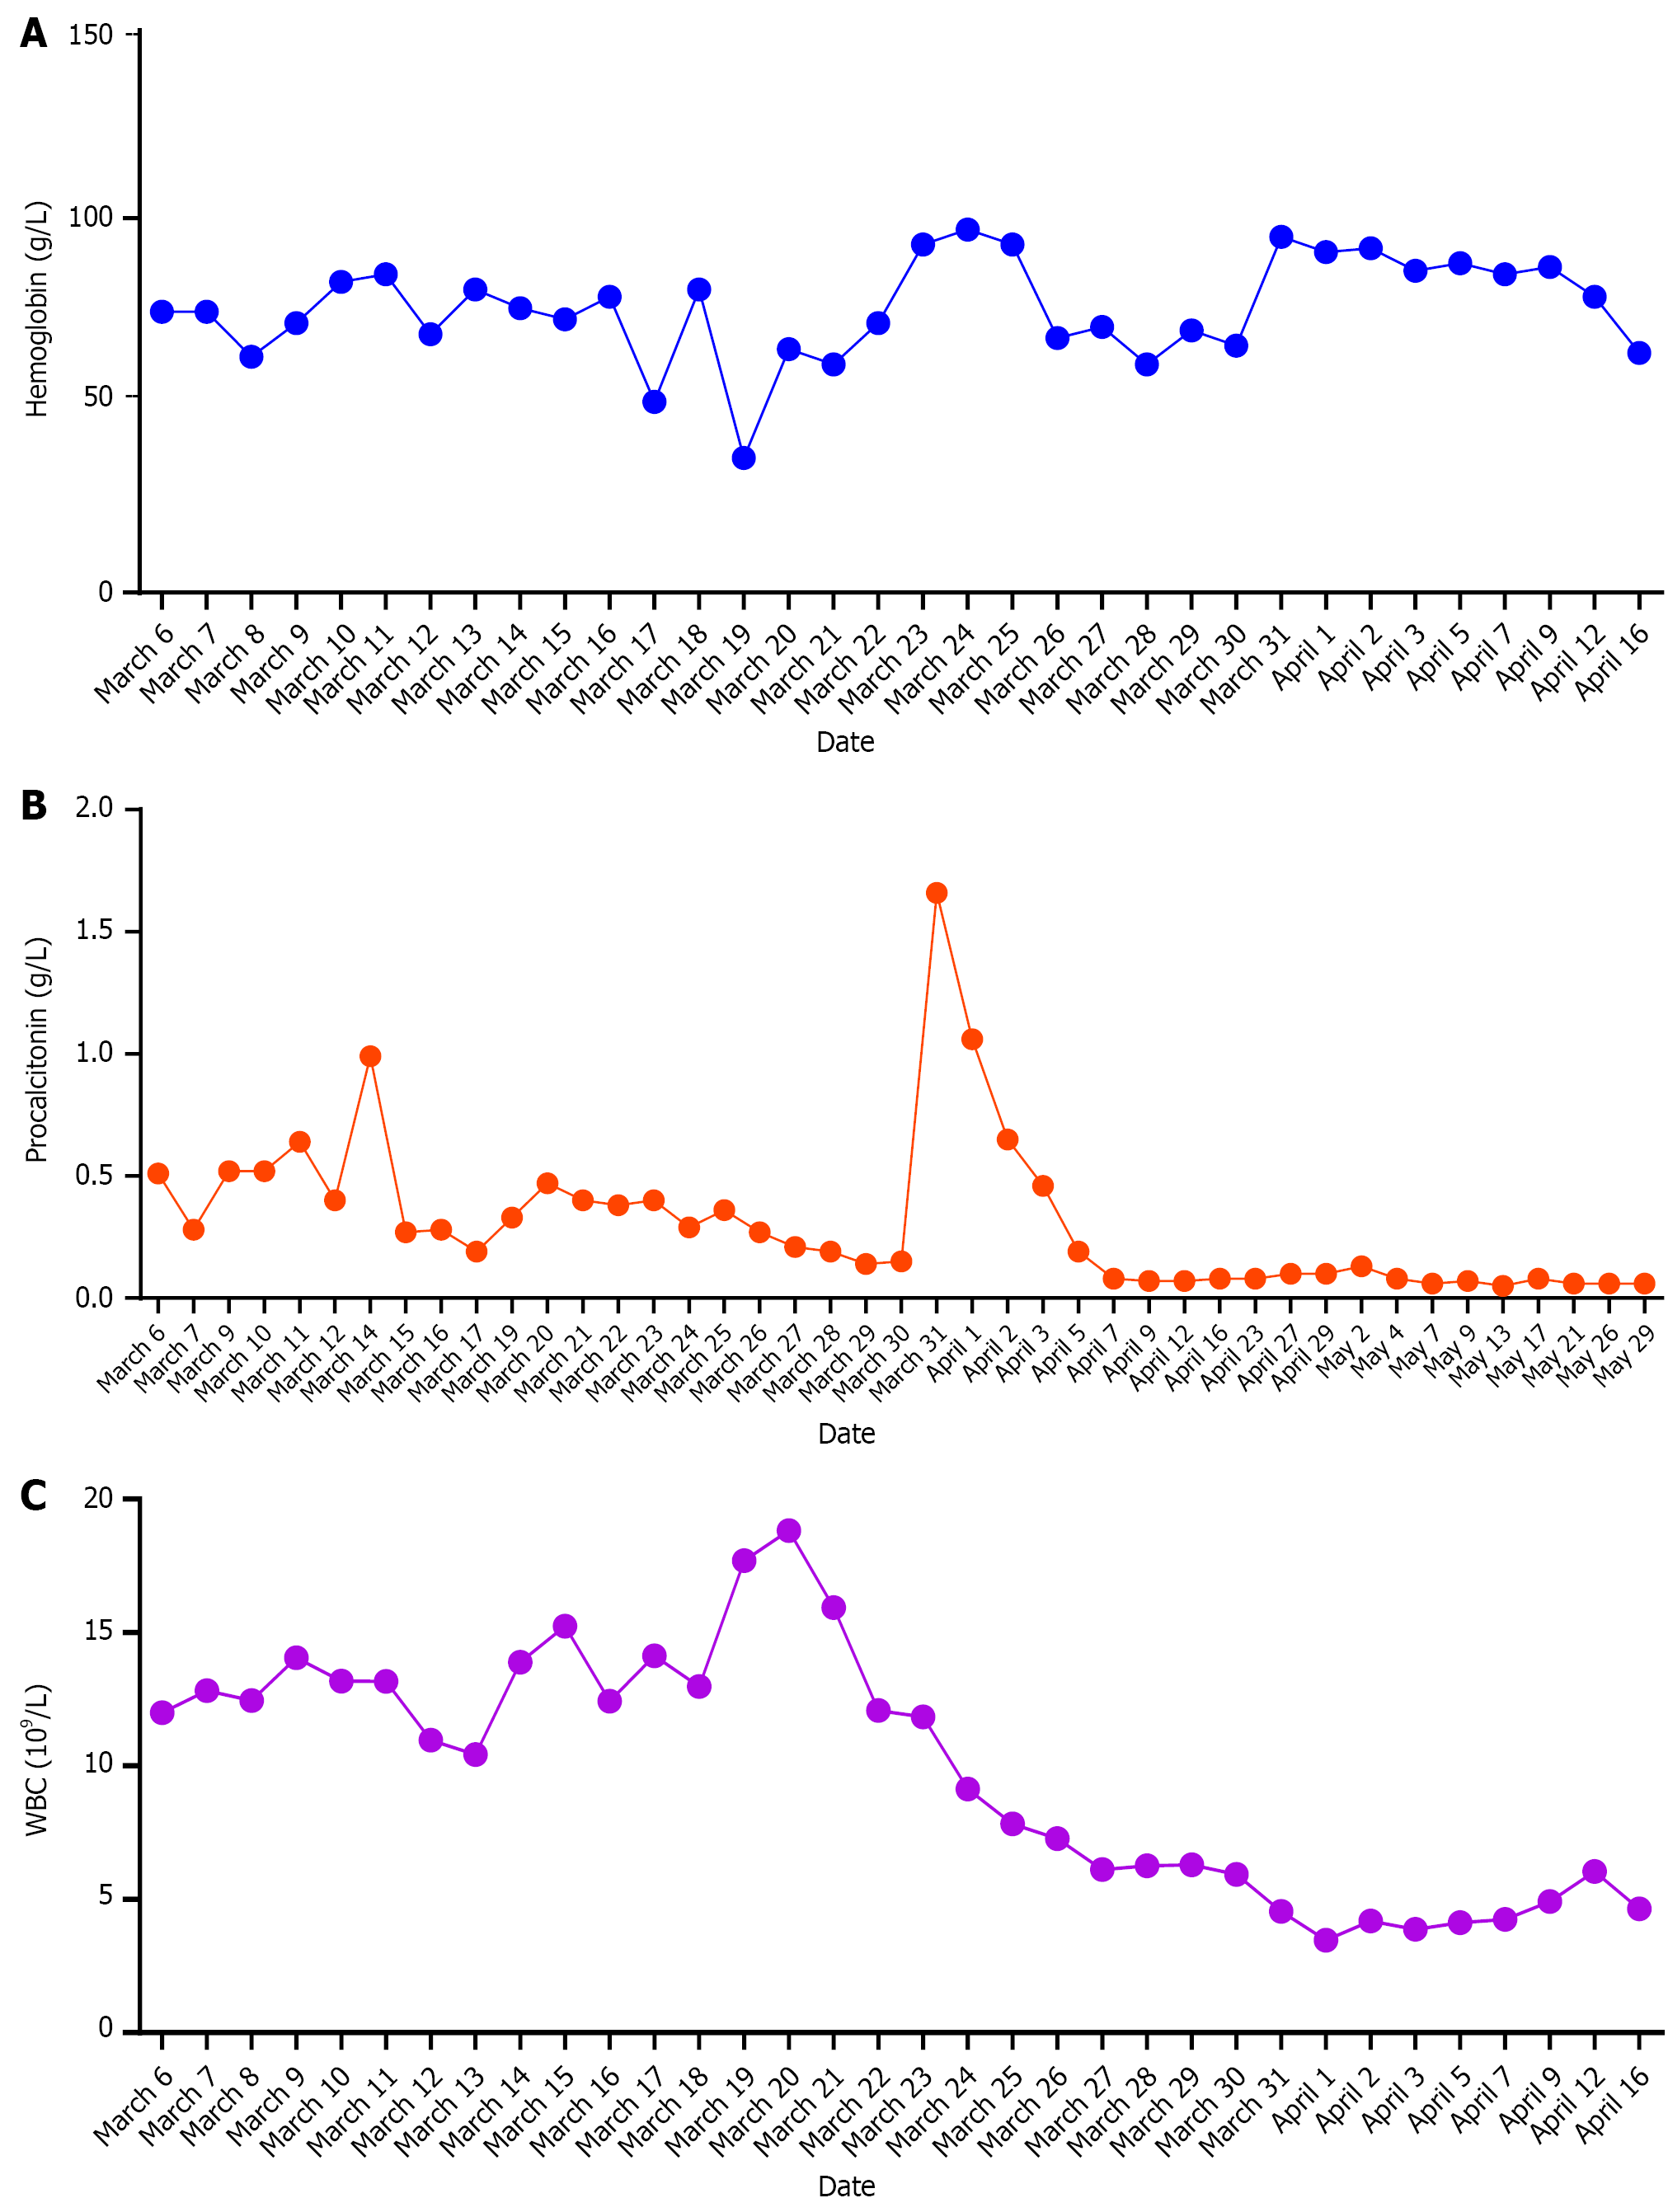
Figure 5 Trend chart of hemoglobin, procalcitonin, and white blood cell count.
A: Hemoglobin; B: Procalcitonin; C: White blood cell count. Hemoglobin levels progressively decreased after surgery, albeit with fluctuation during the diagnosis and treatment process. WBC: White blood cell.
- Citation: Yuan SR, Cao L, Li XJ, Cao Y. Acquired hemophilia A following choledochal cyst excision - highlighting postoperative bile leak and infection as potential triggers: A case report. World J Gastrointest Surg 2026; 18(11): 125182
- URL: https://www.wjgnet.com/1948-9366/full/v18/i11/125182.htm
- DOI: https://dx.doi.org/10.4240/wjgs.125182