Copyright
©The Author(s) 2015.
World J Diabetes. Apr 15, 2015; 6(3): 500-507
Published online Apr 15, 2015. doi: 10.4239/wjd.v6.i3.500
Published online Apr 15, 2015. doi: 10.4239/wjd.v6.i3.500
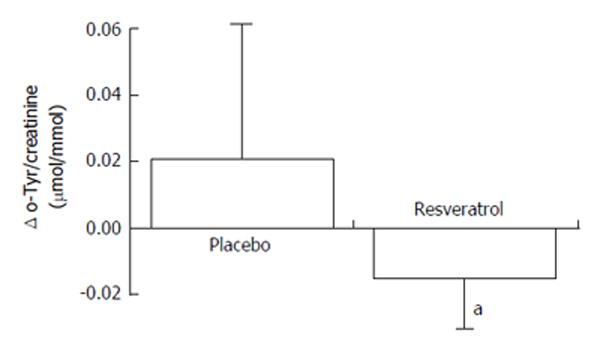
Figure 1 Changes in urinary ortho-tyrosine:creatinine excretion after resveratrol treatment.
For each participant, the value measured at baseline was subtracted from that measured at week 4 (i.e., Δ o-Tyr:creatinine ratio), and then the resulting values were averaged within the respective groups. The values are the means, with the standard deviations represented by vertical bars. aMean values were significantly different (P = 0.043). Comparisons were performed using ANOVA and Bonferroni post hoc tests; P < 0.05 was regarded as statistically significant. Republished with permission of Cambridge University Press from Brasnyó et al[18]. o-Try: Ortho-tyrosine.
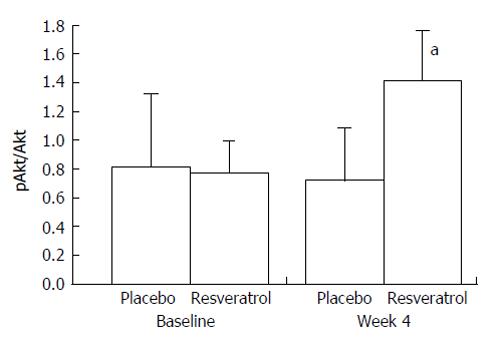
Figure 2 Increase in protein kinase B phosphorylation in platelets upon resveratrol treatment.
Values are the means, with the standard deviations represented by vertical bars. aMean values were significantly different for baseline vs week 4 within the resveratrol group (P = 0.032). Comparisons were performed using ANOVA and post-hoc tests; P < 0.05 was regarded as statistically significant. Republished with permission of Cambridge University Press from Brasnyó et al[18]. pAkt: Protein kinase B phosphorylation.
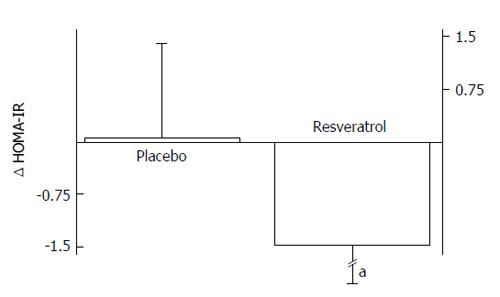
Figure 3 Decrease in homeostasis model of assessment for insulin resistance upon resveratrol treatment.
For each participant, the value measured at baseline was subtracted from that measured at week 4 (i.e., Δ HOMA-IR), and then the resulting values were averaged within the respective groups. Values are the means with the standard deviations represented by vertical bars. aMean values were significantly different for the resveratrol group vs the placebo group (P = 0.044), comparisons were performed using ANOVA and Bonferroni post hoc tests; P < 0.05 was regarded as statistically significant. Republished with permission of Cambridge University Press from Brasnyó et al[18]. HOMA-IR: Homeostasis model of assessment for insulin resistance.
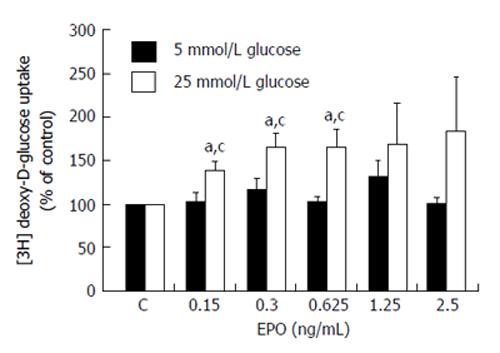
Figure 4 Effects of treatment with r-mo-erythropoietin on the rate of [3H]-deoxy-D-glucose uptake in 3T3-L1 adipocytes cultured in either normal (5 mmol/L) or high (25 mmol/L) glucose medium (insulin: n = 8 and n = 6; r-mo-erythropoietin: n = 6 and n = 5, respectively).
aP < 0.05 vs control in the same medium; cP < 0.05 between the two media; Comparisons with control were performed using a one-sample t-test; pairwise comparisons between 5 and 25 mmol/L glucose-cultured cells were performed using a paired samples t-test. Republished with permission of Georg Thieme Verlag KG Stuttgart, New York from Mikolás et al[37]. EPO: Erythropoietin.
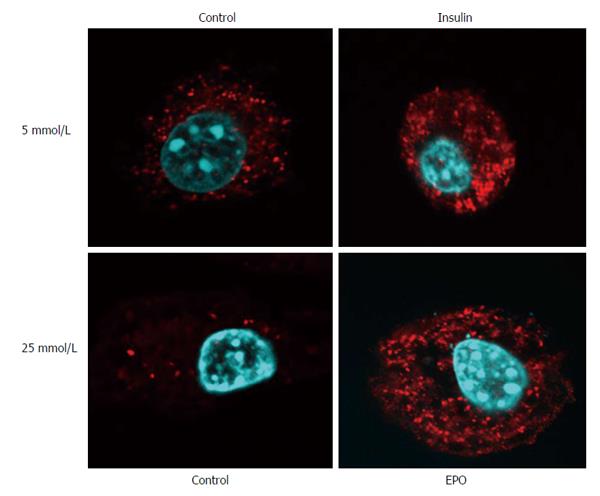
Figure 5 GLUT4 translocation (red fluorescence) after a 30 min treatment with insulin (400 nmol/L) or r-mo-erythropoietin (40 ng/mL) in 3T3-L1 adipocytes cultured in high glucose (25 mmol/L) or normal glucose (5 mmol/L) medium compared with that in untreated cells (Control).
Nuclei are shown with blue fluorescence. The GLUT4 translocation was apparent after both the erythropoietin (EPO) and insulin treatments, whereas it was not present in untreated cells. Representative images are shown from n = 3 independent experiments. Republished with permission of Georg Thieme Verlag KG Stuttgart, New York from Mikolás et al[37].
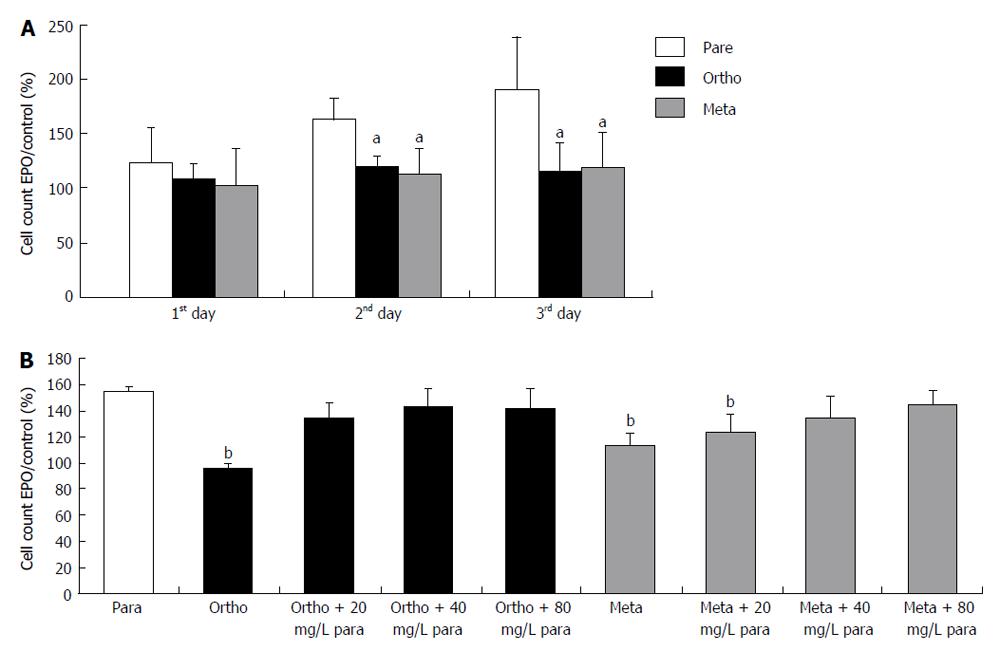
Figure 6 Effect of para-, ortho-, or meta-tyrosine supplementation on the proliferation of cells cultured in medium with or without erythropoietin.
A: The time-dependent increase in cell count in medium supplemented with p-Tyr (open bars), o-Tyr (black bars) or m-Tyr (grey bars) (aP < 0.05 vs p-Tyr cultured cells on the same day; n = 10); B: The alterations in the cell counts after incubation for 3 d in medium containing o- or m-Tyr and the indicated additional amount of para-tyrosine (bP < 0.001 vs p-Tyr-containing medium; n = 5). The results are expressed as the ratio of the protein content of erythropoietin (EPO) and non-EPO (control) cells (aP < 0.05 vs p-Tyr cultured cells; n = 10). Comparisons were performed using ANOVA and Bonferroni’s post-hoc test. Republished with permission of S Karger AG, Basel from Mikolás et al[21]. p-Tyr: Para-tyrosine; o-Tyr: Ortho-tyrosine; m-Tyr: Meta-tyrosine.
Figure 7 Relative meta- and ortho-tyrosine content (i.
e., ratios of meta- and ortho-tyrosine/total tyrosine) of the cellular proteins of TF-1 cells (A and B, respectively). bP < 0.001 vs p- and m-Tyr cultured cells; dP < 0.001 vs o-Tyr cultured control cells; fP < 0.001 vs p- and o-Tyr cultured erythroblasts; n = 10. Comparisons were performed using ANOVA and Bonferroni’s post-hoc test. Republished with permission of S Karger AG, basel from Mikolás et al[21]. p-Tyr: Para-tyrosine; o-Tyr: Ortho-tyrosine; m-Tyr: Meta-tyrosine.
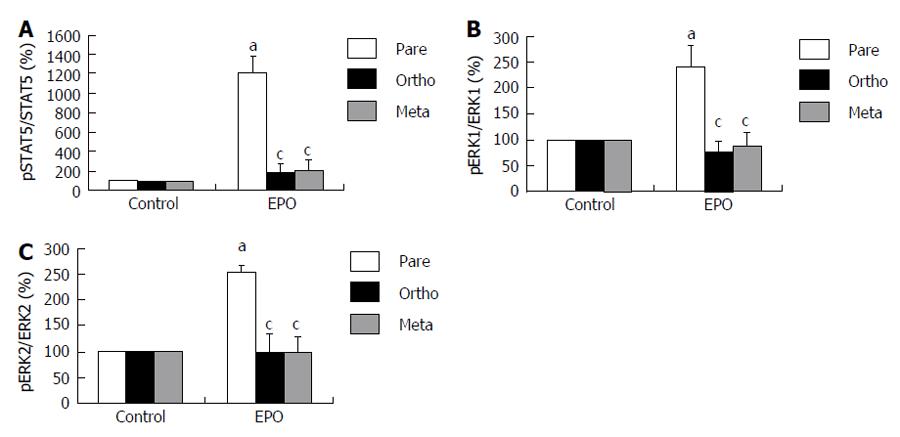
Figure 8 Densitometric analyses of the phosphorylation of signal transducer and activator of transcription 5 (A: n = 3); densitometric analysis of extracellular signal regulated kinase 1 (B: n = 4) and extracellular signal regulated kinase 2 (C: n = 4).
The data are expressed as the percent of untreated (control) cells. aP < 0.05; erythropoietin (EPO) vs control (one-sample t-test); cP < 0.05 vs para EPO (one-way ANOVA). Republished with permission of S Karger AG, basel from Mikolás et al[21].
Figure 9 The ortho-tyrosine levels of consecutive arterial segments isolated from rats (A).
There were significant differences (aP < 0.05) in the o-Tyr levels among the thoracic aorta (n = 7), abdominal aorta (n = 7), and the femoral artery (n = 9) of rats. The changes in the o-Tyr levels in the consecutive arterial segments of rats after H2O2 + AT treatment (i.e., high oxidative state), SOD + CAT treatment (i.e., low oxidative state), and aortic banding were compared with those of the control vessels (B). Control: untreated, control vessels (thoracic: n = 7; abdominal: n = 7; femoral: = 9); H2O2 + AT: hydrogen peroxide- and aminotriazole-incubated vessels (aminotriazole is an inhibitor of catalase) (thoracic: n = 5; abdominal: n = 5; femoral: n = 4); SOD + CAT: superoxide dismutase- and catalase-incubated vessels (thoracic: n = 5; abdominal: n = 5; femoral: n = 5); aortic banding (thoracic: n = 5; abdominal: n = 4; femoral: n = 4). Data are the mean ± SEM. The o-Tyr levels are relative to the phenylalanine (Phe) levels (Panels A and B) and are expressed as the percentage of the control vessels (Pane B). cP < 0.05; NS, P > 0.05 (ANOVA). Republished with permission of Informa Healthcare from Szijártó et al[19]. o-Tyr: Ortho-tyrosine; NS: Non-significant; SEM: Standard error of the mean.
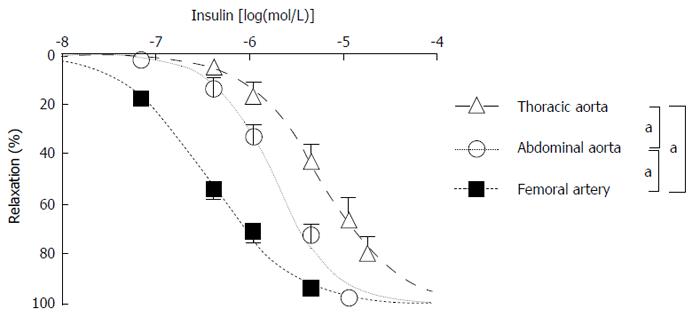
Figure 10 The dose–response curve of the insulin-induced relaxation of consecutive arterial segments isolated from rats.
The relaxation in response to insulin was the greatest in the femoral artery (n = 7) and was less pronounced in the abdominal aorta (n = 7) and even less in the thoracic aorta (n = 7). The relaxation is depicted as a function of the logarithm of the insulin dose. Data are the mean ± SEM. aP < 0.05; NS, P > 0.05 (Extra sum-of-squares F test). Republished with permission of Informa Healthcare from Szijártó et al[19]. NS: Non-significant; SEM: Standard error of the mean.
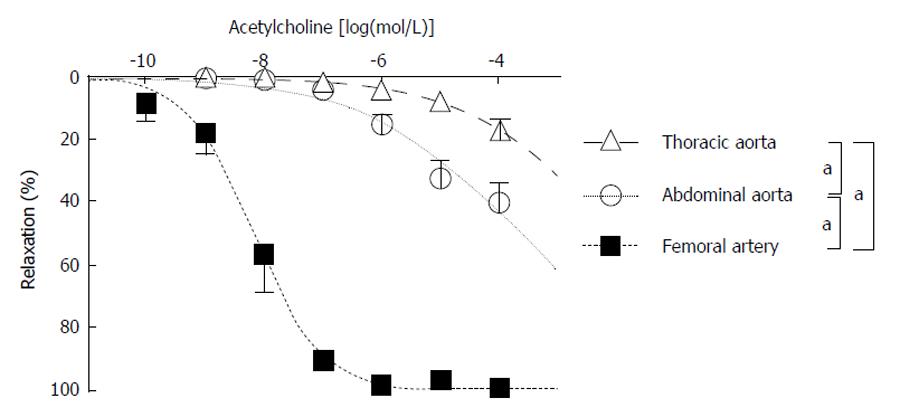
Figure 11 Acetylcholine-induced vasorelaxation in the abdominal aorta and femoral artery.
Data are the means ± SEM. aP < 0.05; NS, P > 0.05 (Extra sum-of-squares F test). NS: Non-significant.
- Citation: Molnár GA, Mikolás EZ, Szijártó IA, Kun S, Sélley E, Wittmann I. Tyrosine isomers and hormonal signaling: A possible role for the hydroxyl free radical in insulin resistance. World J Diabetes 2015; 6(3): 500-507
- URL: https://www.wjgnet.com/1948-9358/full/v6/i3/500.htm
- DOI: https://dx.doi.org/10.4239/wjd.v6.i3.500


