Copyright
©The Author(s) 2015.
World J Diabetes. Apr 15, 2015; 6(3): 500-507
Published online Apr 15, 2015. doi: 10.4239/wjd.v6.i3.500
Published online Apr 15, 2015. doi: 10.4239/wjd.v6.i3.500
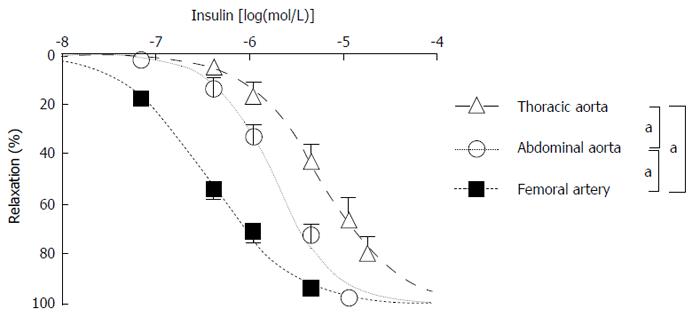
Figure 10 The dose–response curve of the insulin-induced relaxation of consecutive arterial segments isolated from rats.
The relaxation in response to insulin was the greatest in the femoral artery (n = 7) and was less pronounced in the abdominal aorta (n = 7) and even less in the thoracic aorta (n = 7). The relaxation is depicted as a function of the logarithm of the insulin dose. Data are the mean ± SEM. aP < 0.05; NS, P > 0.05 (Extra sum-of-squares F test). Republished with permission of Informa Healthcare from Szijártó et al[19]. NS: Non-significant; SEM: Standard error of the mean.
- Citation: Molnár GA, Mikolás EZ, Szijártó IA, Kun S, Sélley E, Wittmann I. Tyrosine isomers and hormonal signaling: A possible role for the hydroxyl free radical in insulin resistance. World J Diabetes 2015; 6(3): 500-507
- URL: https://www.wjgnet.com/1948-9358/full/v6/i3/500.htm
- DOI: https://dx.doi.org/10.4239/wjd.v6.i3.500


