Copyright
©The Author(s) 2015.
World J Diabetes. Apr 15, 2015; 6(3): 500-507
Published online Apr 15, 2015. doi: 10.4239/wjd.v6.i3.500
Published online Apr 15, 2015. doi: 10.4239/wjd.v6.i3.500
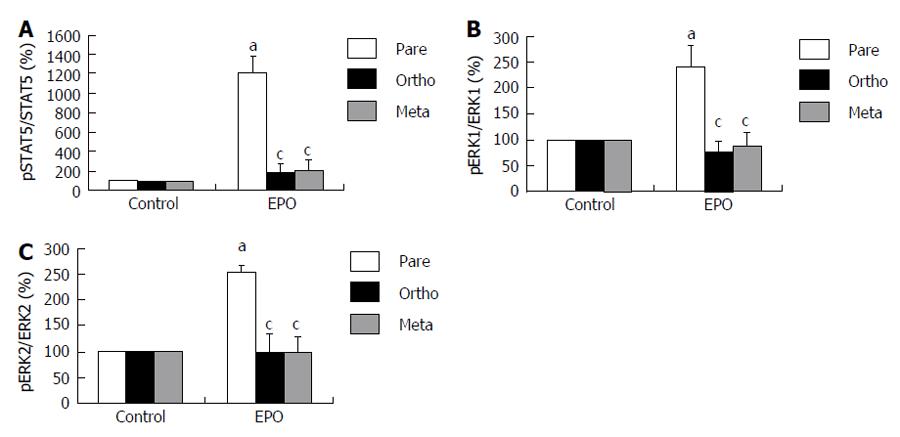
Figure 8 Densitometric analyses of the phosphorylation of signal transducer and activator of transcription 5 (A: n = 3); densitometric analysis of extracellular signal regulated kinase 1 (B: n = 4) and extracellular signal regulated kinase 2 (C: n = 4).
The data are expressed as the percent of untreated (control) cells. aP < 0.05; erythropoietin (EPO) vs control (one-sample t-test); cP < 0.05 vs para EPO (one-way ANOVA). Republished with permission of S Karger AG, basel from Mikolás et al[21].
- Citation: Molnár GA, Mikolás EZ, Szijártó IA, Kun S, Sélley E, Wittmann I. Tyrosine isomers and hormonal signaling: A possible role for the hydroxyl free radical in insulin resistance. World J Diabetes 2015; 6(3): 500-507
- URL: https://www.wjgnet.com/1948-9358/full/v6/i3/500.htm
- DOI: https://dx.doi.org/10.4239/wjd.v6.i3.500


