
















Copyright: ©Author(s) 2026.
World J Diabetes. Nov 15, 2026; 17(11): 124565
Published online Nov 15, 2026. doi: 10.4239/wjd.124565
Published online Nov 15, 2026. doi: 10.4239/wjd.124565
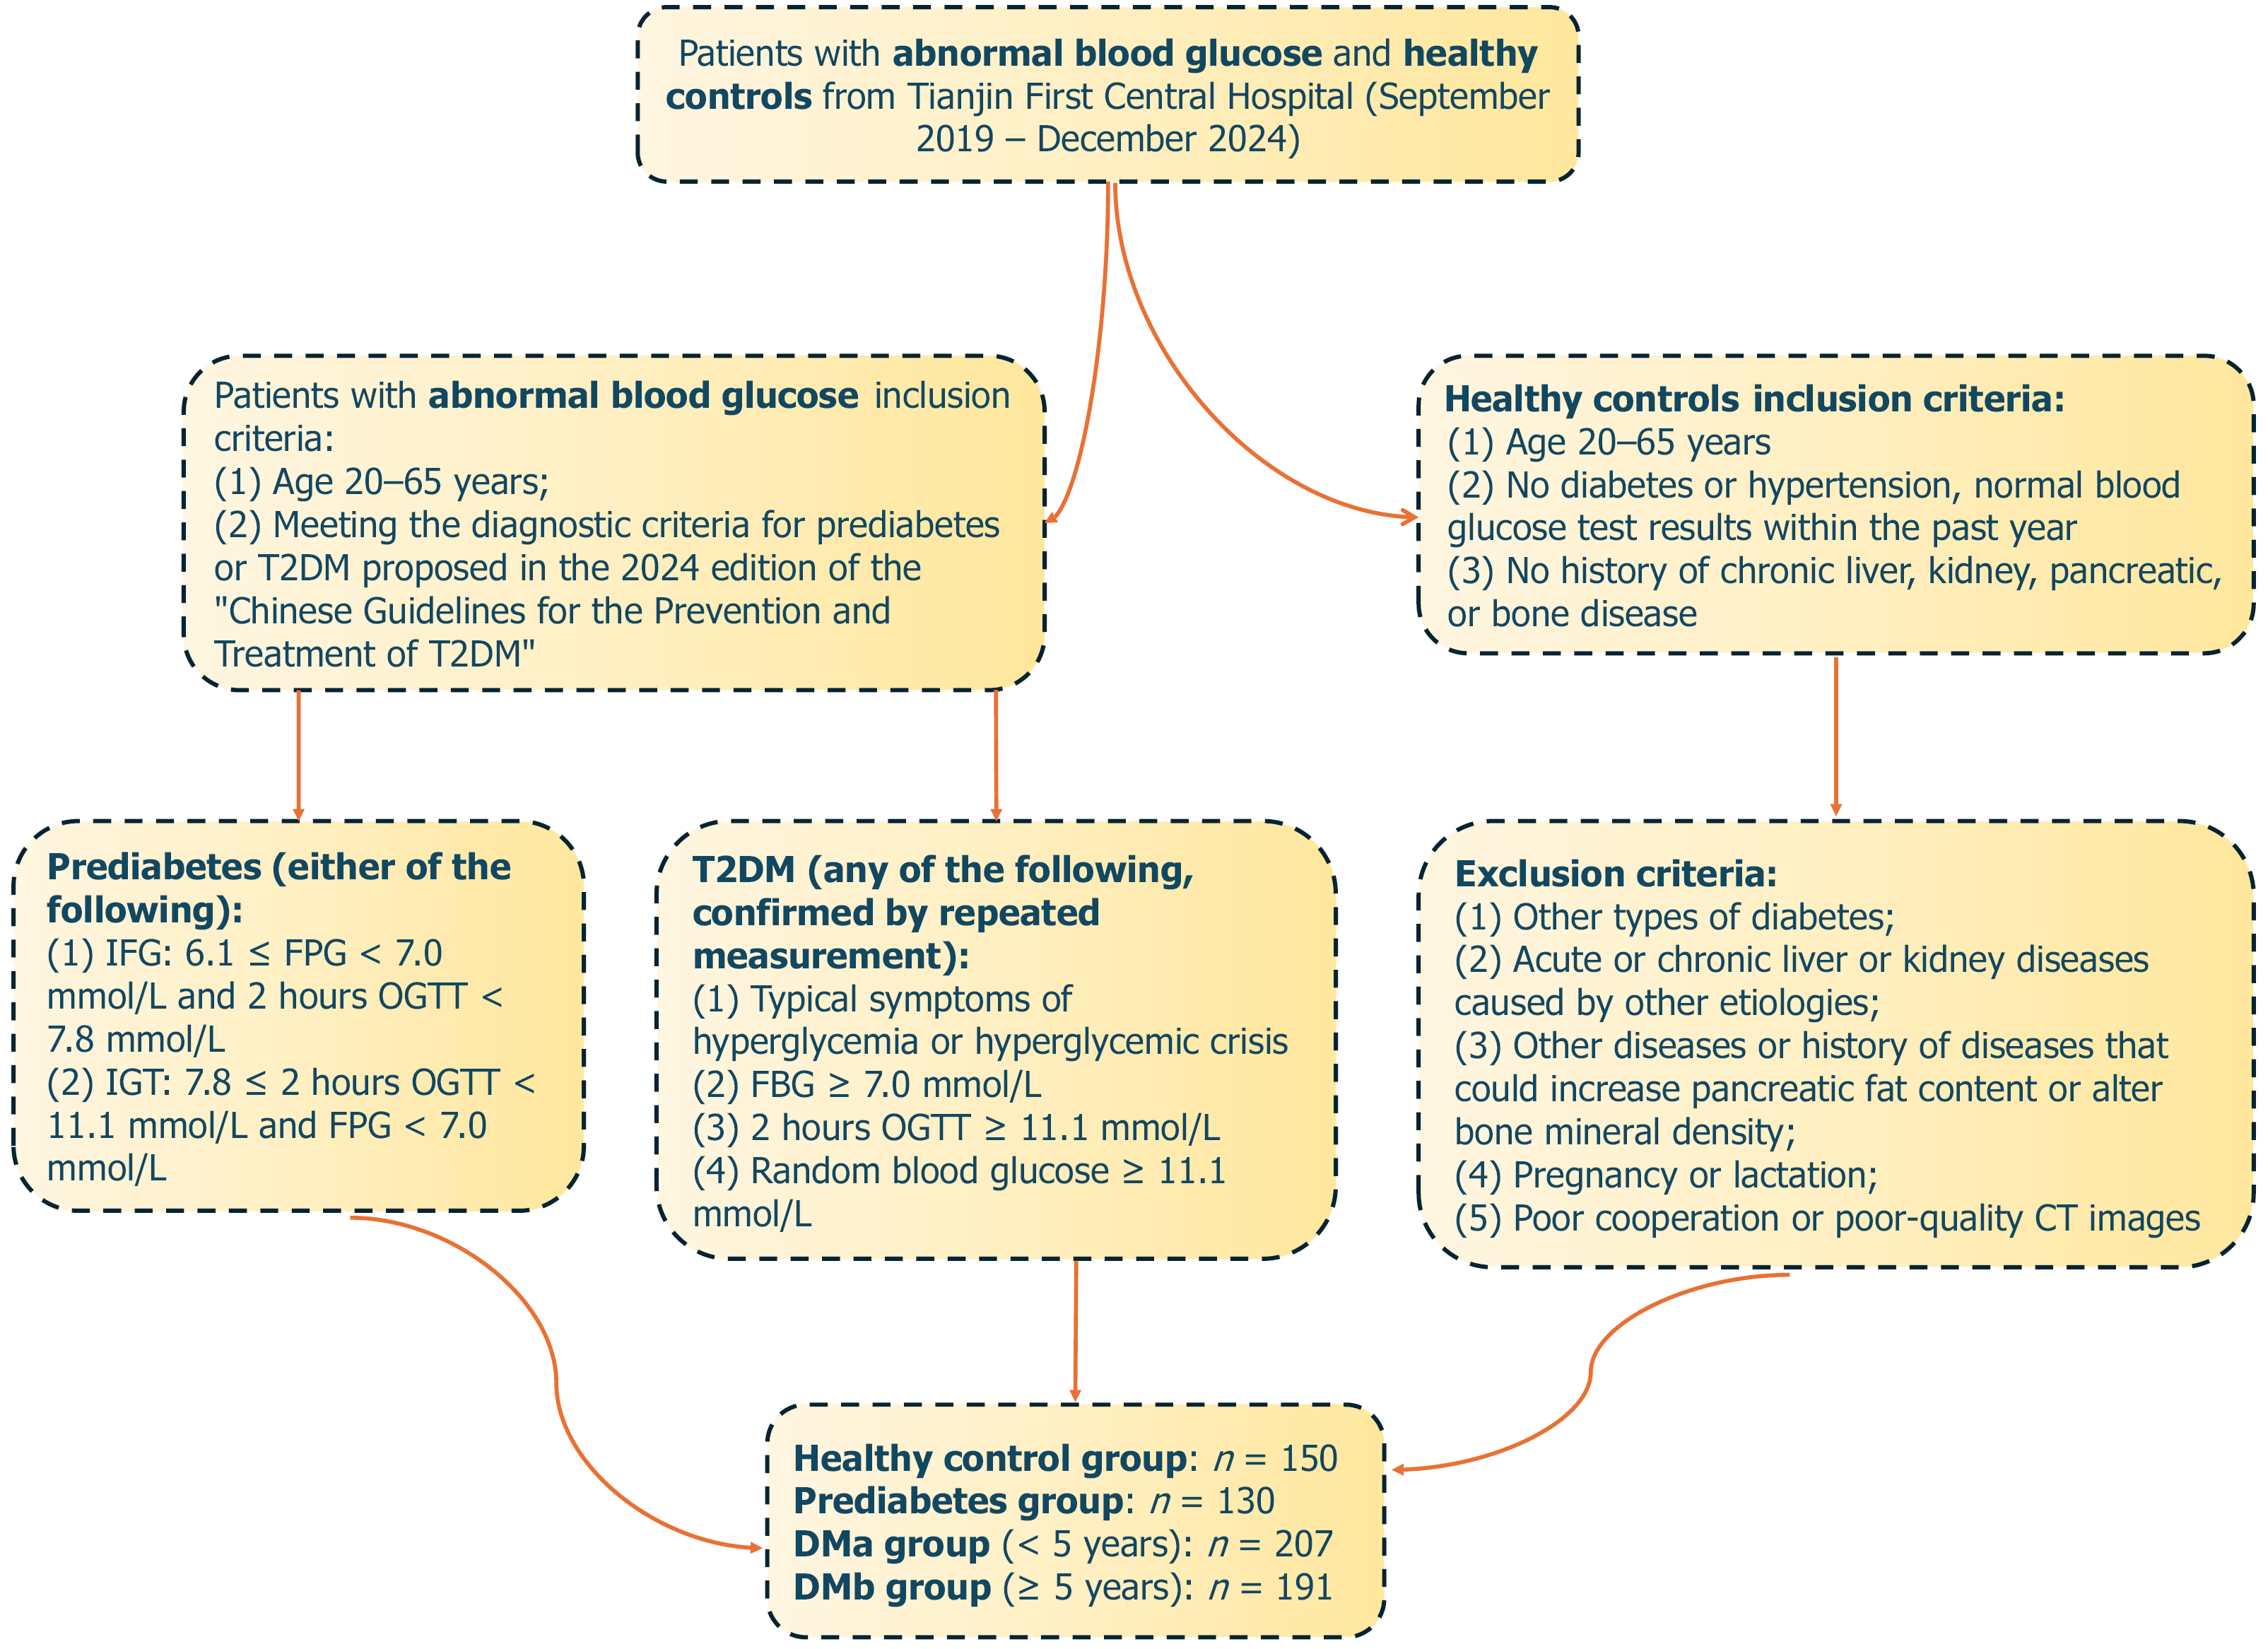
Figure 1 Flow chart for the inclusion of patients with prediabetes and type 2 diabetes mellitus.
T2DM: Type 2 diabetes mellitus; FPG: Fasting plasma glucose; IGT: Impaired glucose tolerance; OGTT: Oral glucose tolerance test; CT: Computed tomography; DMa: Type 2 diabetes mellitus with disease duration < 5 years; DMb: Type 2 diabetes mellitus with disease duration ≥ 5 years.
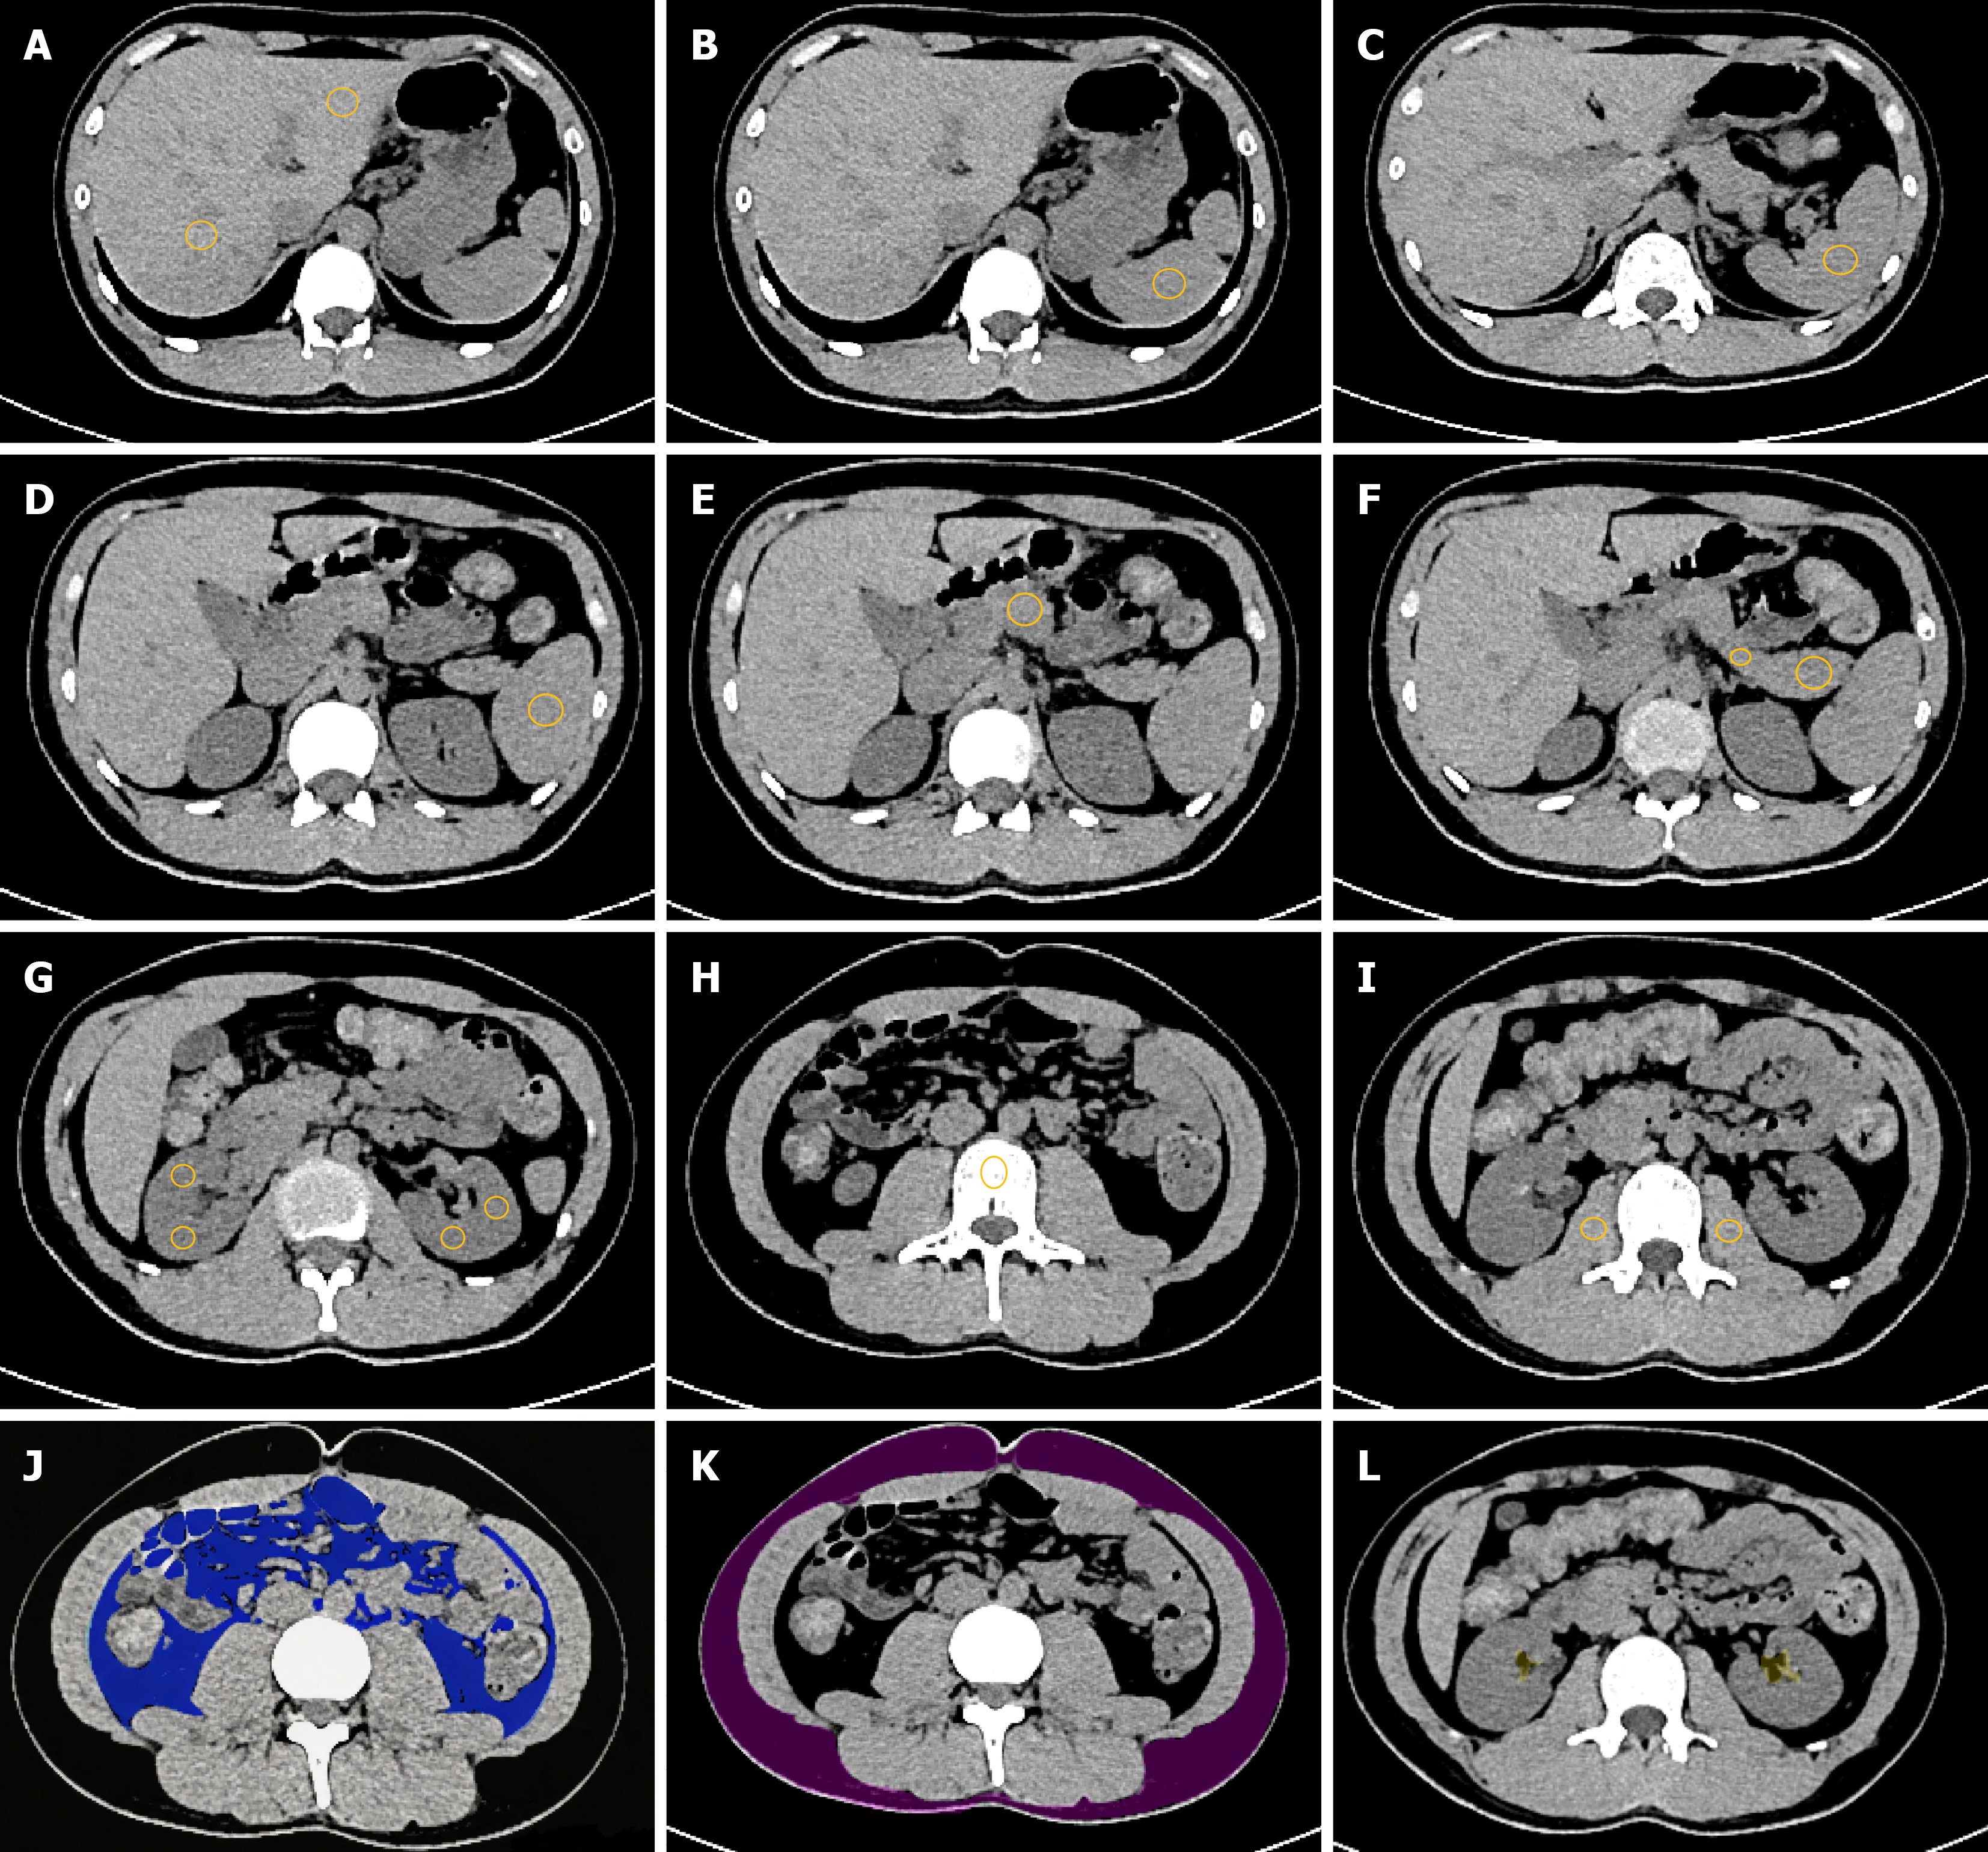
Figure 2 Schematic diagram of the placement and delineation of regions of interests for various abdominal organs, visceral, subcu
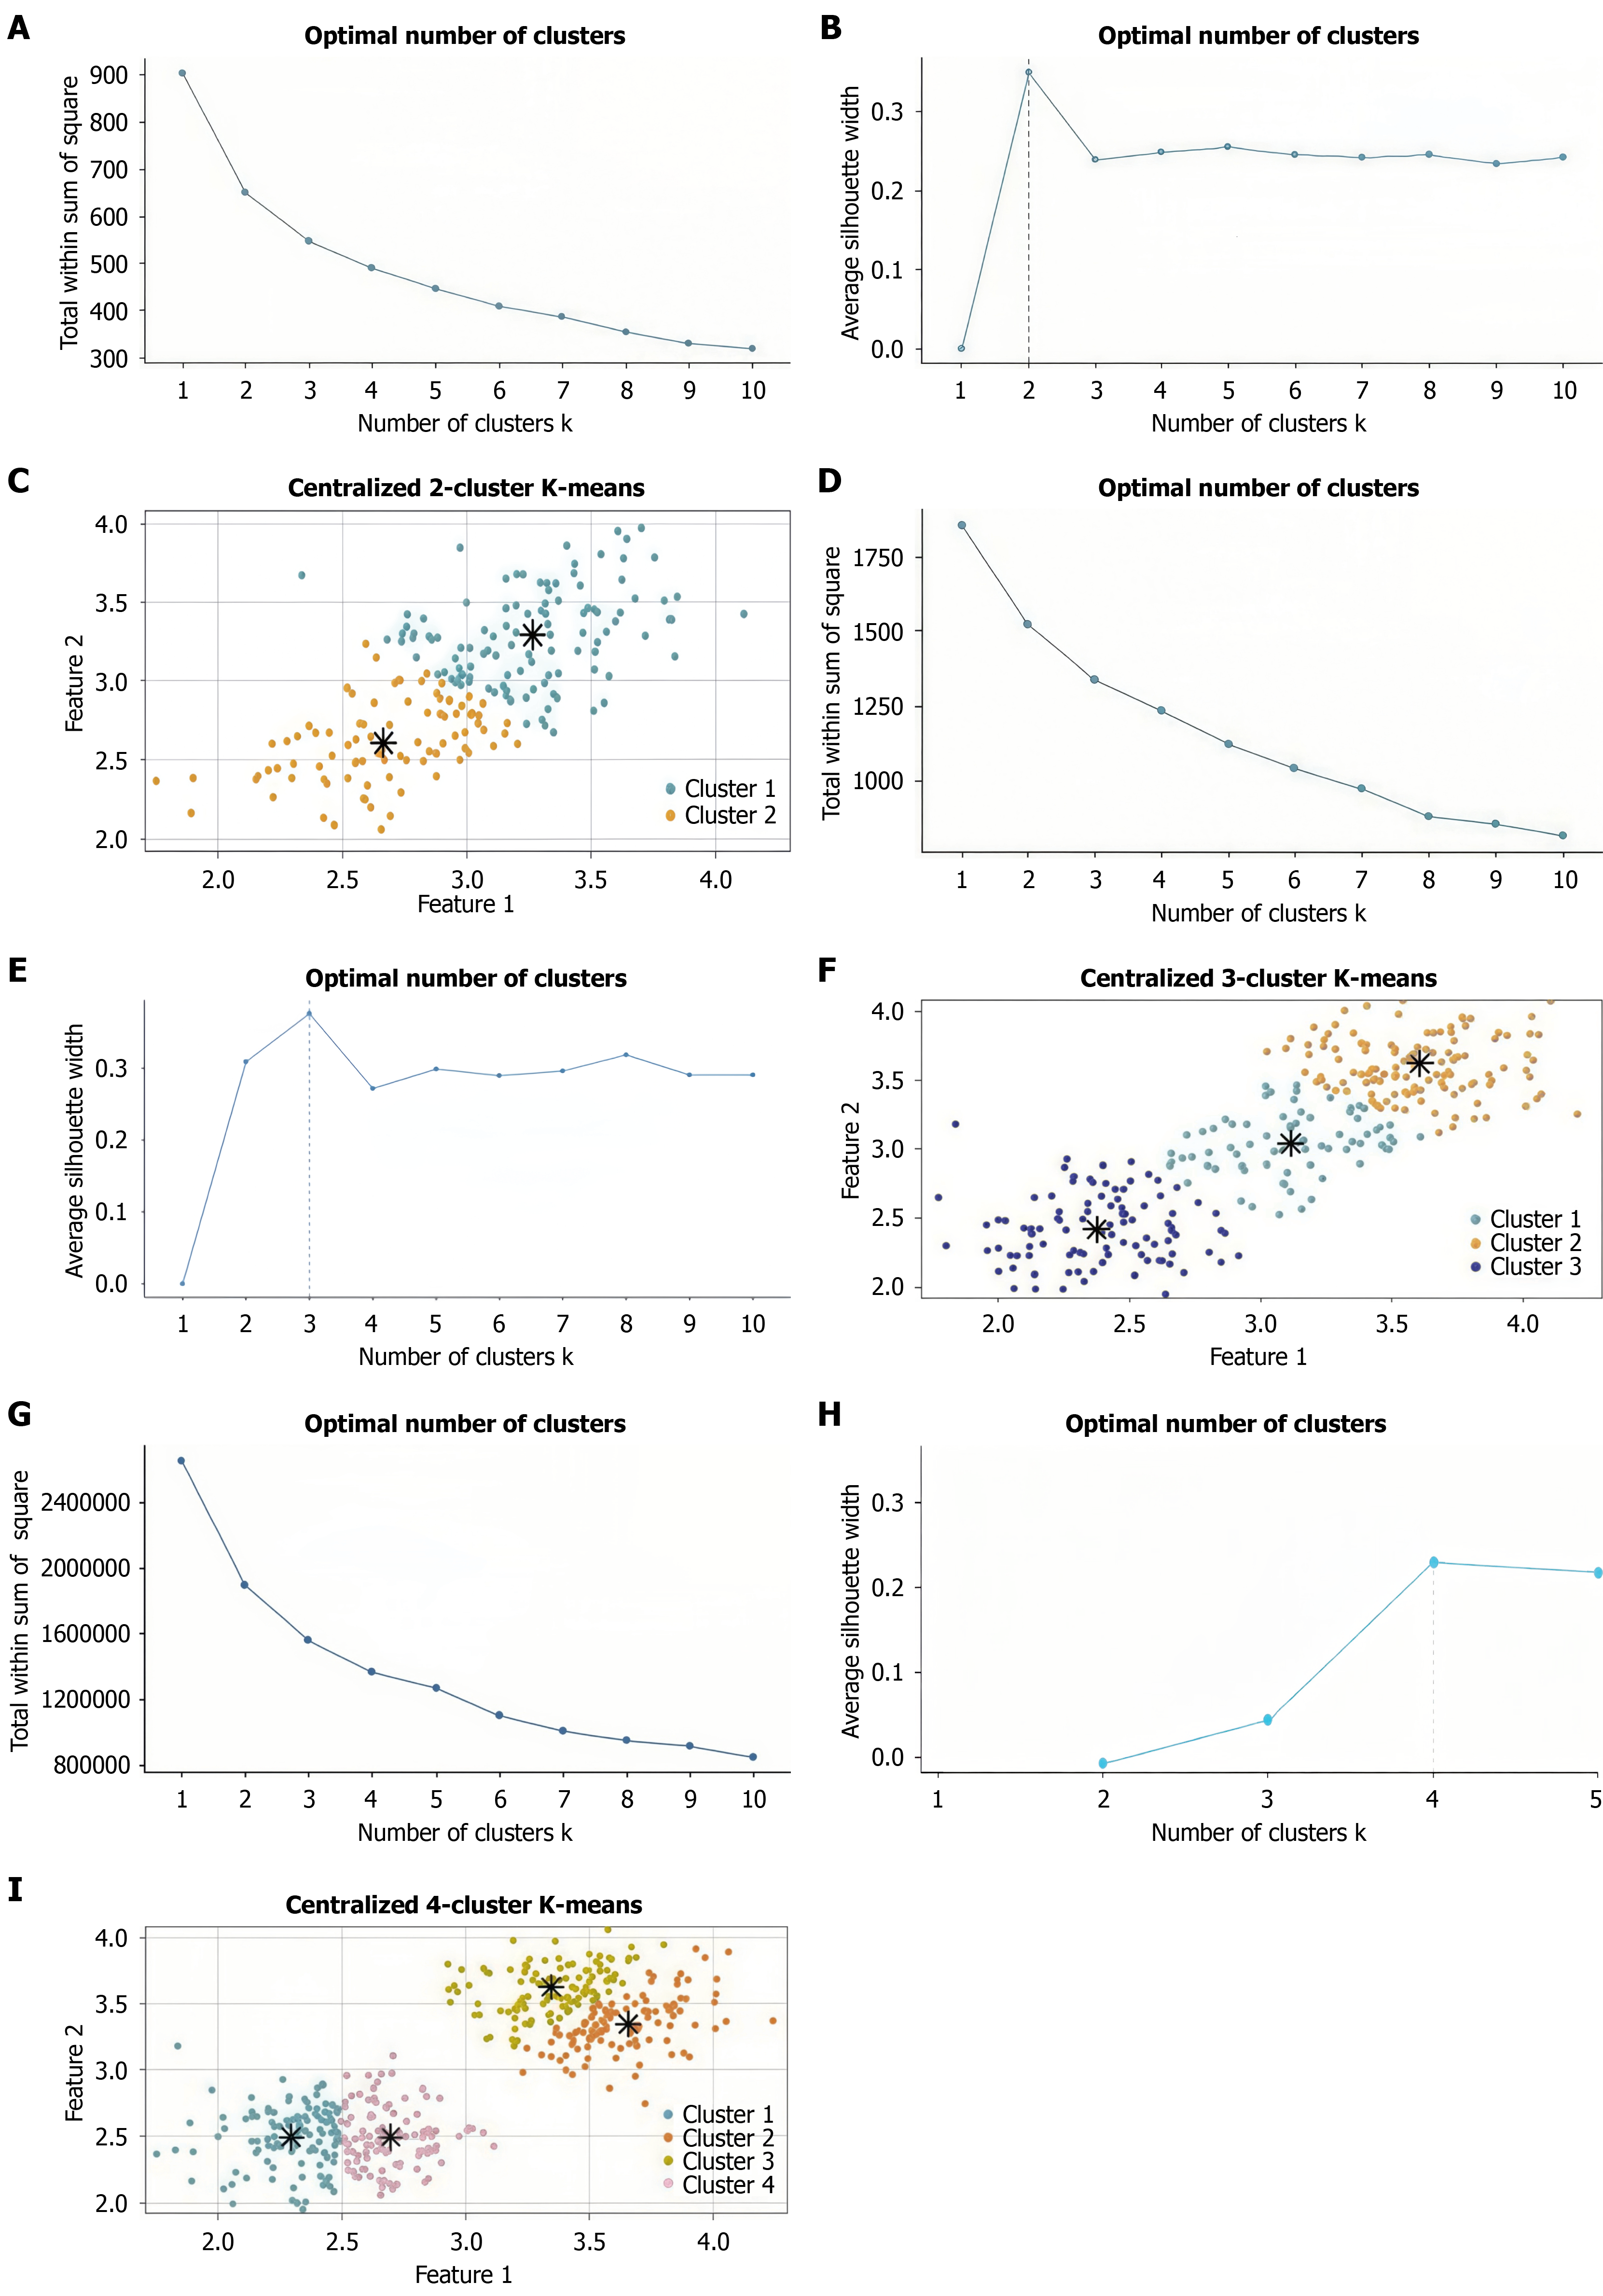
Figure 3 K-means clustering results of the pre-period group, type 2 diabetes mellitus with disease duration < 5 years group, and type 2 diabetes mellitus with disease duration ≥ 5 years group using R.
A-C: When k = 2, the decline rate of within-cluster sum of squares slows down and the average silhouette coefficient is the highest. Set as 2 the final number of clusters, and there is no obvious mixing between the two clusters; D-F: When k = 3, the decline rate of WSS significantly slows down and the average silhouette coefficient is the highest. Set 3 as the final number of clusters, and there is no obvious mixing between the three clusters. G-I: When k = 4, the decline rate of WSS significantly slows down and the average silhouette coefficient is the highest. Set 4 as the final number of clusters, and there is no obvious mixing between the four clusters.
- Citation: Yang FZ, Li HY, Li G, Zhang YL, Ji Q. Cluster analysis of computed tomography identifies duration-associated abdominal fat deposition in type 2 diabetes mellitus. World J Diabetes 2026; 17(11): 124565
- URL: https://www.wjgnet.com/1948-9358/full/v17/i11/124565.htm
- DOI: https://dx.doi.org/10.4239/wjd.124565