
















Copyright: ©Author(s) 2026.
World J Diabetes. Nov 15, 2026; 17(11): 124565
Published online Nov 15, 2026. doi: 10.4239/wjd.124565
Published online Nov 15, 2026. doi: 10.4239/wjd.124565
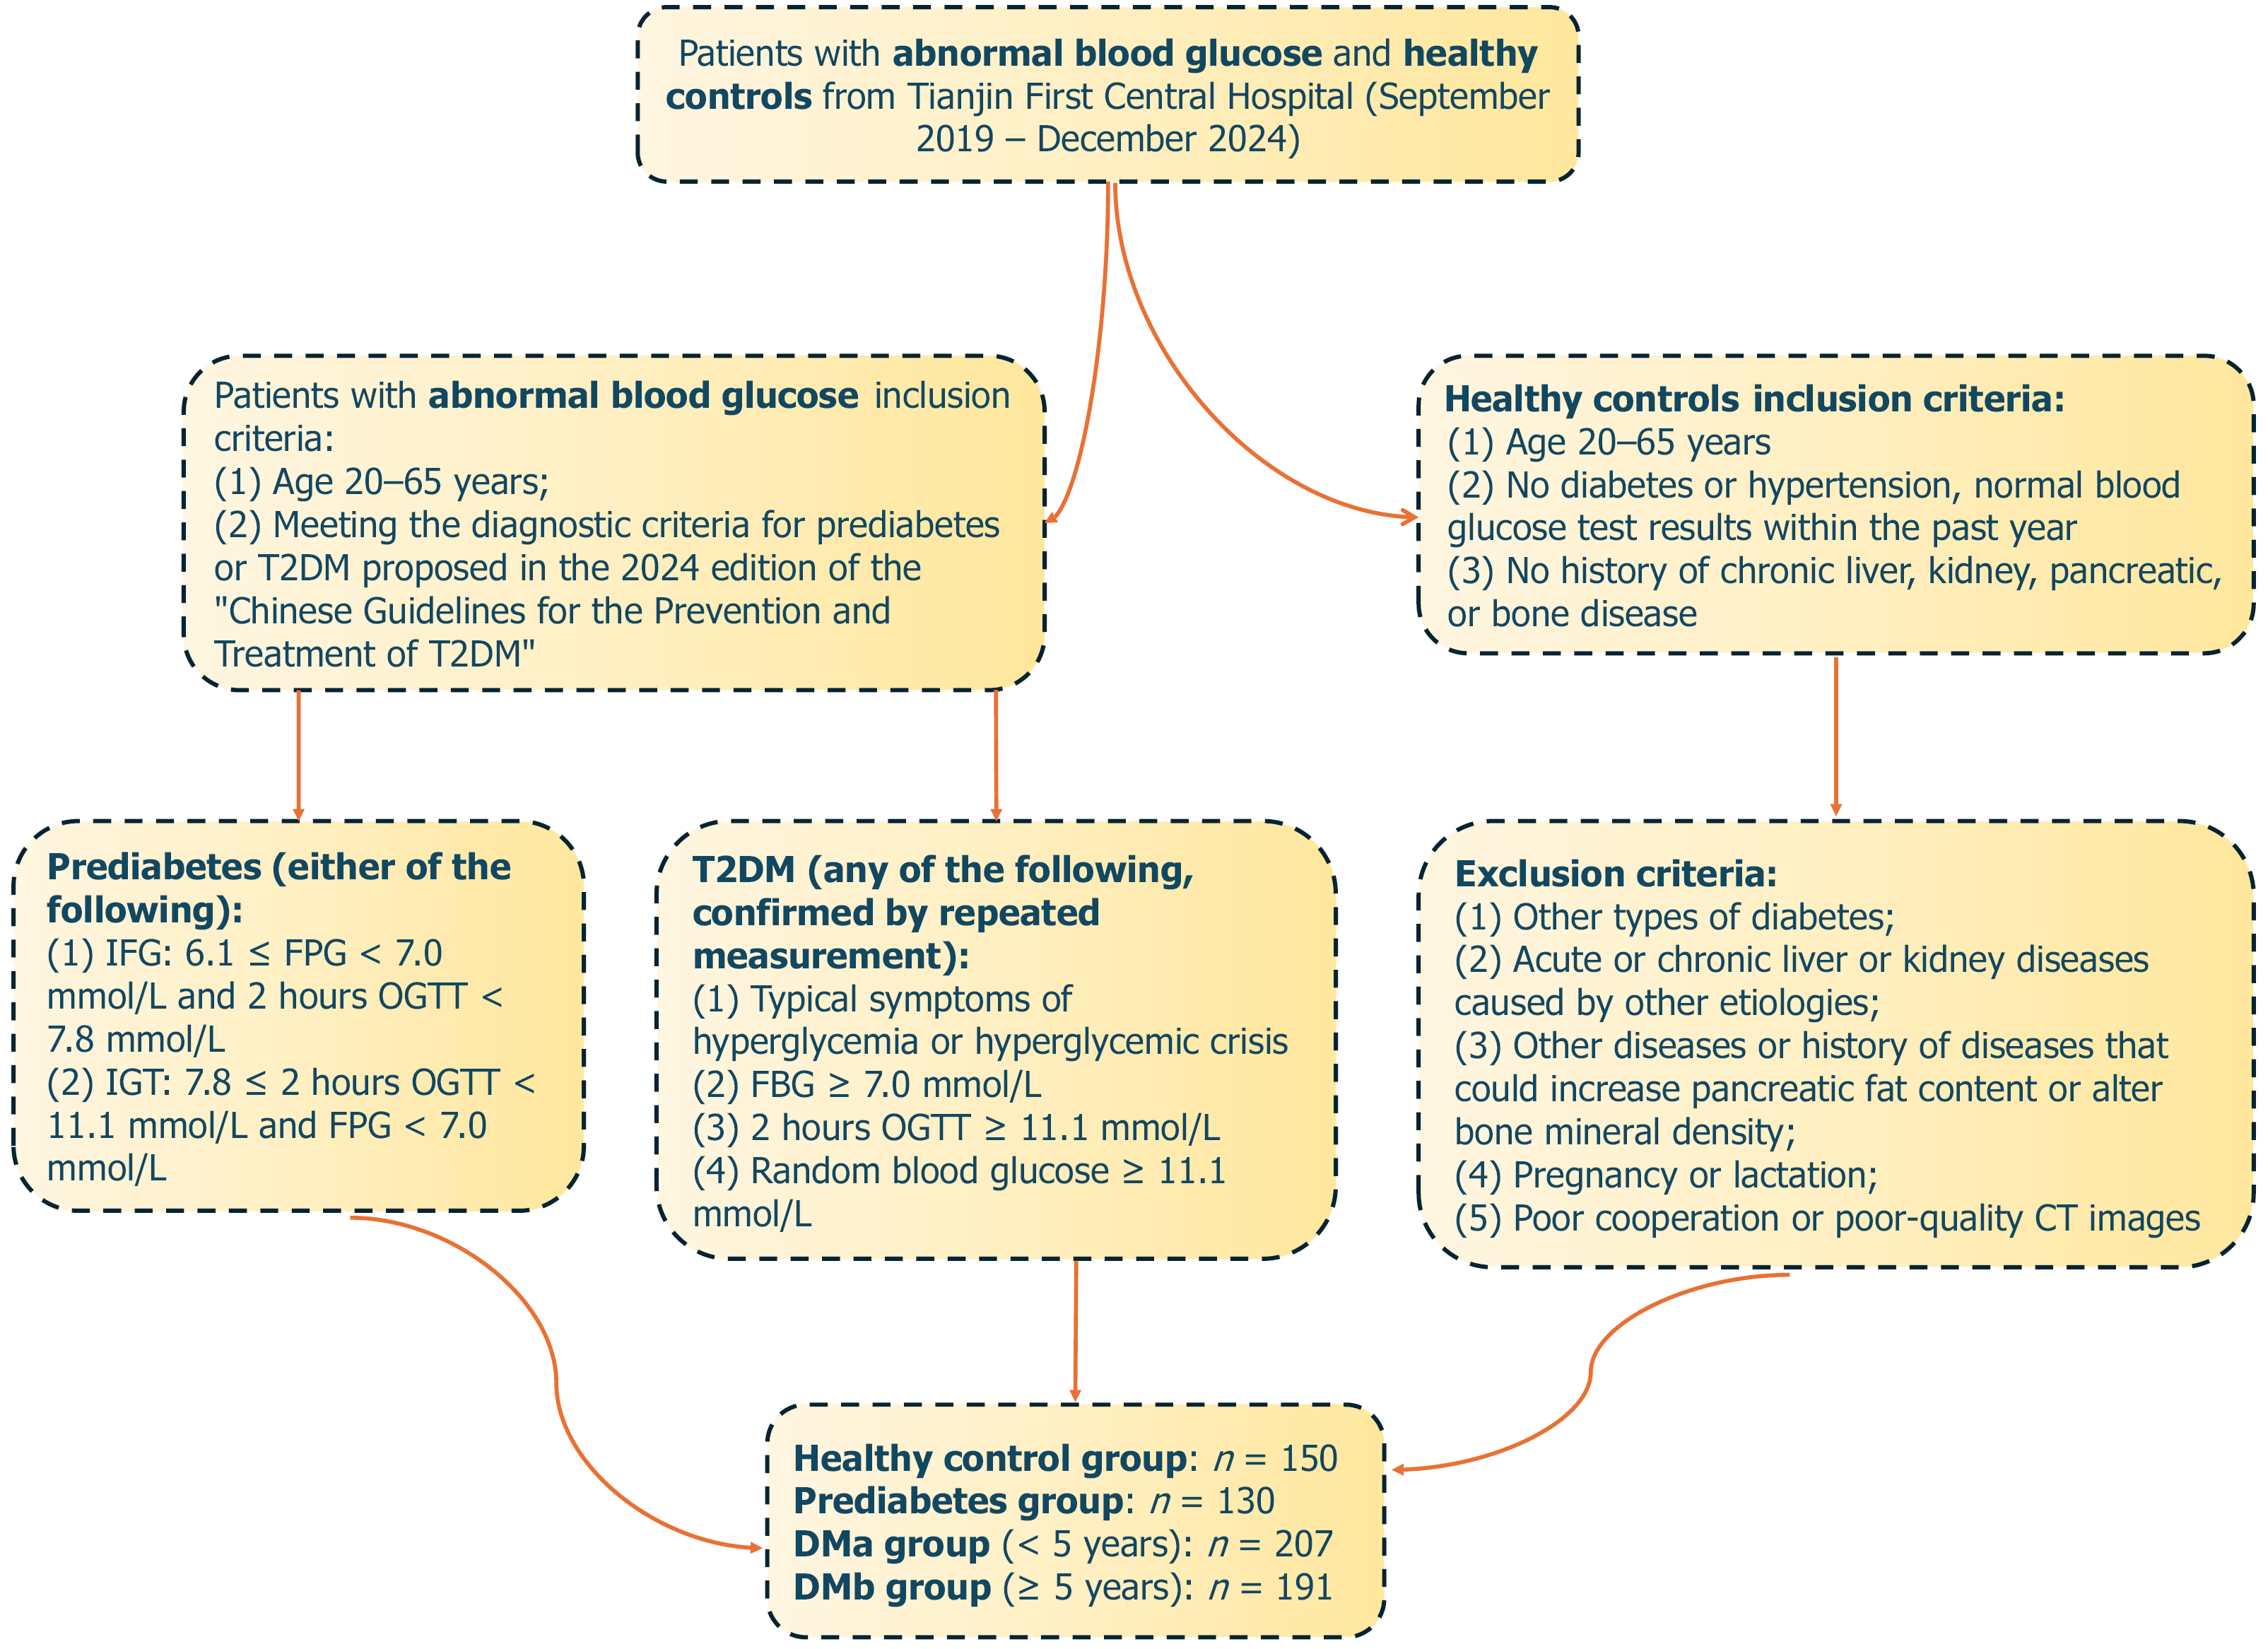
Figure 1 Flow chart for the inclusion of patients with prediabetes and type 2 diabetes mellitus.
T2DM: Type 2 diabetes mellitus; FPG: Fasting plasma glucose; IGT: Impaired glucose tolerance; OGTT: Oral glucose tolerance test; CT: Computed tomography; DMa: Type 2 diabetes mellitus with disease duration < 5 years; DMb: Type 2 diabetes mellitus with disease duration ≥ 5 years.
- Citation: Yang FZ, Li HY, Li G, Zhang YL, Ji Q. Cluster analysis of computed tomography identifies duration-associated abdominal fat deposition in type 2 diabetes mellitus. World J Diabetes 2026; 17(11): 124565
- URL: https://www.wjgnet.com/1948-9358/full/v17/i11/124565.htm
- DOI: https://dx.doi.org/10.4239/wjd.124565