










Copyright: ©Author(s) 2026.
World J Diabetes. Nov 15, 2026; 17(11): 124565
Published online Nov 15, 2026. doi: 10.4239/wjd.124565
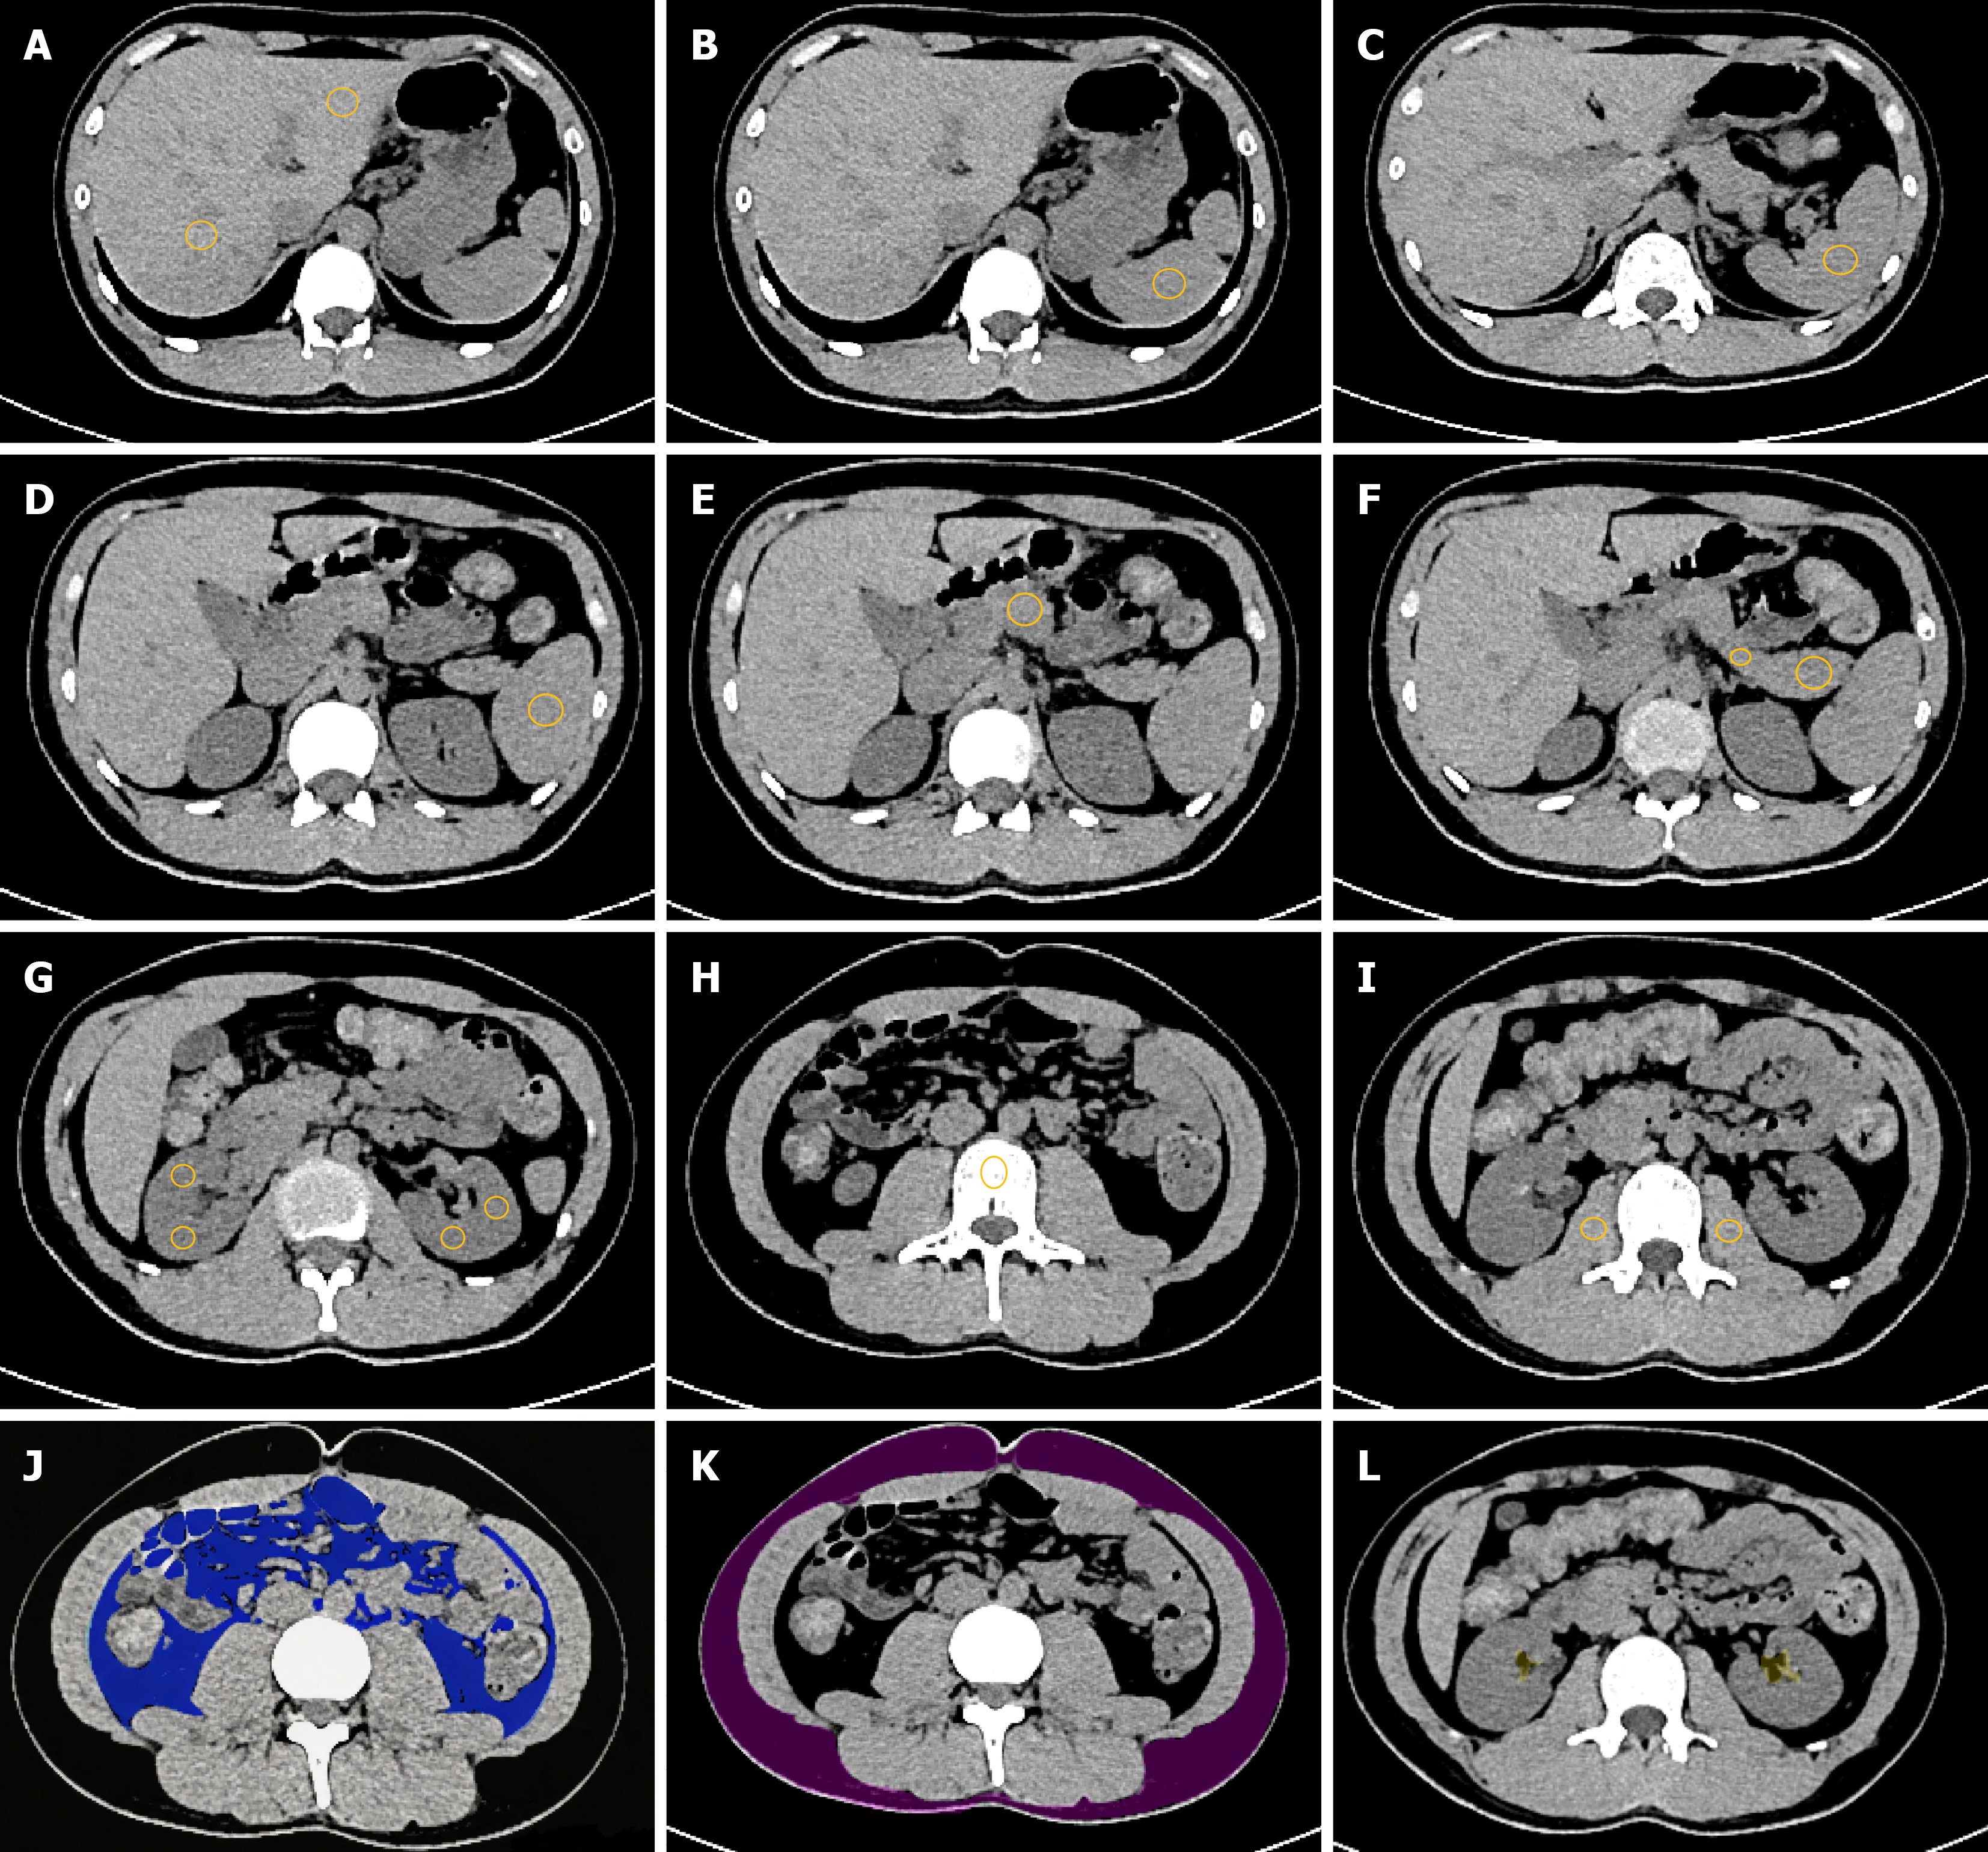
Figure 2 Schematic diagram of the placement and delineation of regions of interests for various abdominal organs, visceral, subcu taneous, and bilateral renal sinus.
A: Regions of interests (ROIs) of the left and right lobes of the liver; B-D: ROIs of the upper, middle, and lower poles of the spleen; E: ROIs of the head of the pancreas; F: ROIs of the body, and tail of the pancreas; G: ROIs of the bilateral renal parenchyma; H: ROI of the L3 lumbar vertebra; I: ROIs of the bilateral psoas major muscles; J: The blue area represents the delineation range of the visceral adipose tissue ROI; K: The purple area represents the delineation range of the subcutaneous adipose tissue ROI; L: The yellow area represents the delineation range of the bilateral renal sinus fat ROI. Yellow circle: Regions of interests placement location for the corresponding structures shown in each panel.
- Citation: Yang FZ, Li HY, Li G, Zhang YL, Ji Q. Cluster analysis of computed tomography identifies duration-associated abdominal fat deposition in type 2 diabetes mellitus. World J Diabetes 2026; 17(11): 124565
- URL: https://www.wjgnet.com/1948-9358/full/v17/i11/124565.htm
- DOI: https://dx.doi.org/10.4239/wjd.124565