Copyright
©The Author(s) 2025.
World J Diabetes. Jul 15, 2025; 16(7): 105219
Published online Jul 15, 2025. doi: 10.4239/wjd.v16.i7.105219
Published online Jul 15, 2025. doi: 10.4239/wjd.v16.i7.105219
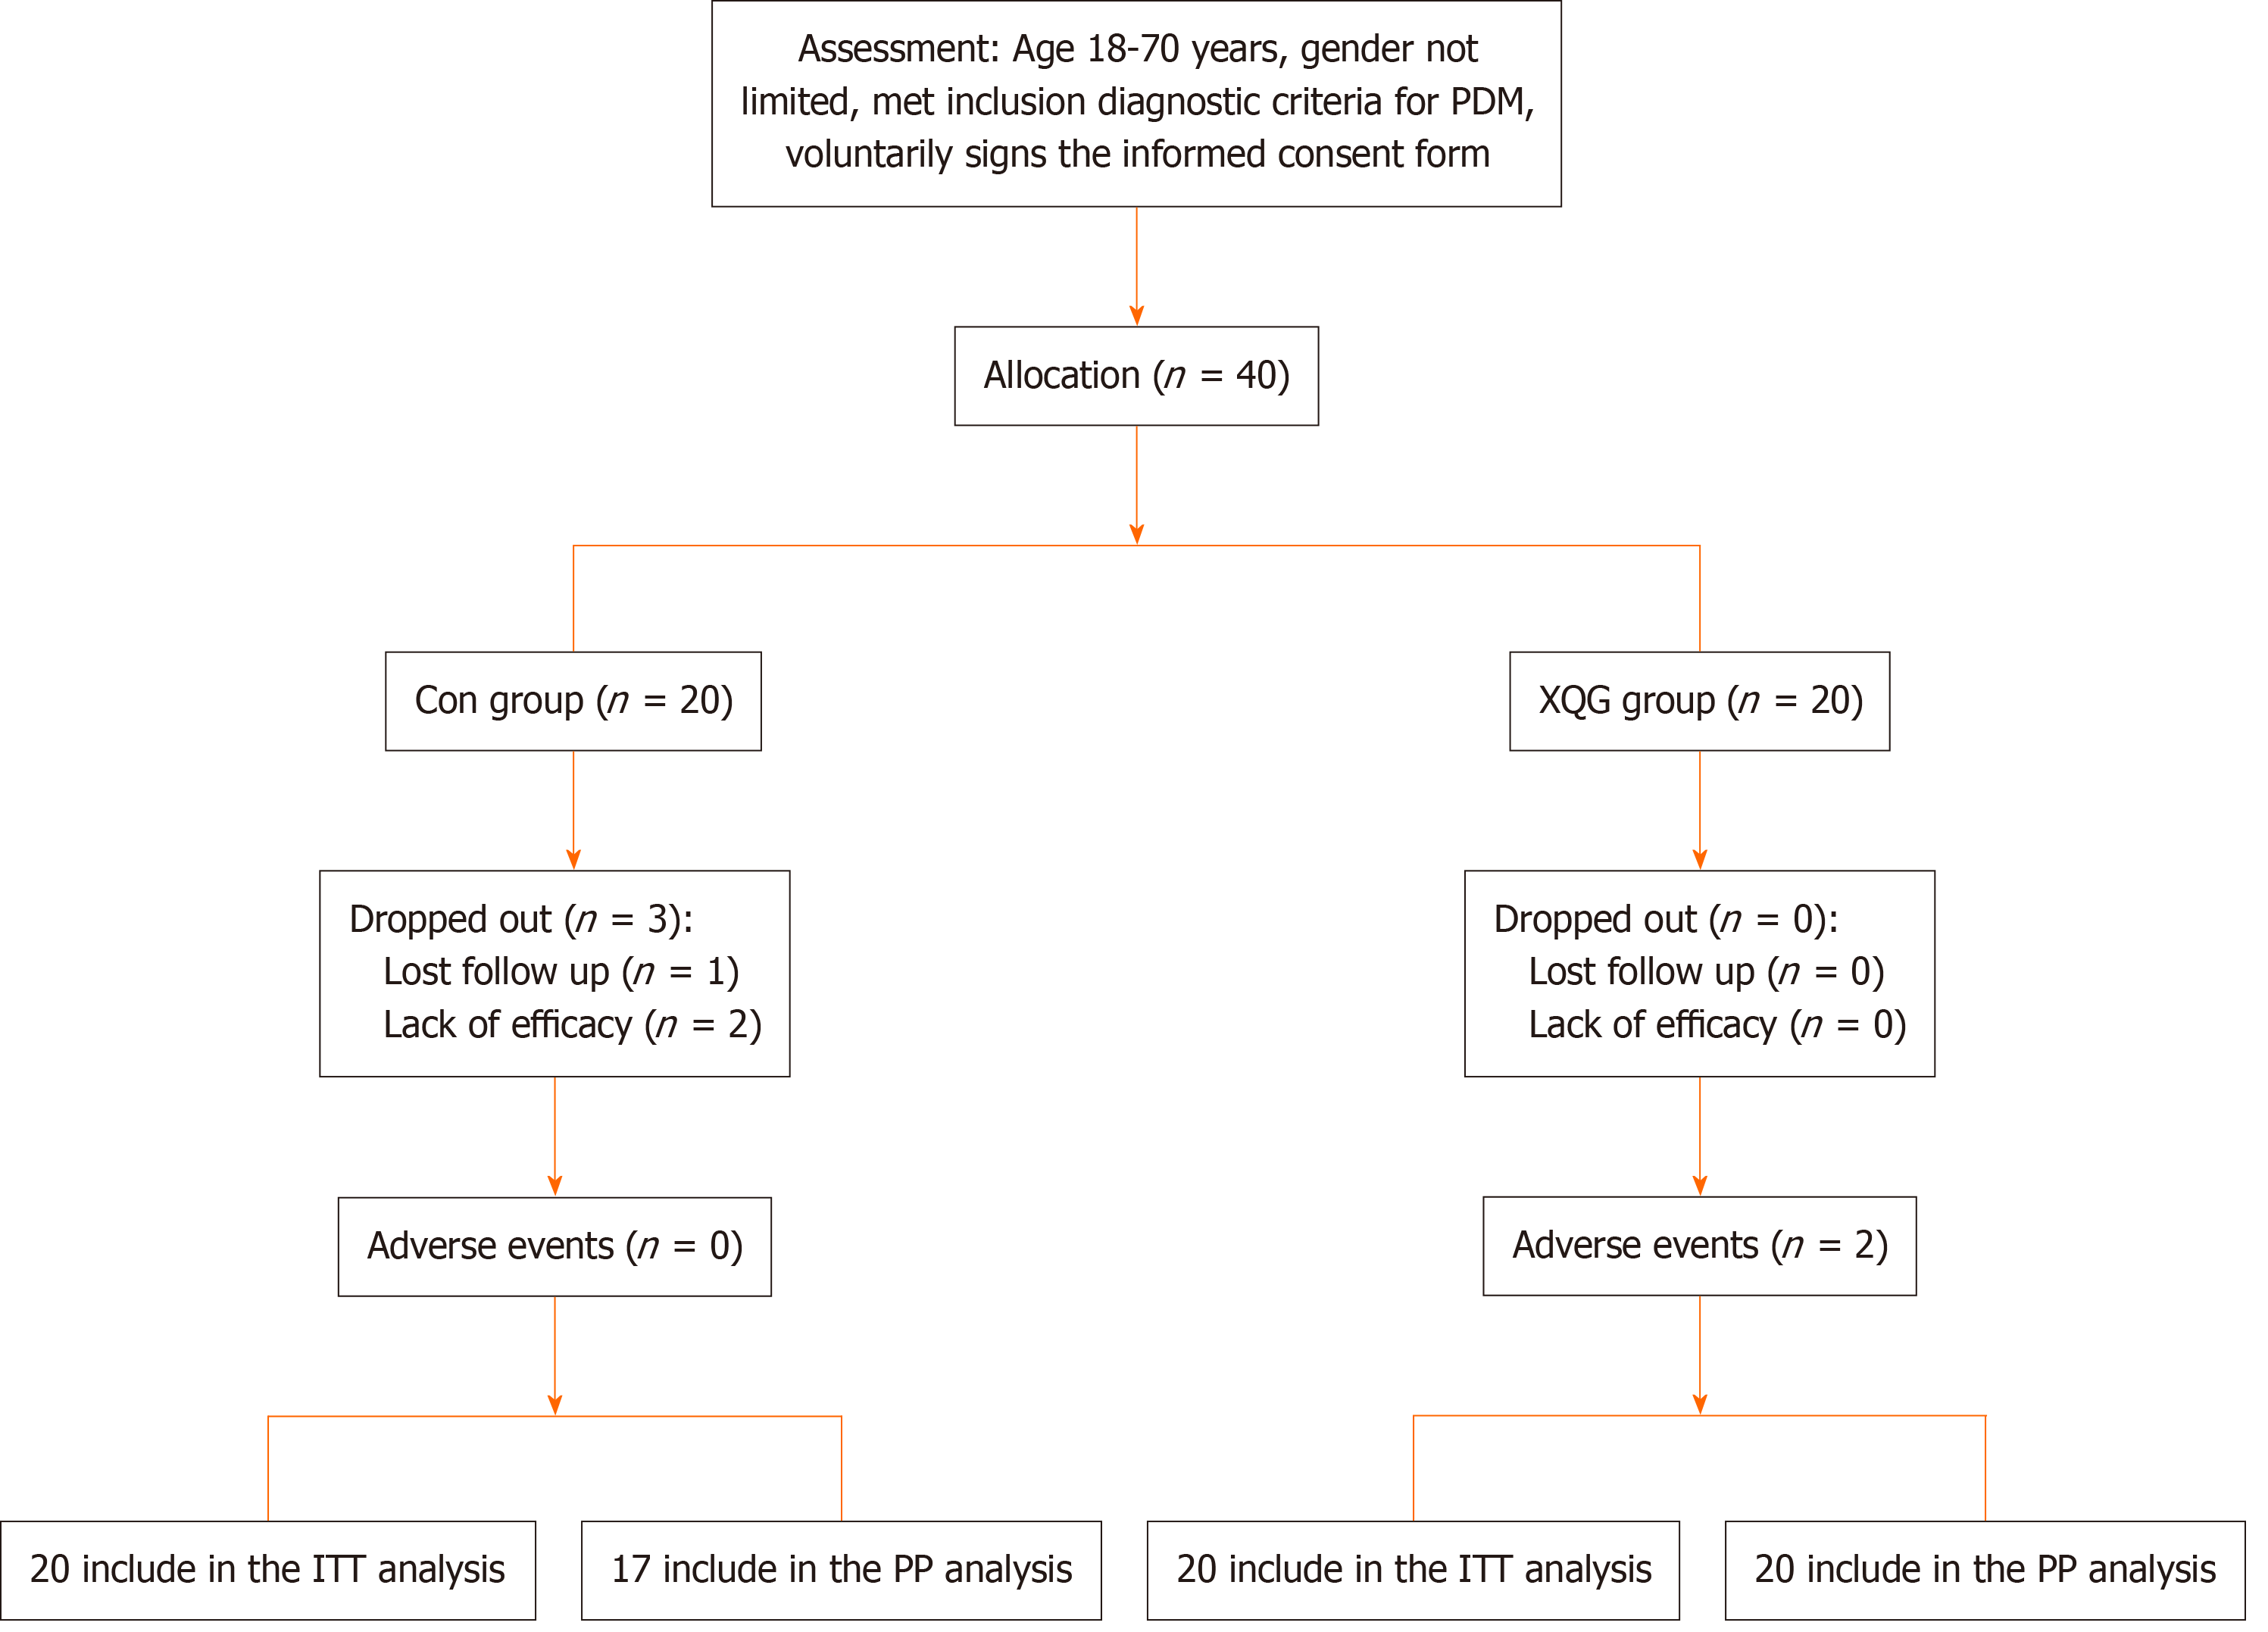
Figure 1 Consolidated standards of reporting trials participant flow chart.
PDM: Prediabetes mellitus; Con: Control; XQG: Xiaokeqing granule; ITT: Intention to treat; PP: Per-protocol.
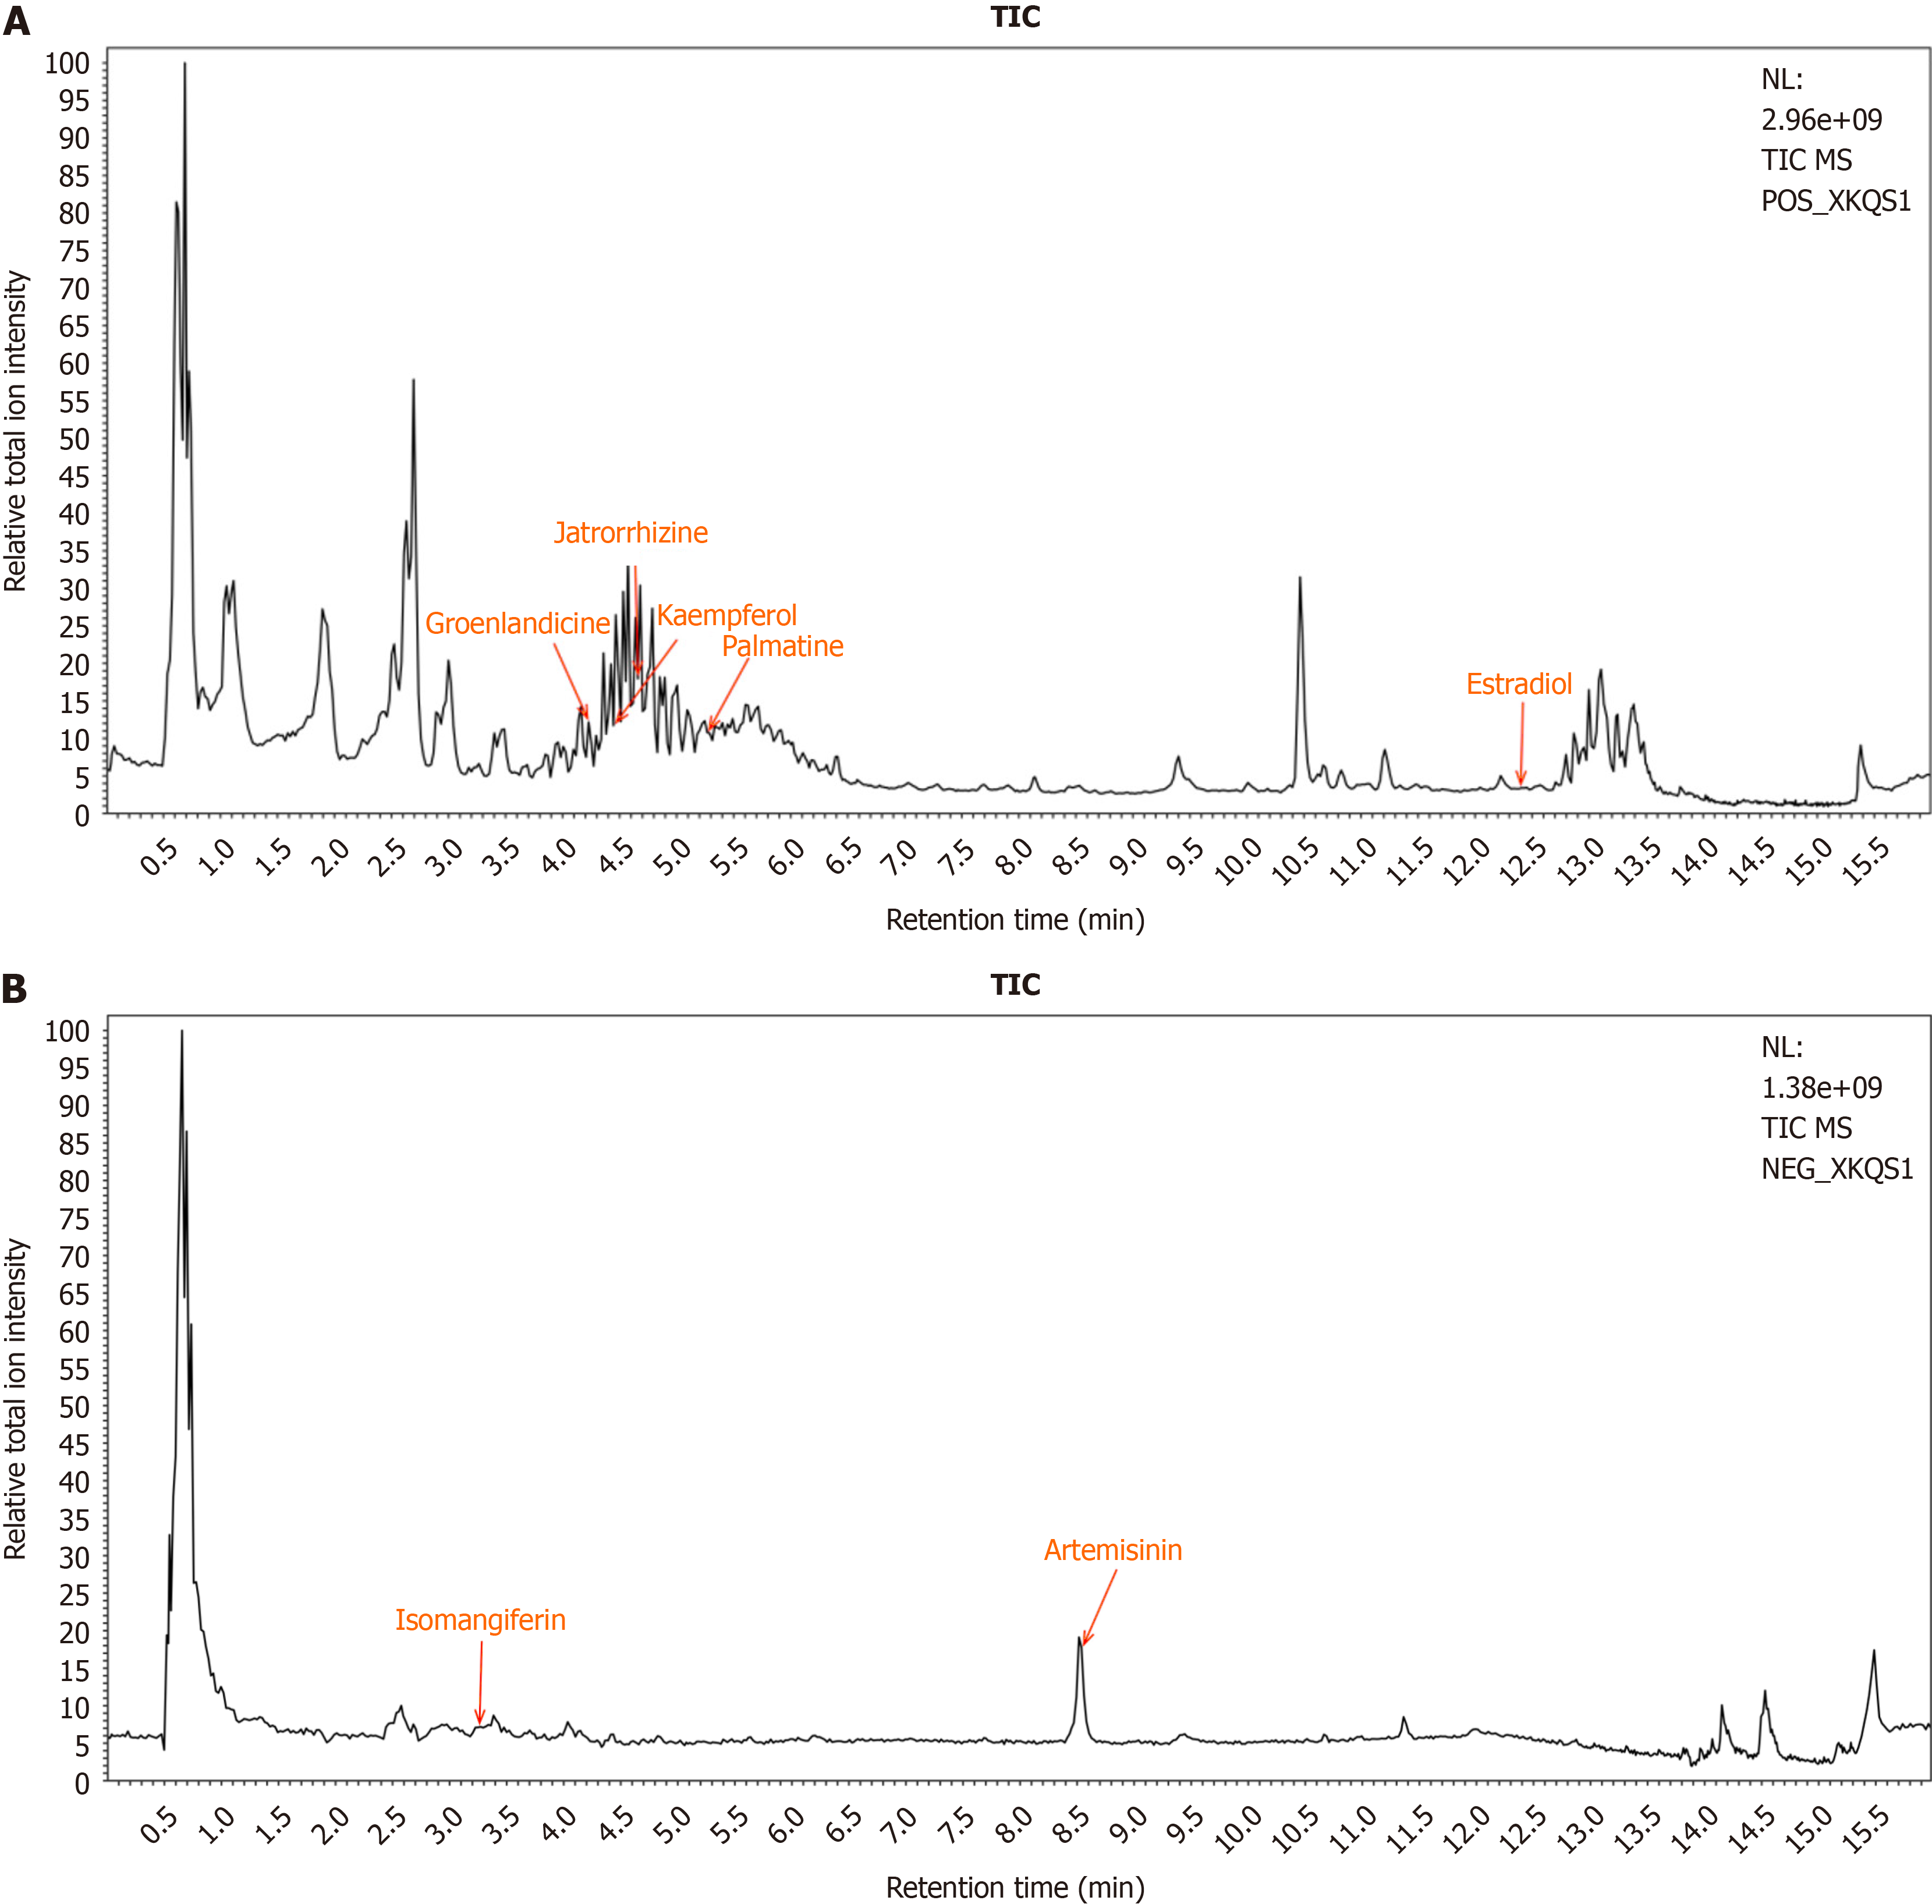
Figure 2 Identification of Xiaokeqing granule constituents absorbed in the blood.
A: Positive-ion chromatograms of the serum of the Xiaokeqing granule group; B: Negative ion chromatograms of the serum of the Xiaokeqing granule group. TIC: Total ion chromatogram.
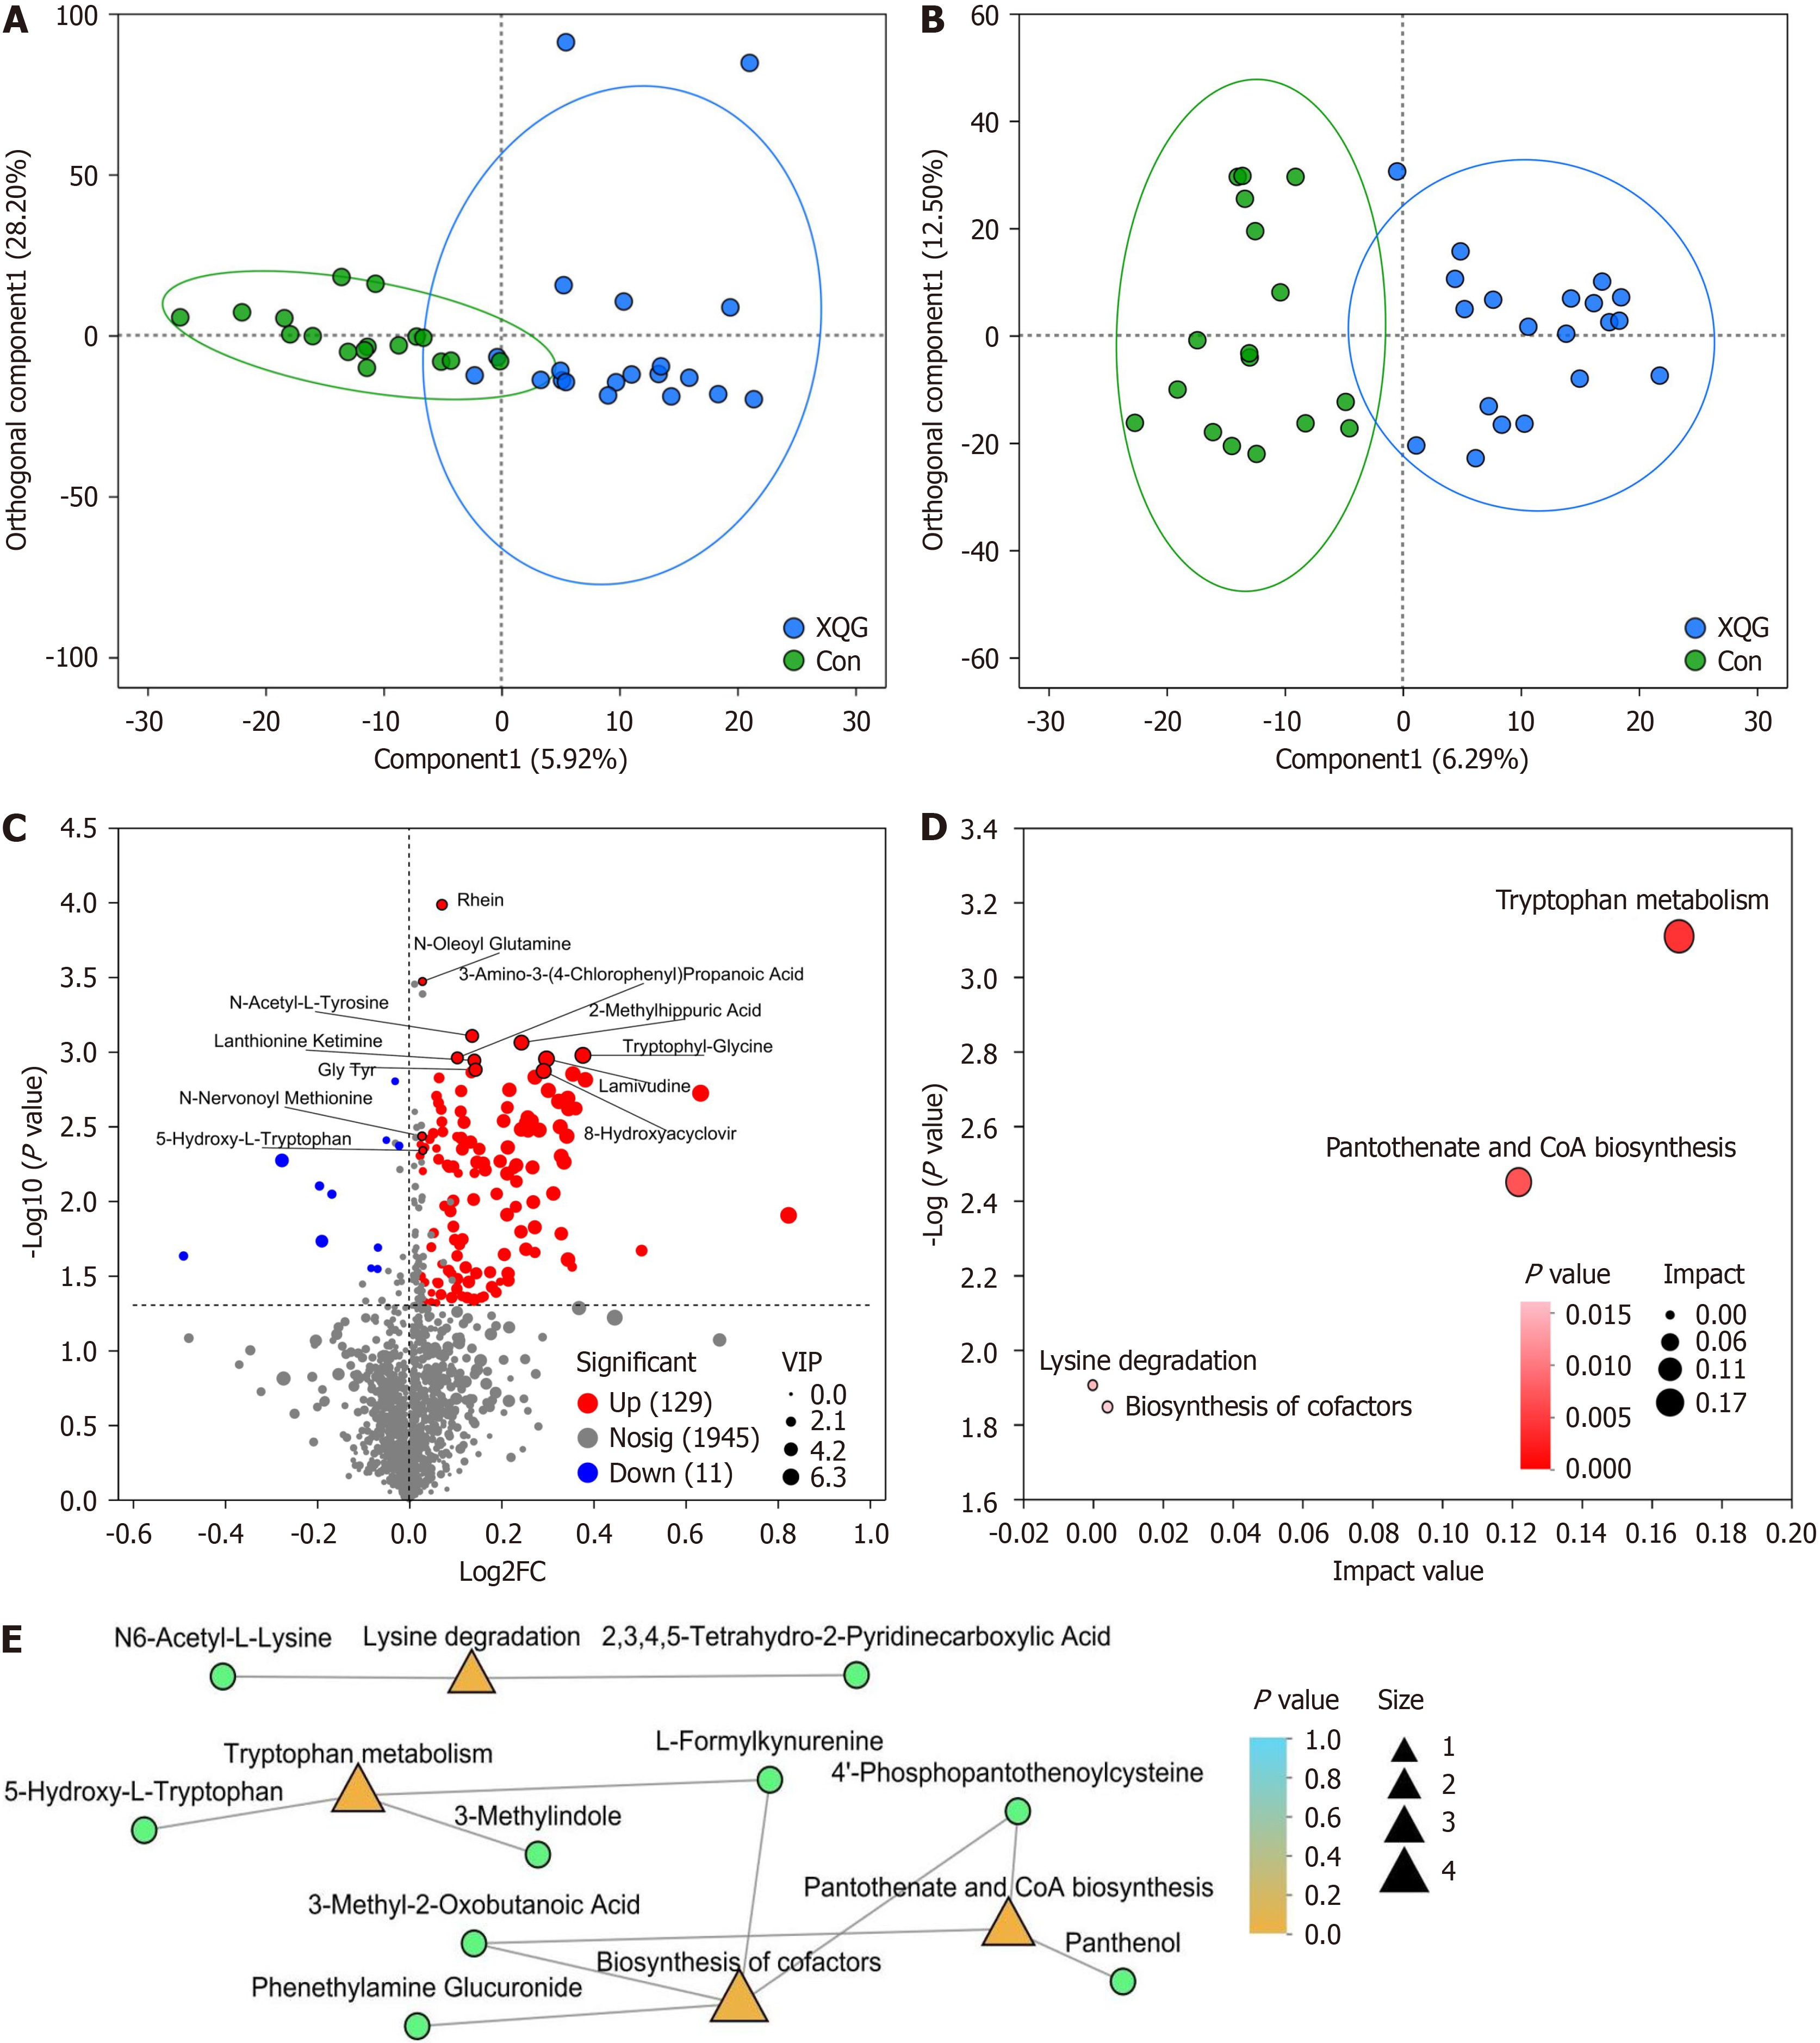
Figure 3 Comparisons of metabolites between the control group and Xiaokeqing granule group.
A: Comparison of the positive-ion metabolite profiles by orthogonal partial least squares discriminant analysis (OPLS-DA); B: Comparison of the negative ion metabolite profiles by OPLS-DA; C: Volcano plot of the significantly differentially abundant metabolites; D: Metabolic Kyoto Encyclopedia of Genes and Genomes (KEGG) pathway topology analysis; E: Metabolic KEGG pathway enrichment analysis network. Green circles represent differentially metabolites, orange and yellow triangles represent differentially KEGG pathways, and the size represents the number of metabolites in the pathways. Con: Control; XQG: Xiaokeqing granule; FC: Fold change; VIP: Variable importance in projection; CoA: Certificate of analysis.
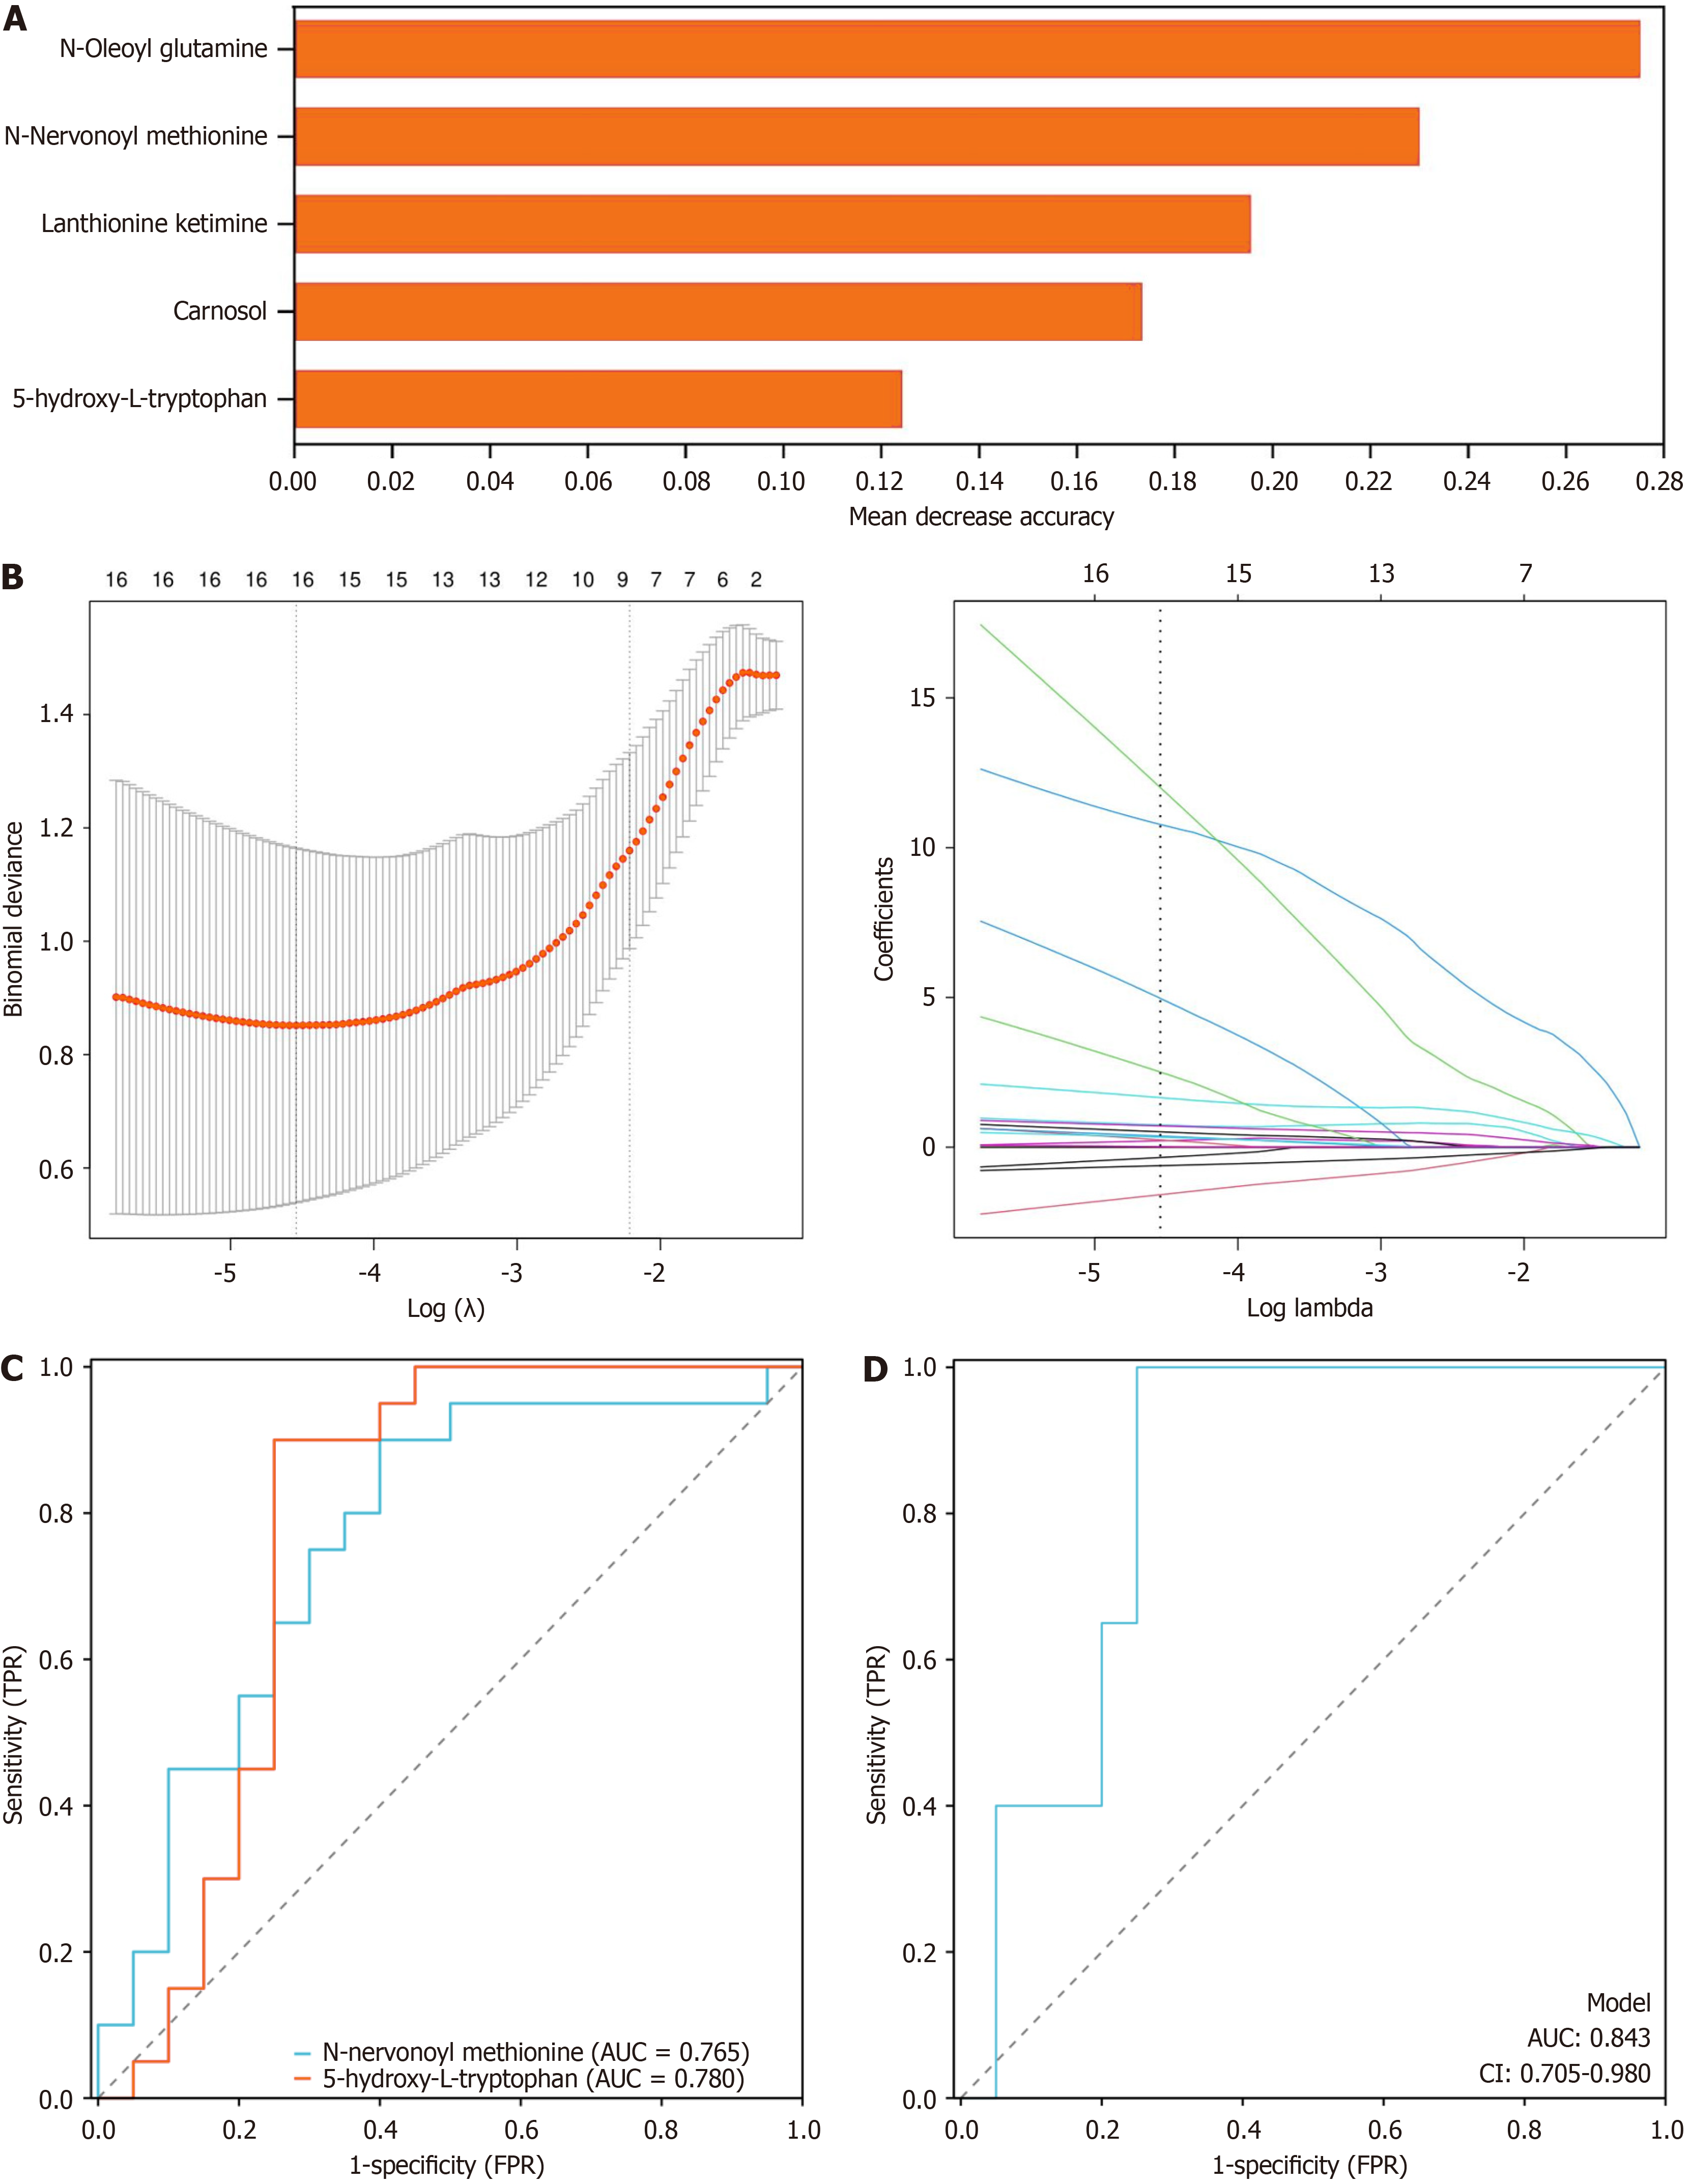
Figure 4 Comparisons of potential biomarkers between the control group and Xiaokeqing granule group.
A: Important biomarkers according to random forest analysis; B: Important biomarkers according to least absolute shrinkage and selection operator regression analysis; C: Receiver operating characteristic analysis of the two core metabolomics biomarkers; D: Receiver operating characteristic curve analysis of the joint core metabolomics biomarkers. TPR: True positive rate; FPR: False positive rate; AUC: Area under the curve; CI: Confidence interval.
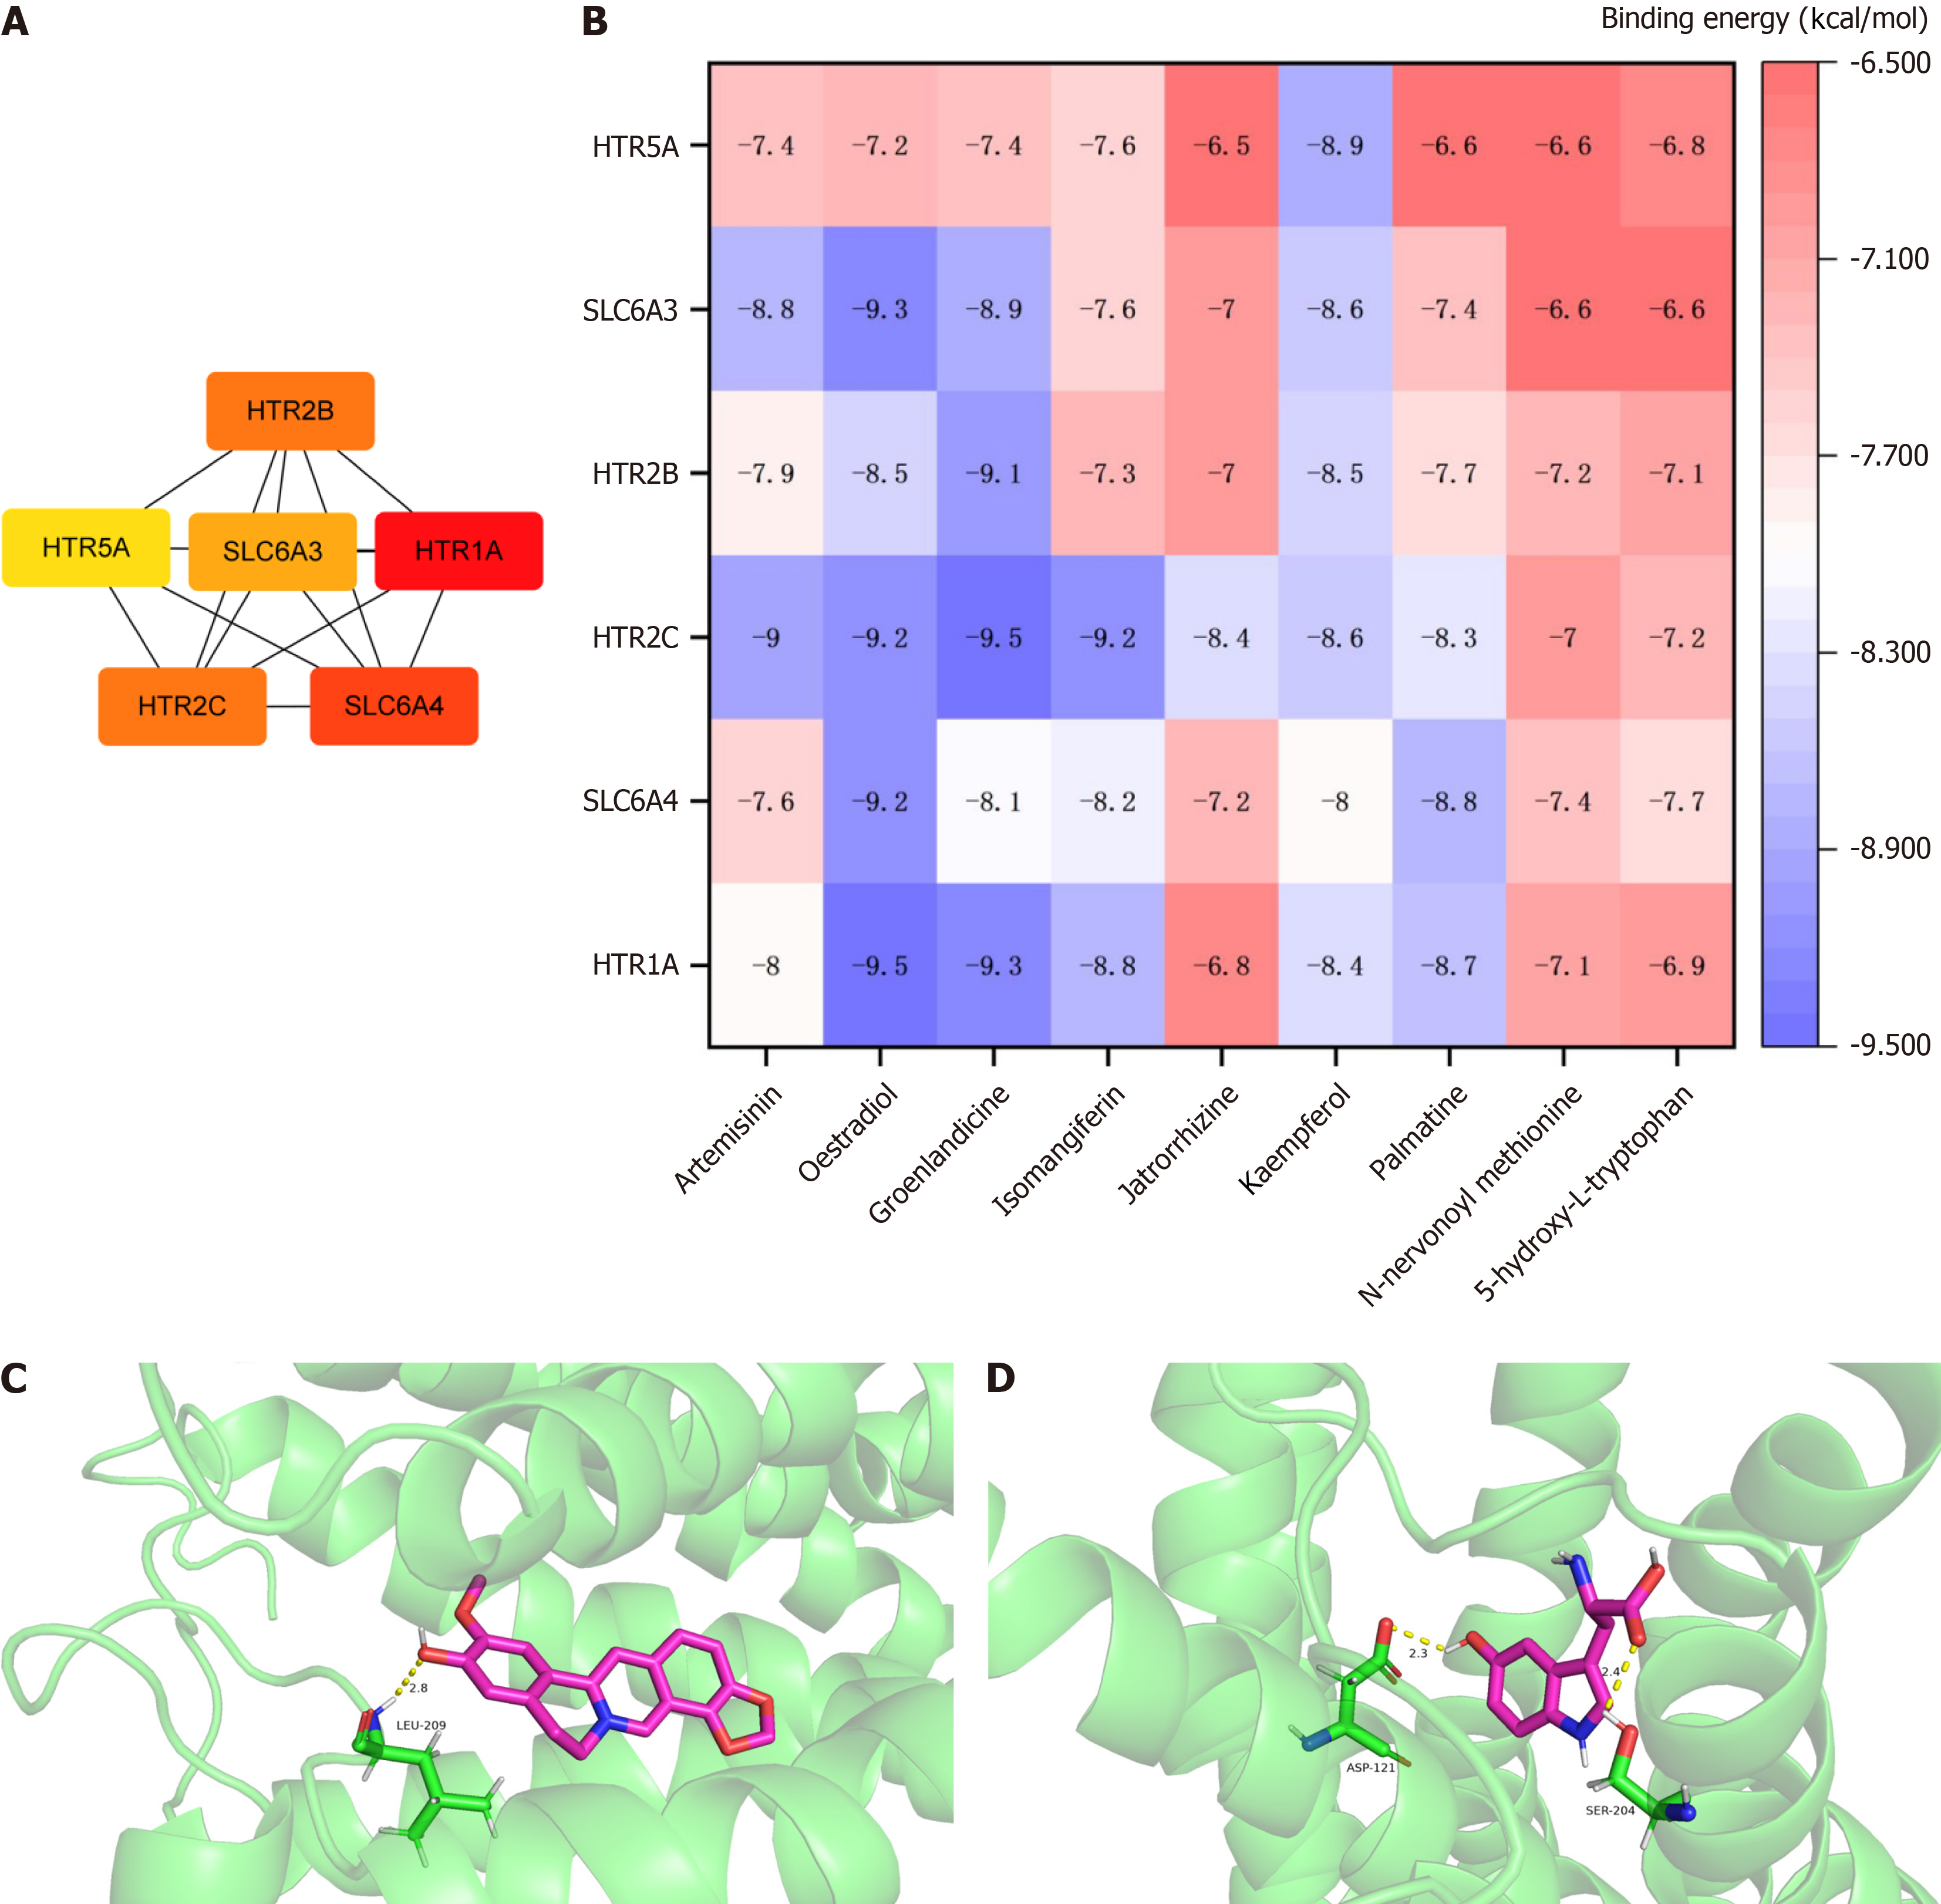
Figure 5 Network pharmacology and molecular docking.
A: Key targets; B: Molecules docking heatmap of Xiaokeqing granule constituents absorbed in the blood, core metabolomics biomarkers and key targets; C: Molecular docking visualization of groenlandicine and HTR2C; D: Molecular docking visualization of 5-hydroxy-L-tryptophan and SLC6A4.
- Citation: Zhao JD, Guo MZ, Zhang Y, Zhu SH, Wang YT, Zhang YP, Liu X, Cheng S, Wang F, Xu Q, Ruan NB, Fang ZH. Efficacy of Xiaokeqing granules and lifestyle intervention in treating prediabetes mellitus considering metabolomic biomarkers: A randomised controlled trial. World J Diabetes 2025; 16(7): 105219
- URL: https://www.wjgnet.com/1948-9358/full/v16/i7/105219.htm
- DOI: https://dx.doi.org/10.4239/wjd.v16.i7.105219


