Copyright
©The Author(s) 2025.
World J Diabetes. Jul 15, 2025; 16(7): 105219
Published online Jul 15, 2025. doi: 10.4239/wjd.v16.i7.105219
Published online Jul 15, 2025. doi: 10.4239/wjd.v16.i7.105219
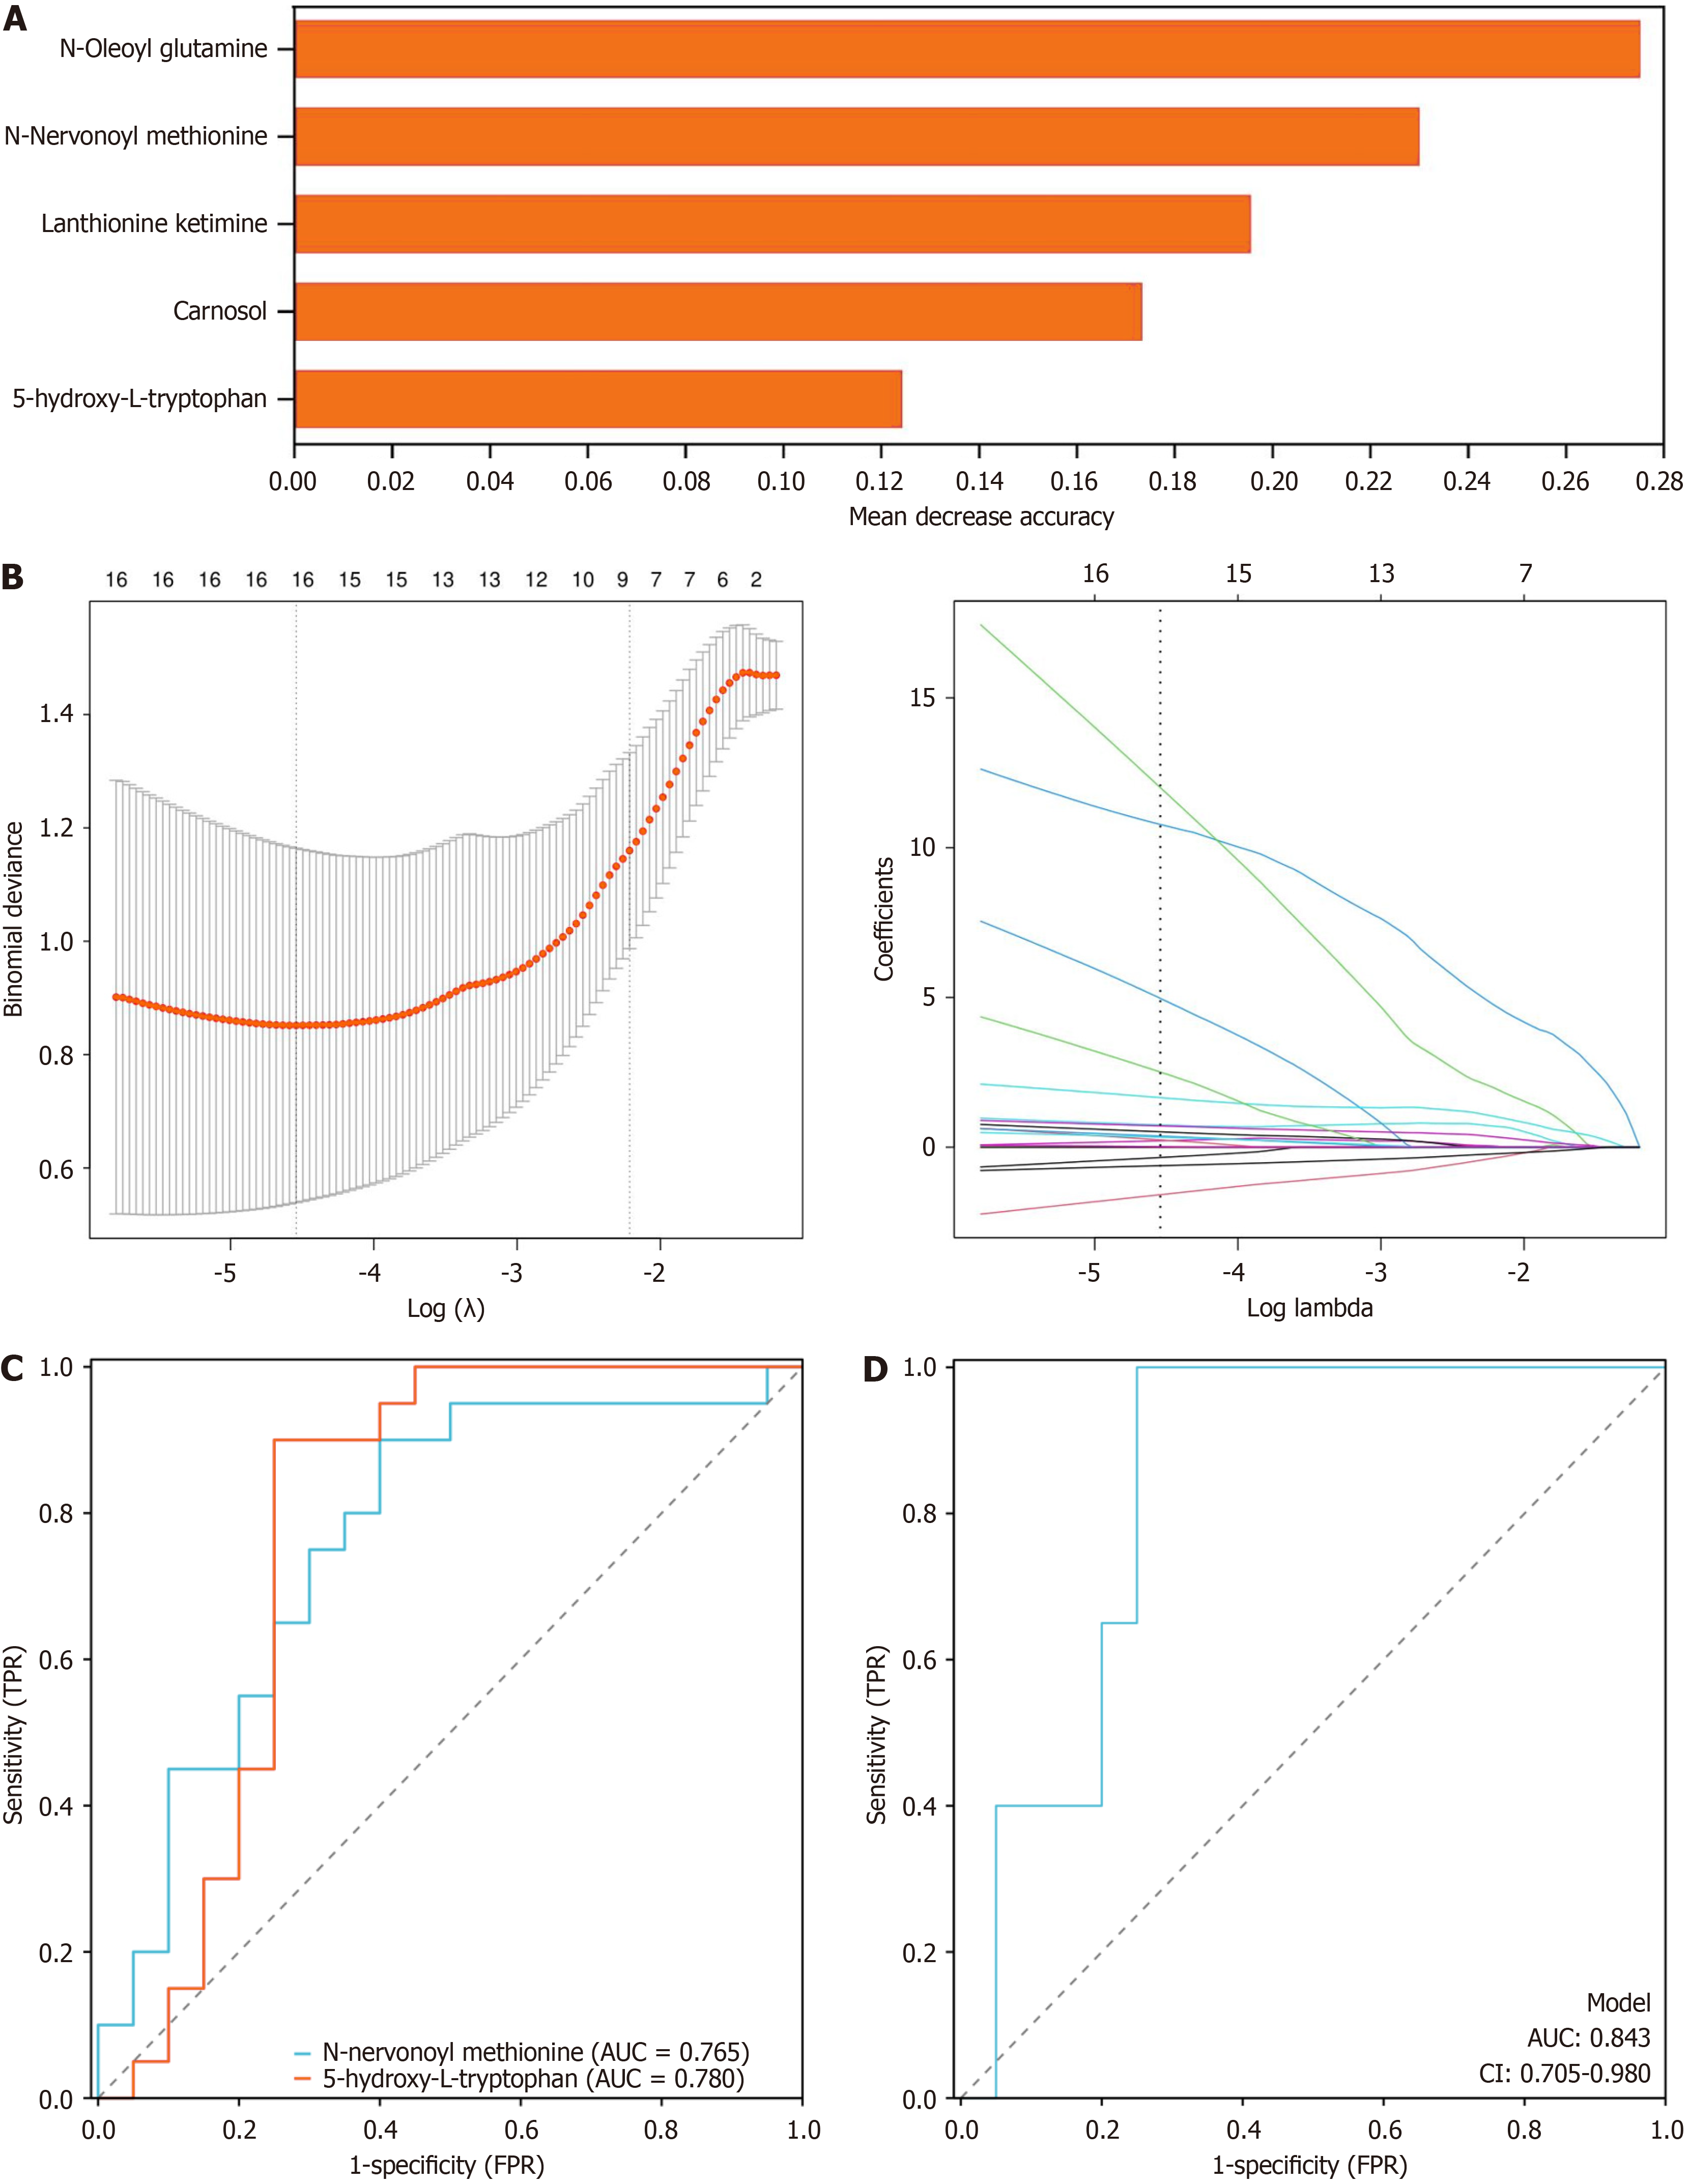
Figure 4 Comparisons of potential biomarkers between the control group and Xiaokeqing granule group.
A: Important biomarkers according to random forest analysis; B: Important biomarkers according to least absolute shrinkage and selection operator regression analysis; C: Receiver operating characteristic analysis of the two core metabolomics biomarkers; D: Receiver operating characteristic curve analysis of the joint core metabolomics biomarkers. TPR: True positive rate; FPR: False positive rate; AUC: Area under the curve; CI: Confidence interval.
- Citation: Zhao JD, Guo MZ, Zhang Y, Zhu SH, Wang YT, Zhang YP, Liu X, Cheng S, Wang F, Xu Q, Ruan NB, Fang ZH. Efficacy of Xiaokeqing granules and lifestyle intervention in treating prediabetes mellitus considering metabolomic biomarkers: A randomised controlled trial. World J Diabetes 2025; 16(7): 105219
- URL: https://www.wjgnet.com/1948-9358/full/v16/i7/105219.htm
- DOI: https://dx.doi.org/10.4239/wjd.v16.i7.105219


