Copyright
©The Author(s) 2025.
World J Diabetes. Jul 15, 2025; 16(7): 105219
Published online Jul 15, 2025. doi: 10.4239/wjd.v16.i7.105219
Published online Jul 15, 2025. doi: 10.4239/wjd.v16.i7.105219
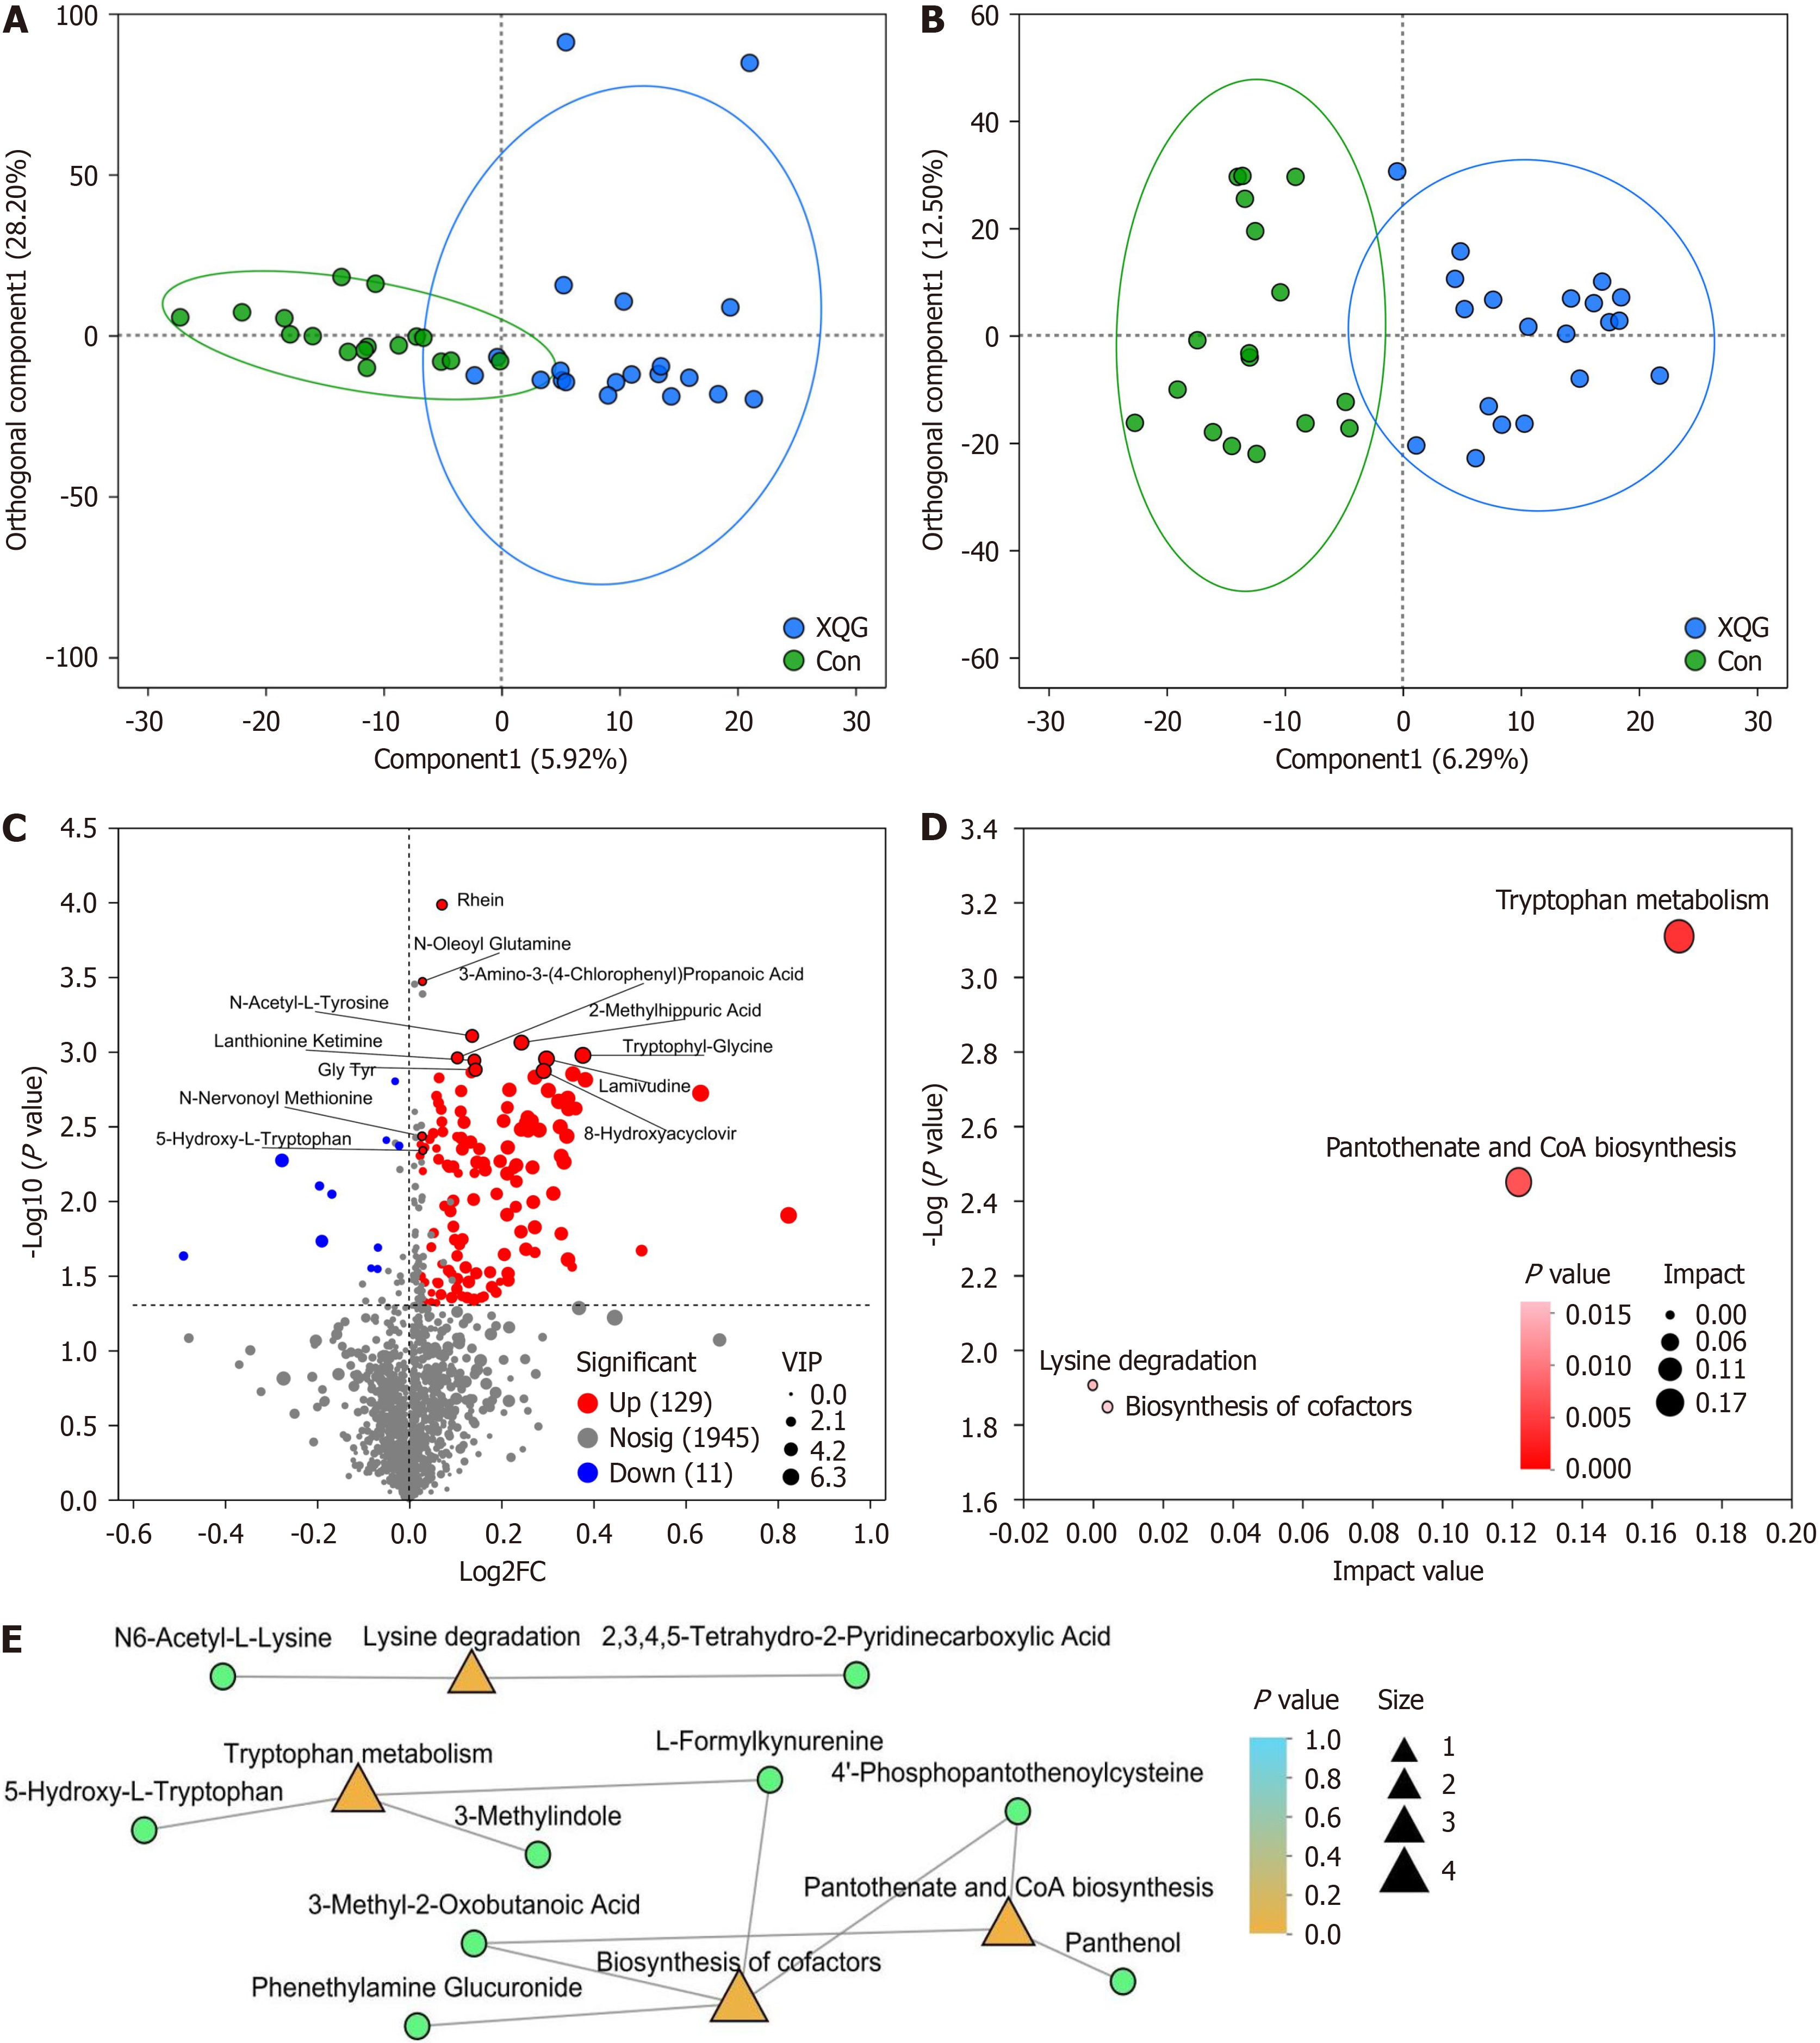
Figure 3 Comparisons of metabolites between the control group and Xiaokeqing granule group.
A: Comparison of the positive-ion metabolite profiles by orthogonal partial least squares discriminant analysis (OPLS-DA); B: Comparison of the negative ion metabolite profiles by OPLS-DA; C: Volcano plot of the significantly differentially abundant metabolites; D: Metabolic Kyoto Encyclopedia of Genes and Genomes (KEGG) pathway topology analysis; E: Metabolic KEGG pathway enrichment analysis network. Green circles represent differentially metabolites, orange and yellow triangles represent differentially KEGG pathways, and the size represents the number of metabolites in the pathways. Con: Control; XQG: Xiaokeqing granule; FC: Fold change; VIP: Variable importance in projection; CoA: Certificate of analysis.
- Citation: Zhao JD, Guo MZ, Zhang Y, Zhu SH, Wang YT, Zhang YP, Liu X, Cheng S, Wang F, Xu Q, Ruan NB, Fang ZH. Efficacy of Xiaokeqing granules and lifestyle intervention in treating prediabetes mellitus considering metabolomic biomarkers: A randomised controlled trial. World J Diabetes 2025; 16(7): 105219
- URL: https://www.wjgnet.com/1948-9358/full/v16/i7/105219.htm
- DOI: https://dx.doi.org/10.4239/wjd.v16.i7.105219


