Copyright
©The Author(s) 2022.
World J Diabetes. Oct 15, 2022; 13(10): 877-887
Published online Oct 15, 2022. doi: 10.4239/wjd.v13.i10.877
Published online Oct 15, 2022. doi: 10.4239/wjd.v13.i10.877
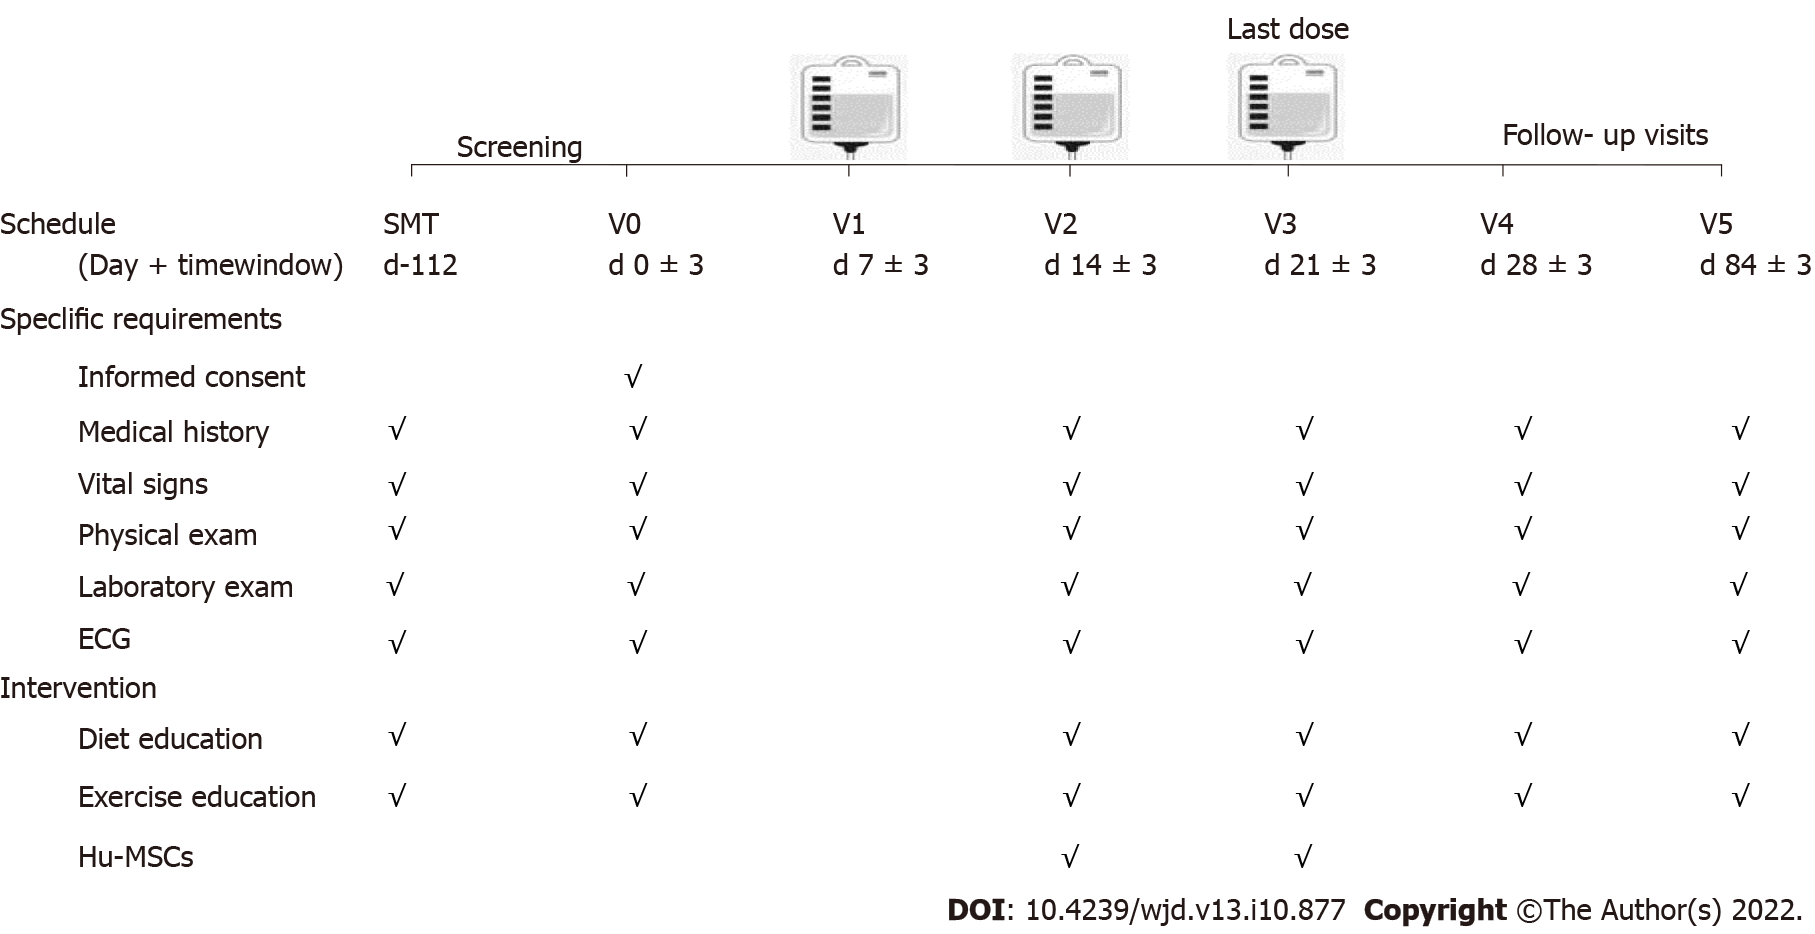
Figure 1 Flow chart for the study procedure.
The patients enrolled in the present study received three infusions on days 7 ± 3, 14 ± 3, and 21 ± 3. There were three visits, on days 0 ± 3, 28 ± 3, and 84 ± 3. ECG: Electrocardiogram; hUC-MSCs: Human umbilical cord blood-mesenchymal stem cells.
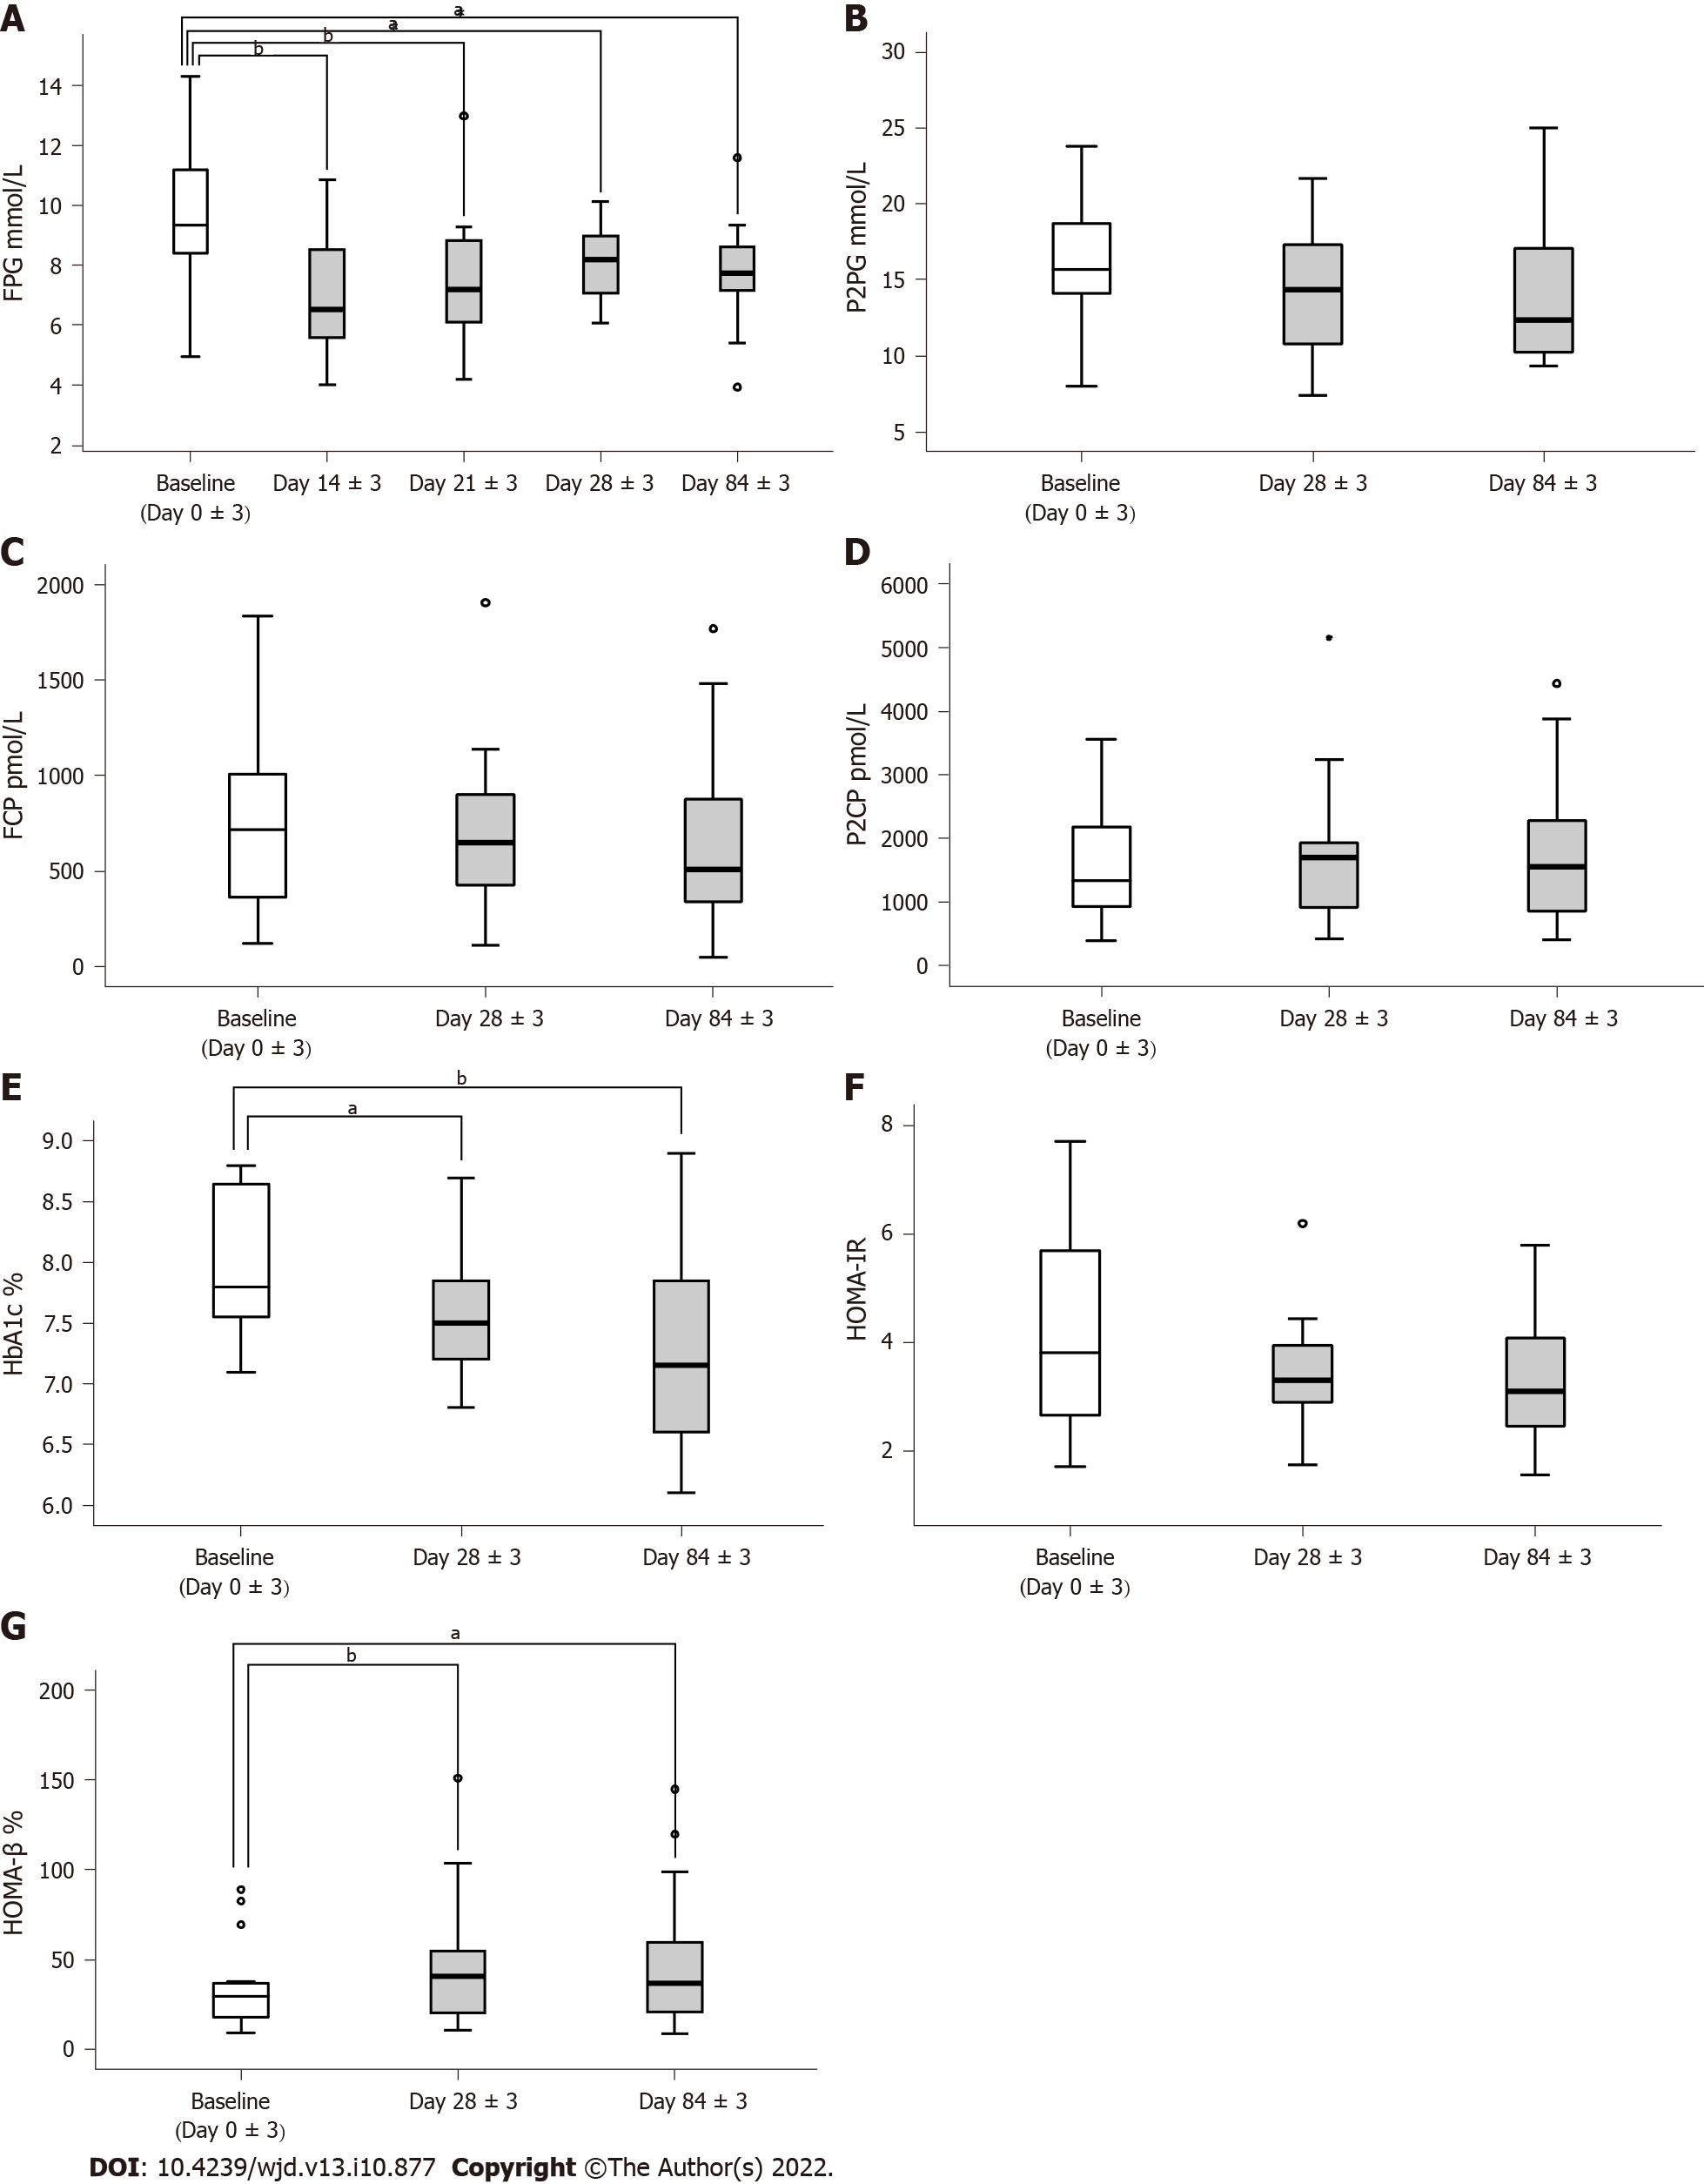
Figure 2 Assessment of the effectiveness of human umbilical cord blood-mesenchymal stem cell treatment.
A: Fasting plasma glucose tested on day 0 ± 3, day 14 ± 3, day 21 ± 3, day 28 ± 3, and day 84 ± 3; B-D: 2-h postprandial blood glucose, fasting C-peptide, and 2-h postprandial C-peptide tested on day 0 ± 3, day 28 ± 3, and day 84 ± 3; E: Glycosylated hemoglobin A1c levels tested on day 0 ± 3, day 28 ± 3, and day 84 ± 3; F and G: Homeostasis model assessment of insulin resistance and homeostasis model assessment of β-cell function calculated on day 0 ± 3, day 28 ± 3, and day 84 ± 3. aP < 0.05, bP < 0.01. FPG: Fasting plasma glucose; P2BG: 2-h postprandial blood glucose; FCP: Fasting C-peptide; P2CP: 2-h postprandial C-peptide; HbA1c: Glycosylated hemoglobin A1c; HOMA-IR: Homeostasis model assessment of insulin resistance; HOMA-β: Homeostasis model assessment of β-cell function.
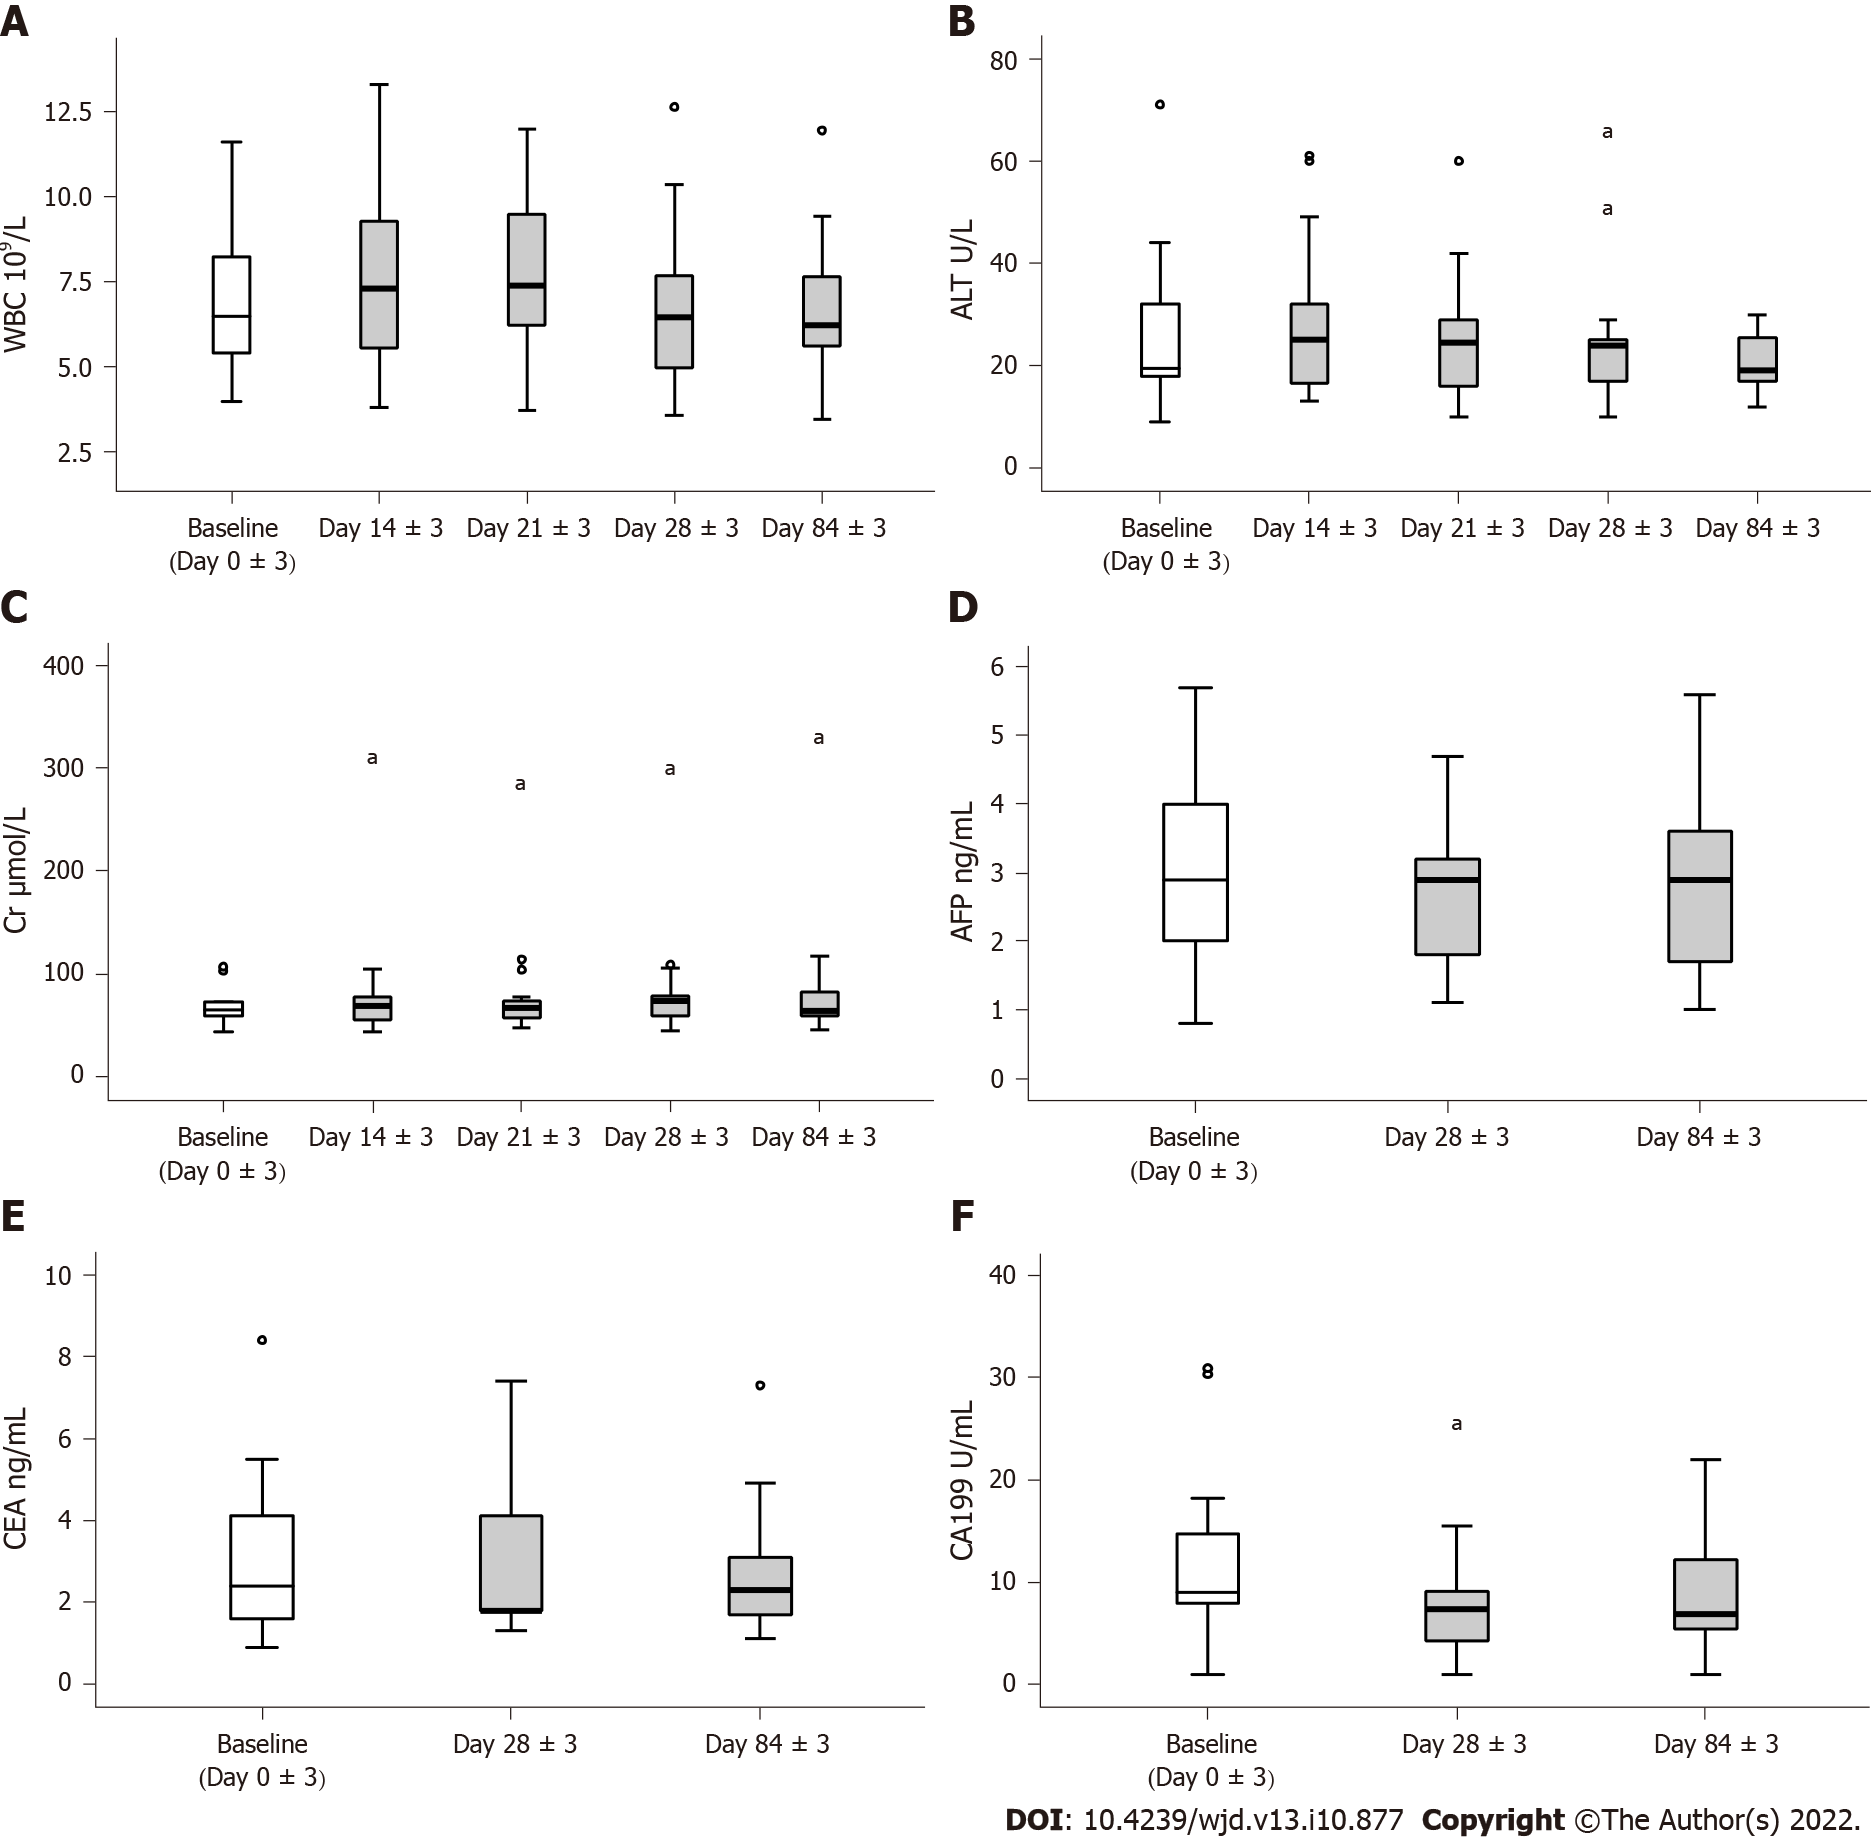
Figure 3 Assessment of the safety of human umbilical cord blood-mesenchymal stem cell treatment.
A-C: Leukocytes, hepatic and renal function; D-F: Antigen associated with tumor. aP < 0.05.
- Citation: Lian XF, Lu DH, Liu HL, Liu YJ, Han XQ, Yang Y, Lin Y, Zeng QX, Huang ZJ, Xie F, Huang CH, Wu HM, Long AM, Deng LP, Zhang F. Effectiveness and safety of human umbilical cord-mesenchymal stem cells for treating type 2 diabetes mellitus. World J Diabetes 2022; 13(10): 877-887
- URL: https://www.wjgnet.com/1948-9358/full/v13/i10/877.htm
- DOI: https://dx.doi.org/10.4239/wjd.v13.i10.877


