Copyright
©The Author(s) 2019.
World J Diabetes. Feb 15, 2019; 10(2): 96-113
Published online Feb 15, 2019. doi: 10.4239/wjd.v10.i2.96
Published online Feb 15, 2019. doi: 10.4239/wjd.v10.i2.96
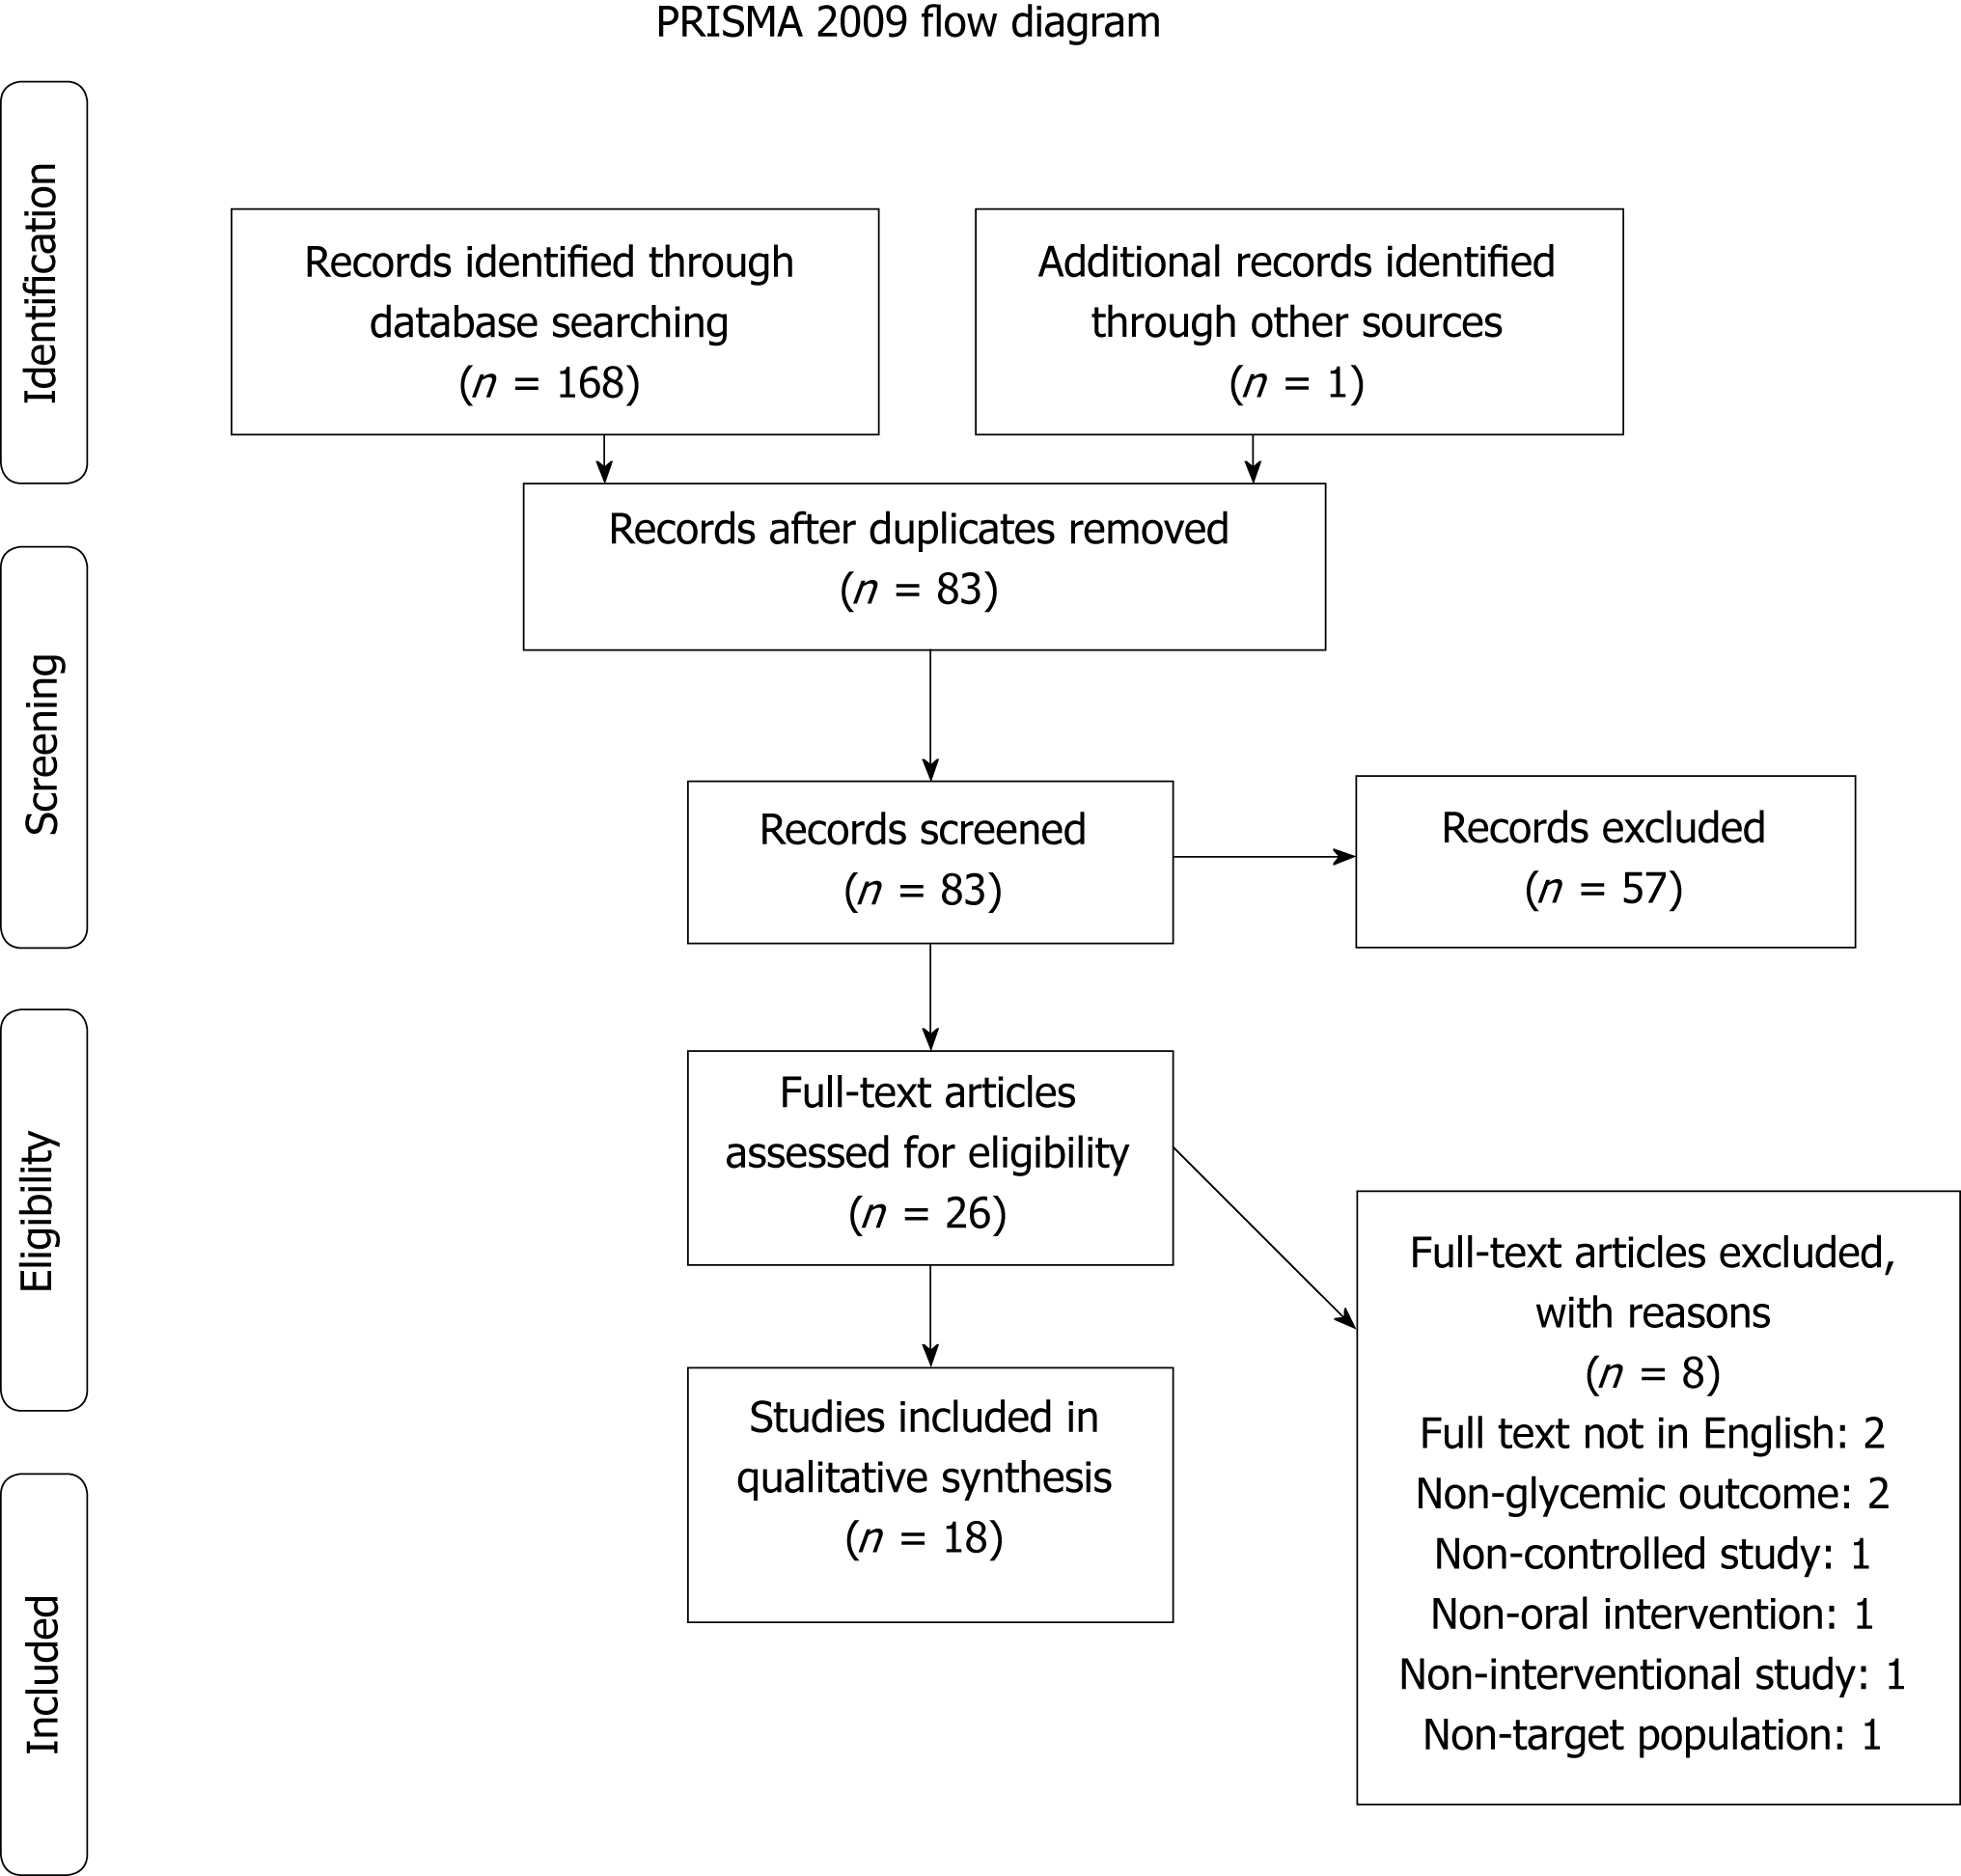
Figure 1 Flow diagram summarizing study selection process.
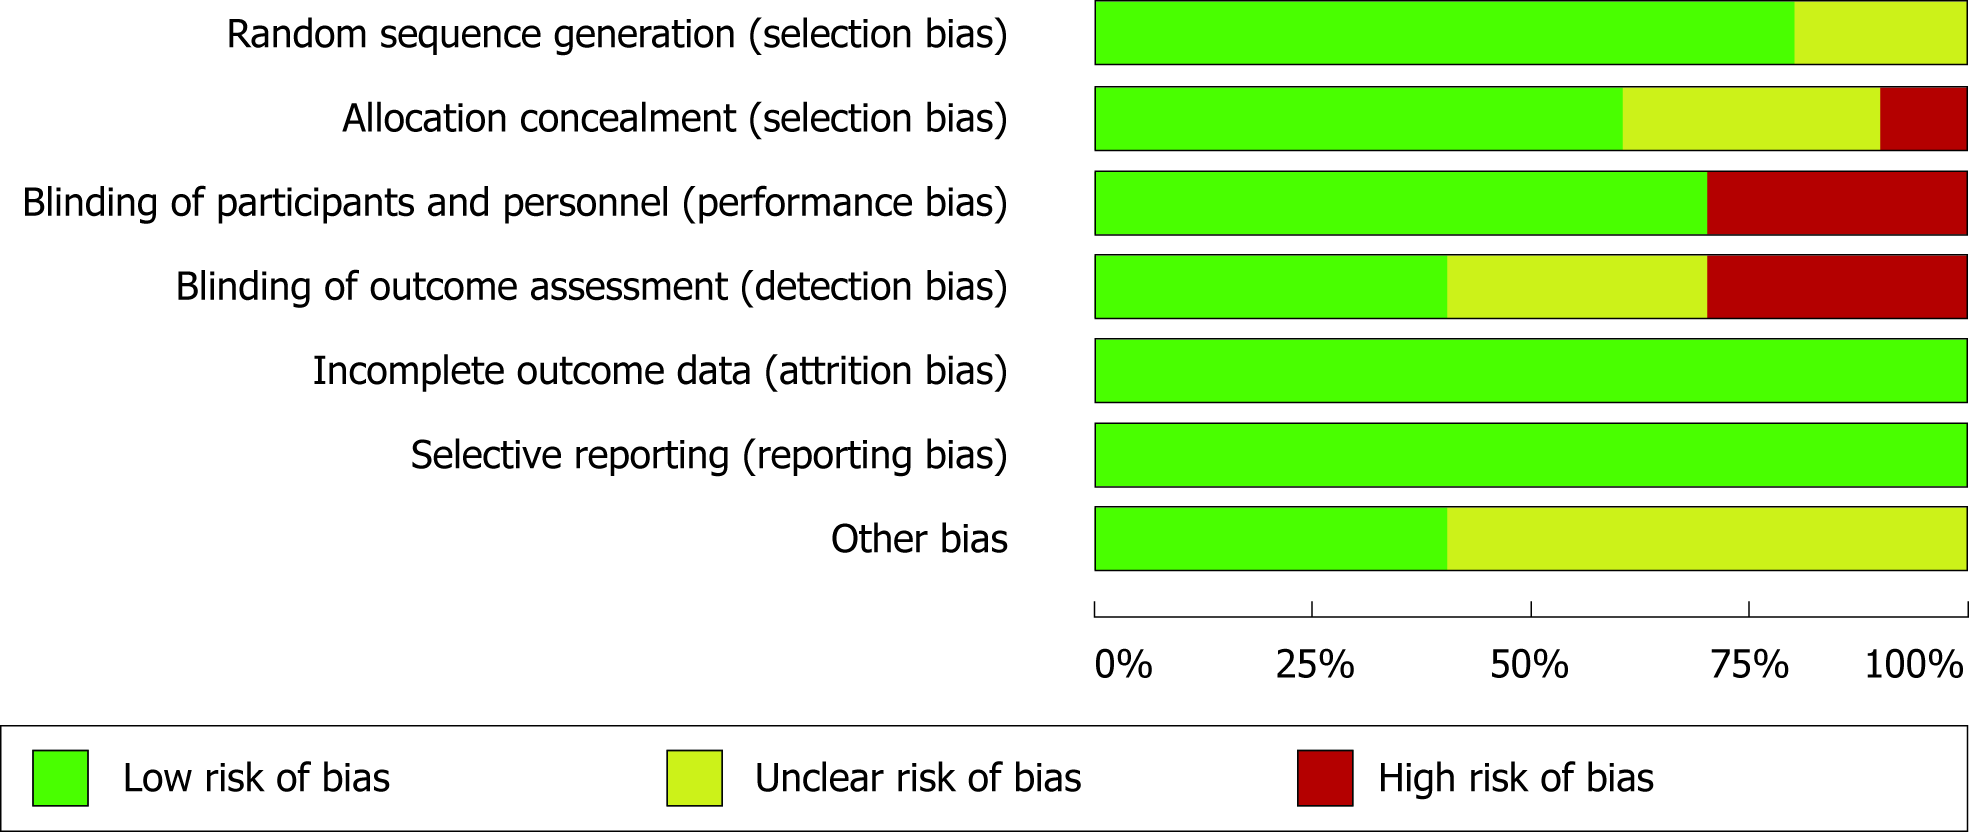
Figure 2 Risk of bias graph showing proportion of bias risk ratings across all included human studies.
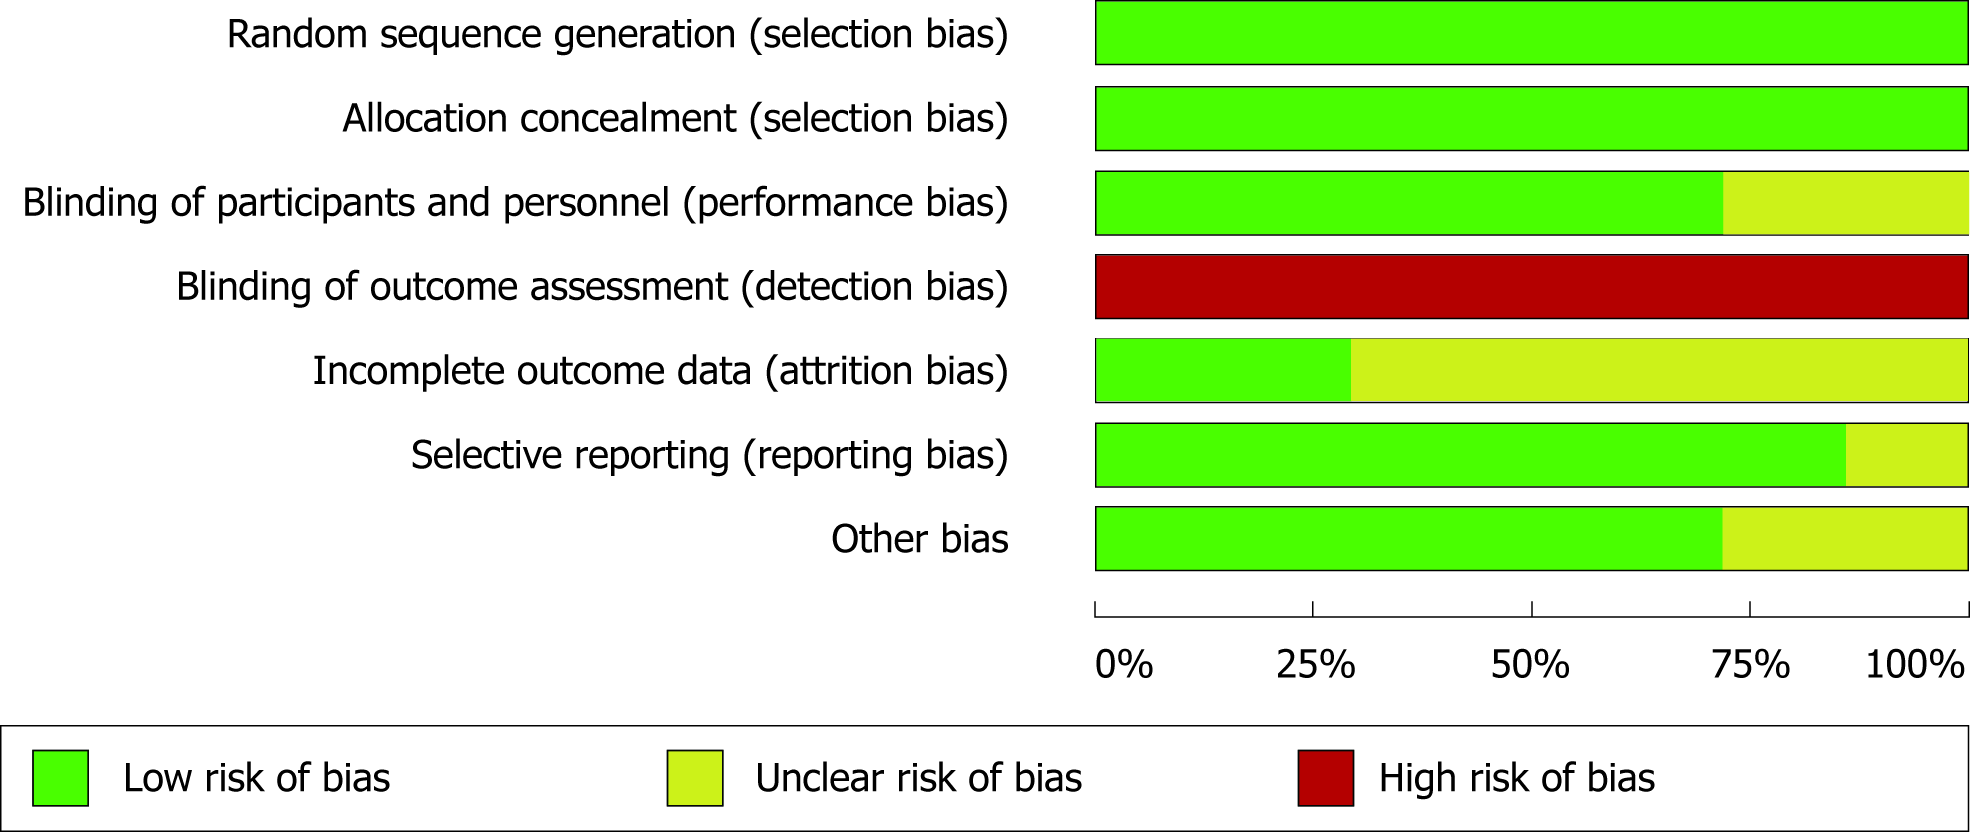
Figure 3 Risk of bias graph showing proportion of bias risk ratings across all included animal studies.
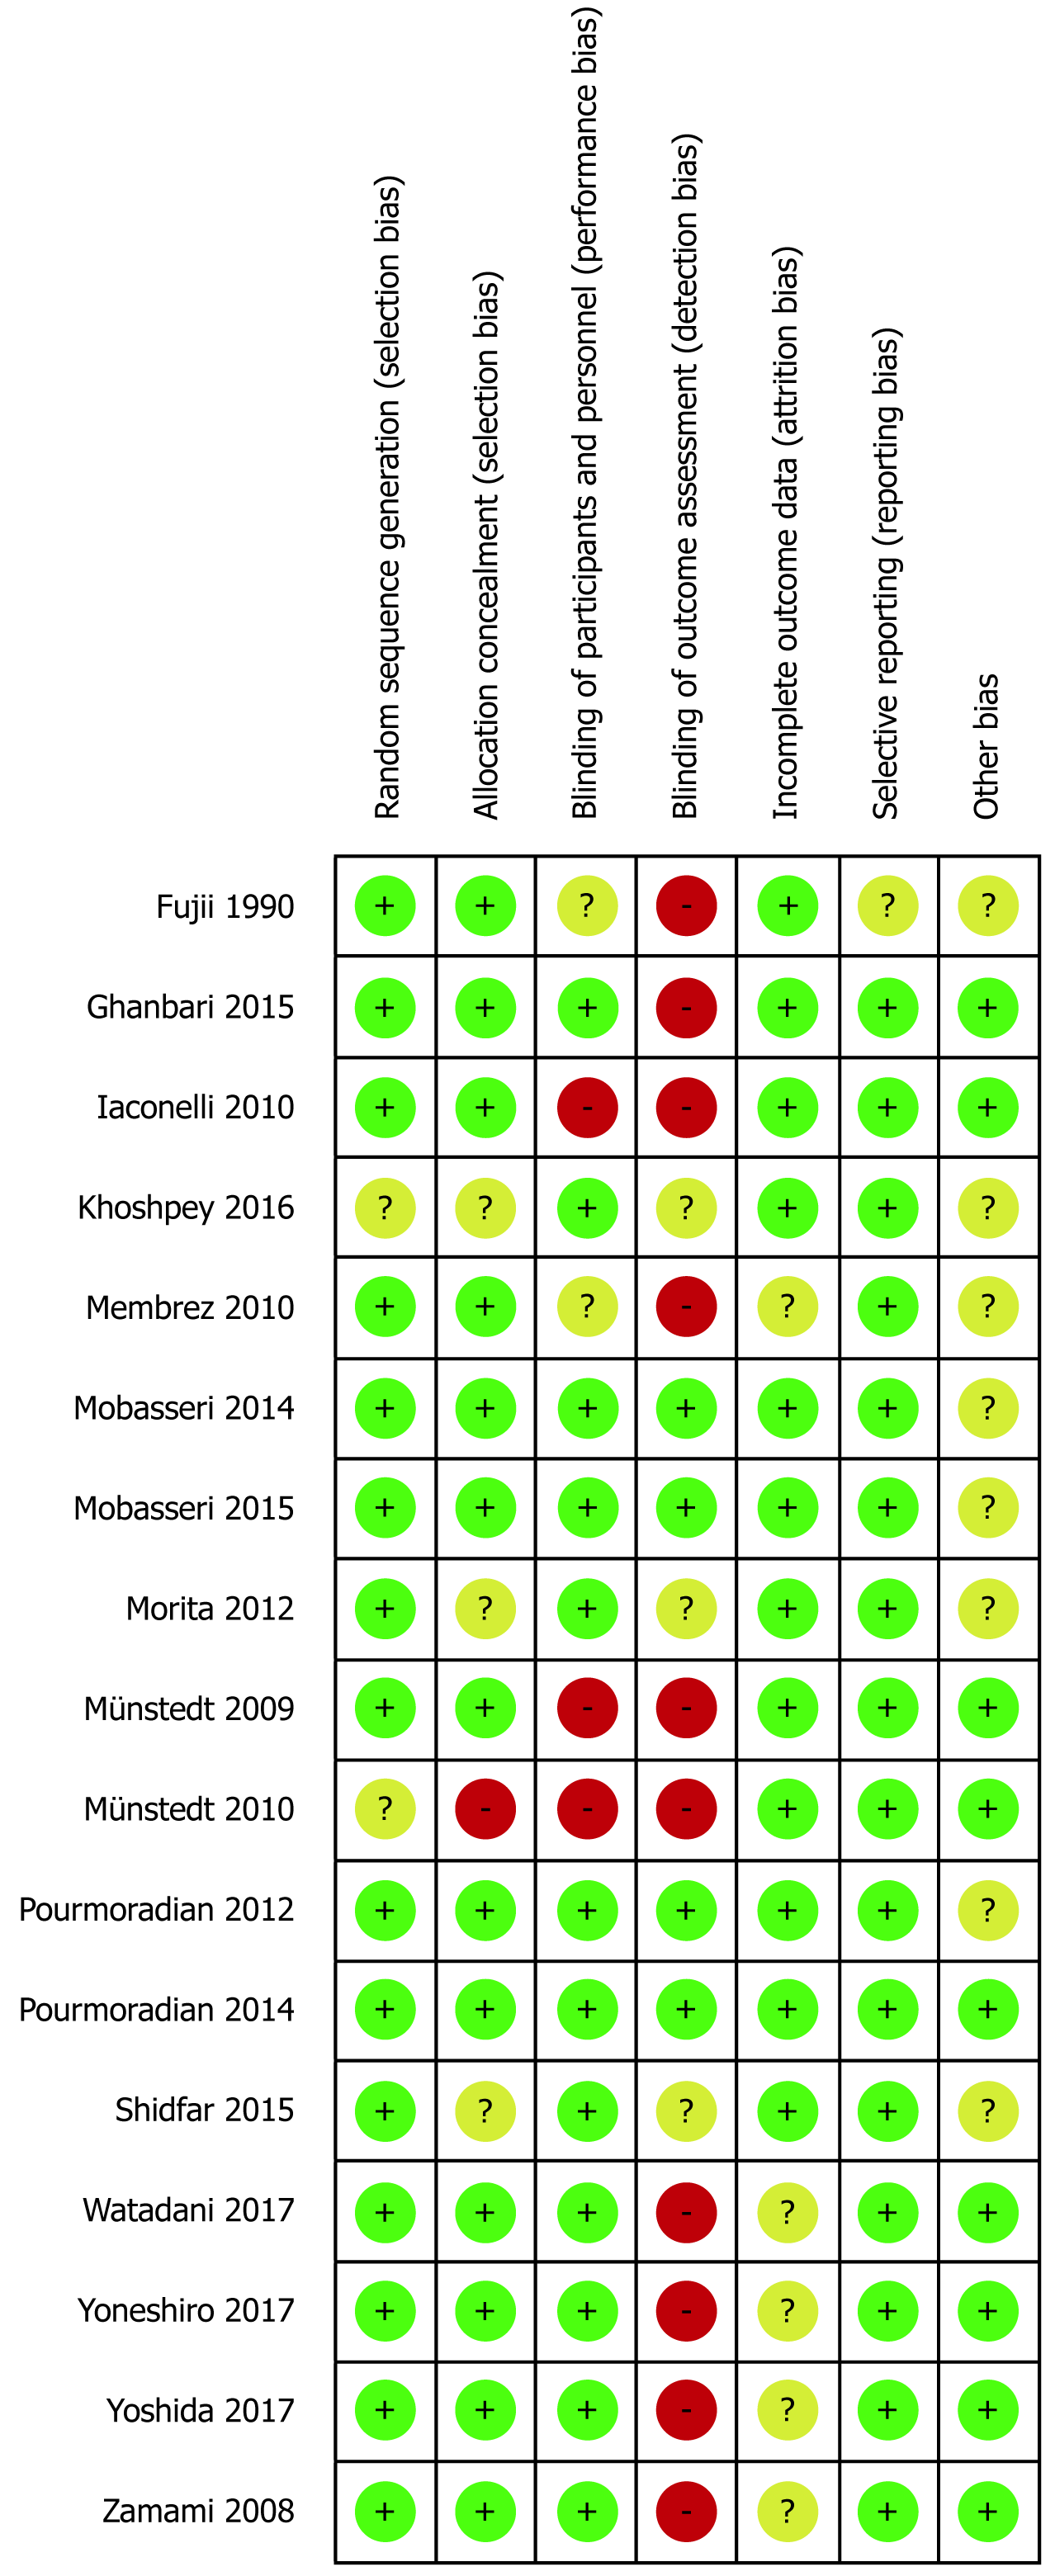
Figure 4 Risk of bias summary: Judgements about each risk of bias item for all included in vivo studies.
- Citation: Omer K, Gelkopf MJ, Newton G. Effectiveness of royal jelly supplementation in glycemic regulation: A systematic review. World J Diabetes 2019; 10(2): 96-113
- URL: https://www.wjgnet.com/1948-9358/full/v10/i2/96.htm
- DOI: https://dx.doi.org/10.4239/wjd.v10.i2.96


