Published online May 15, 2025. doi: 10.4251/wjgo.v17.i5.104172
Revised: January 20, 2025
Accepted: February 26, 2025
Published online: May 15, 2025
Processing time: 139 Days and 3 Hours
Hepatocellular carcinoma (HCC) is one of the most common malignant tumours of the digestive system worldwide. The expression of Ki-67 is crucial for the diagnosis, treatment, and prognostic evaluation of HCC.
To construct a machine learning model for the preoperative evaluation of Ki-67 expression in HCC and to assist in clinical decision-making.
This study included 164 pathologically confirmed HCC patients. Radiomic features were extracted from the computed tomography images reconstructed by superresolution of the intratumoral and peritumoral regions. Features were selected via the intraclass correlation coefficient, t tests, Pearson correlation coefficients and least absolute shrinkage and selection operator regression methods, and models were constructed via various machine learning methods. The best model was selected, and the radiomics score (Radscore) was calculated. A nomogram incorporating the Radscore and clinical risk factors was constructed. The predictive performance of each model was evaluated via receiver operating characteristic (ROC) curves and calibration curves, and decision curve analysis was used to assess the clinical benefits.
In total, 164 HCC patients, namely, 104 patients with high Ki-67 expression and 60 with low Ki-67 expression, were included. Compared with the models in which only intratumoral or peritumoral features were used, the fusion model in which intratumoral and peritumoral features were combined demonstrated stronger predictive ability. Moreover, the clinical-radiomics model including the Radscore and clinical features had higher predictive performance than did the fusion model (area under the ROC curve = 0.848 vs 0.780 in the training group, area under the ROC curve = 0.830 vs 0.760 in the validation group). The calibration curve showed good consistency between the predicted probability and the actual probability, and the decision curve further confirmed its clinical benefit.
A machine learning model based on the radiomic features of the intratumoral and peritumoral regions on superresolution computed tomography in conjunction with clinical factors can accurately evaluate Ki-67 expression. The model provides valuable assistance in selecting treatment strategies for HCC patients and contributes to research on neoadjuvant therapy for liver cancer.
Core Tip: Ki-67 expression is significantly correlated with hepatocellular carcinoma prognosis, and preoperative prediction of Ki-67 expression is crucial. To date, scholars have used radiomic features of tumour regions to predict their expression but have overlooked the important role of the peritumoral region. The findings in this study indicate that machine learning models that fully utilize the features of radiomics, tumour surrounding areas, and clinical factors can more accurately predict Ki-67 expression in hepatocellular carcinoma, thereby helping to improve personalized treatment strategies for liver cancer patients.
- Citation: Zhu ZW, Wu J, Guo Y, Ren QY, Li DN, Li ZY, Han L. Prediction of Ki-67 expression in hepatocellular carcinoma with machine learning models based on intratumoral and peritumoral radiomic features. World J Gastrointest Oncol 2025; 17(5): 104172
- URL: https://www.wjgnet.com/1948-5204/full/v17/i5/104172.htm
- DOI: https://dx.doi.org/10.4251/wjgo.v17.i5.104172
Hepatocellular carcinoma (HCC) is the predominant pathological type of primary liver cancer. Owing to its insidious onset and lack of effective prediction and treatment strategies, the prognosis of HCC is often poor[1]. For HCC patients with a high risk of recurrence, neoadjuvant therapy offers the possibility of achieving longer survival[2]. Therefore, it is particularly important to preoperatively identify HCC patients at high risk of recurrence.
Ki-67, a nuclear antigen, reflects the level of tumour proliferative activity through its proliferation index (PI)[3]. High expression of Ki-67 is strongly correlated with recurrence and metastasis in HCC, making Ki-67 an independent risk factor influencing prognosis[4,5]. Additionally, according to the study by Zhao et al[6], the Ki-67 high-expression subgroup of HCC patients had significantly higher recurrence-free survival rates at 1, 2, and 3 years during transcatheter arterial chemoembolization than did the Ki-67 low-expression subgroup (recurrence-free survival: 80.0%, 79.5%, and 69.2% vs 67.4%, 56.5%, and 46.7%, respectively; P = 0.035). These findings suggest that HCC patients with high Ki-67 expression may benefit from transcatheter arterial chemoembolization treatment. Therefore, preoperatively evaluating the expression of Ki-67 can be used to predict the treatment effect and prognosis, facilitating the selection of appropriate treatment strategies and reducing postoperative recurrence of HCC. Currently, the expression of Ki-67 can be assessed only through pathological methods, highlighting the critical need for noninvasive methods to predict Ki-67 expression.
Over the past several years, artificial intelligence has emerged as a hot topic in the medical field[7]. Radiomics can transform imaging data into numerous quantitative features to quantify and represent the biological characteristics of tumours, and this has significant clinical value for the accurate diagnosis and prognosis of diseases[8]. Gong et al[9] accurately predicted the expression of immune markers in HCC by means of multiphase magnetic resonance imaging. Xu et al[10] used a radiomic model based on computed tomography (CT) to predict microvascular invasion in HCC, achieving an area under the receiver operating characteristic (ROC) curve (AUC) of 0.889 in the validation group, indicating good predictive performance.
Previously, various tumours, including HCC, were found to be closely associated with peritumoral oedema and immune cell infiltration[11,12]. The tissues adjacent to the tumor can provide valuable understandings of tumor occurrence and development, thereby contributing to the improvement of the predictive capacity of models[13]. However, most machine learning models that utilize CT radiomics features to predict Ki67 expression in HCC are limited to the intratumoral region and disregard the peritumoral region[14].
Therefore, in this study, using superresolution CT images, we constructed a machine learning model integrating radiomic features extracted from intratumoral and peritumoral regions along with clinical information. The aim was to design this model to predict the expression of Ki-67 in HCC preoperatively, aiding clinicians in selecting optimal treatment strategies. Additionally, this study provides a new tool for research into neoadjuvant therapies for HCC.
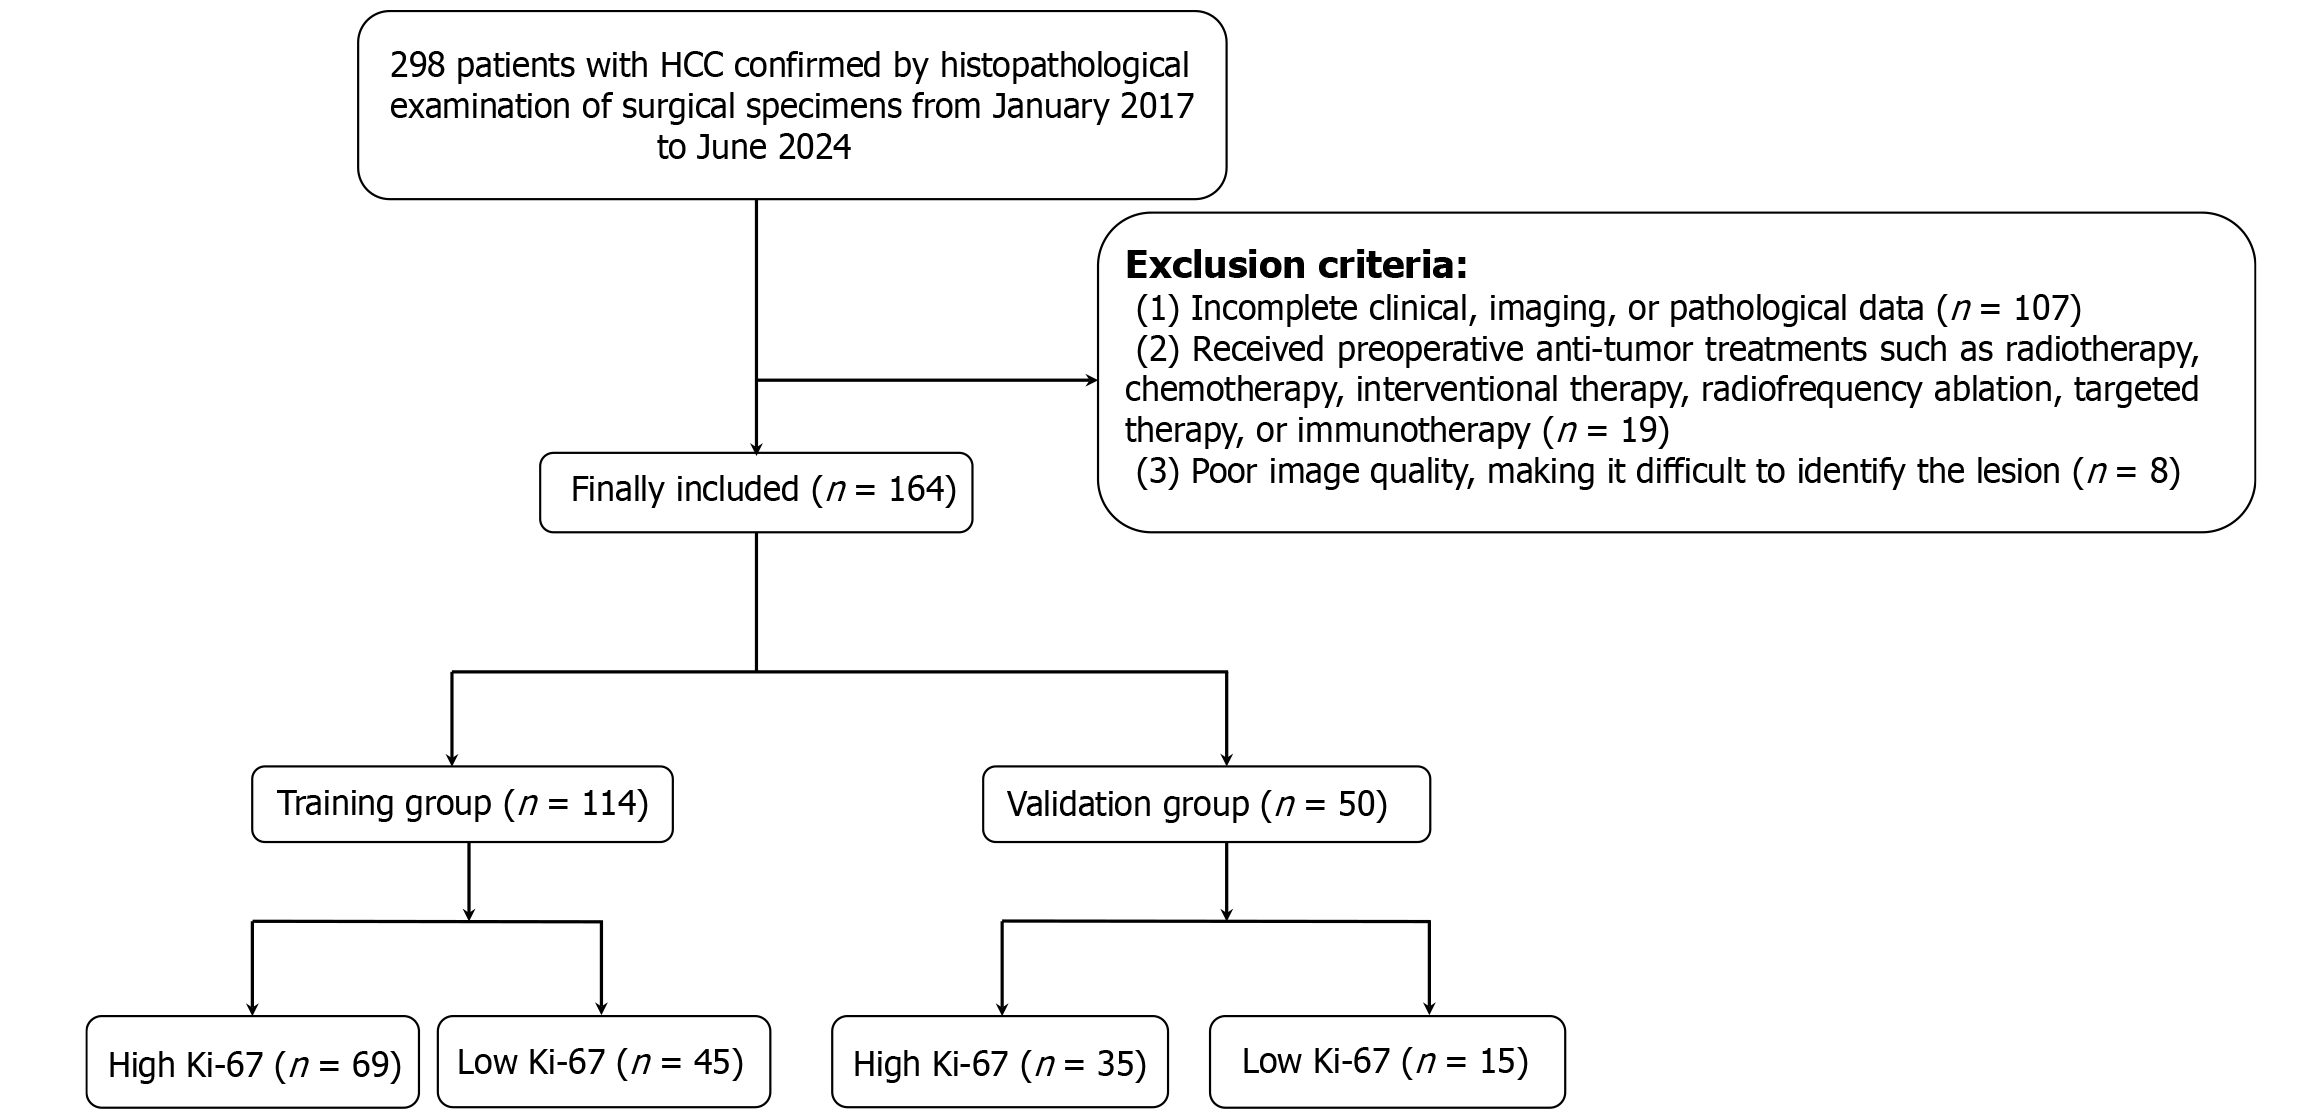
This study was approved by the Ethics Committee of the General Hospital of Northern Theater Command, No. Y(2024)168. Owing to the retrospective nature of the study and the use of anonymized data, there was no potential risk to the patients involved. Thus, informed consent was not necessary. Data were collected from 298 patients with HCC between January 2017 and June 2024. The inclusion criteria were: (1) Underwent enhanced liver CT scans within one month before surgery; (2) Aged ≥ 18 years; (3) Pathology report indicating a clear Ki-67 PI; and (4) Pathologically confirmed HCC. The exclusion criteria were: (1) Incomplete clinical, imaging, or pathology data (n = 107); (2) Received radiotherapy, chemotherapy, interventional therapy, radiofrequency ablation, targeted therapy, or immunotherapy before surgery (n = 19); or (3) Poor image quality, making it difficult to identify the lesion (n = 8). Ultimately, 164 patients with HCC were included in the retrospective study and were randomly divided into a training group (n = 114) and a validation group (n = 50) at a 7:3 ratio. As shown in Figure 1, a flowchart detailing the inclusion and exclusion process of patients is presented.
The CT examination utilized a GE Discovery CT750 HD scanner (GE Healthcare, Milwaukee, WI, United States). The imaging parameters used were as follows: Tube voltage, 120 kV; automatic tube current; scan slice thickness, 0.625 mm; rotation time, 0.6 seconds; detector collimation, 64 mm × 0.625 mm; field of view, 350-450 mm; and pixel size, 512 × 512. After the plain CT scan, a nonionic contrast agent was intravenously injected at 3.5-5.0 mL/second via a pump injector. Images from the arterial (35 seconds), portal venous (60 seconds), and delayed (180 seconds) phases were acquired via A-site software.
All patients with HCC underwent histopathological assessment following liver resection. After surgery, the specimens were fixed in 3.7% neutral buffered formalin and embedded in paraffin. Continuous 4-mm-thick sections were cut from the paraffin-embedded blocks, and immunohistochemical staining for Ki-67 proliferation was performed via the Ventana Benchmark Ultra automated staining system (Roche Ventana, Inc., AZ, United States). Brown staining of tumour cell nuclei indicates positive Ki-67 expression, and the Ki-67 PI was calculated on the basis of the positive rate of tumour cell nuclei. HCC lesions were classified into high expression (PI ≥ 20%) and low expression (PI < 20%) groups on the basis of the Ki-67 PI[15].
Image preprocessing was performed to eliminate errors caused by different acquisition parameters. All the CT images were resampled to a standard voxel size of 1 mm × 1 mm × 1 mm. The level and width of the image window were adjusted to 70 and 200, respectively.
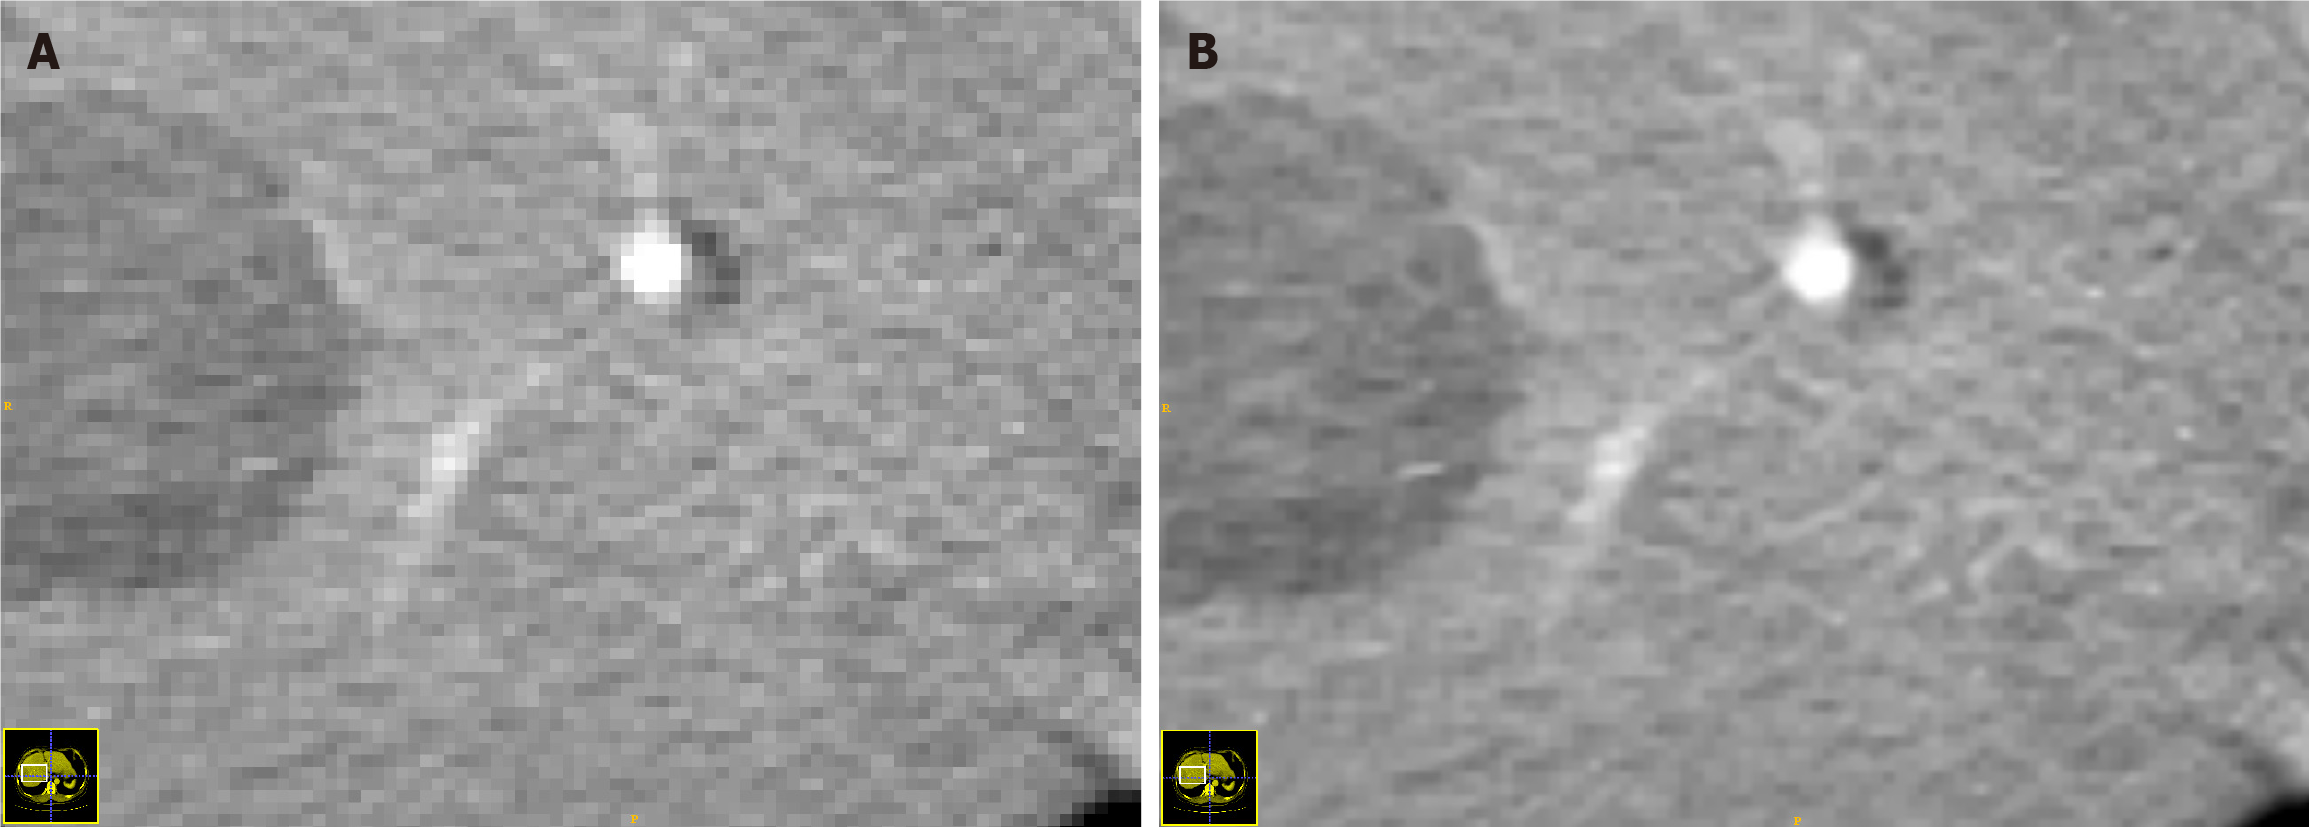
The superresolution reconstruction technology of the OneKey platform (version 4.6.30; Beijing, China) was applied to process the acquired CT images, as shown in Figure 2. This technology can convert the pixel volume of 1 mm × 1 mm × 1 mm to 1 mm × 1 mm × 0.5 mm, which doubles the spatial resolution of the images while maintaining their original size, significantly improving the image quality. Compared with other superresolution reconstruction technologies, this method demonstrates superior performance[16].
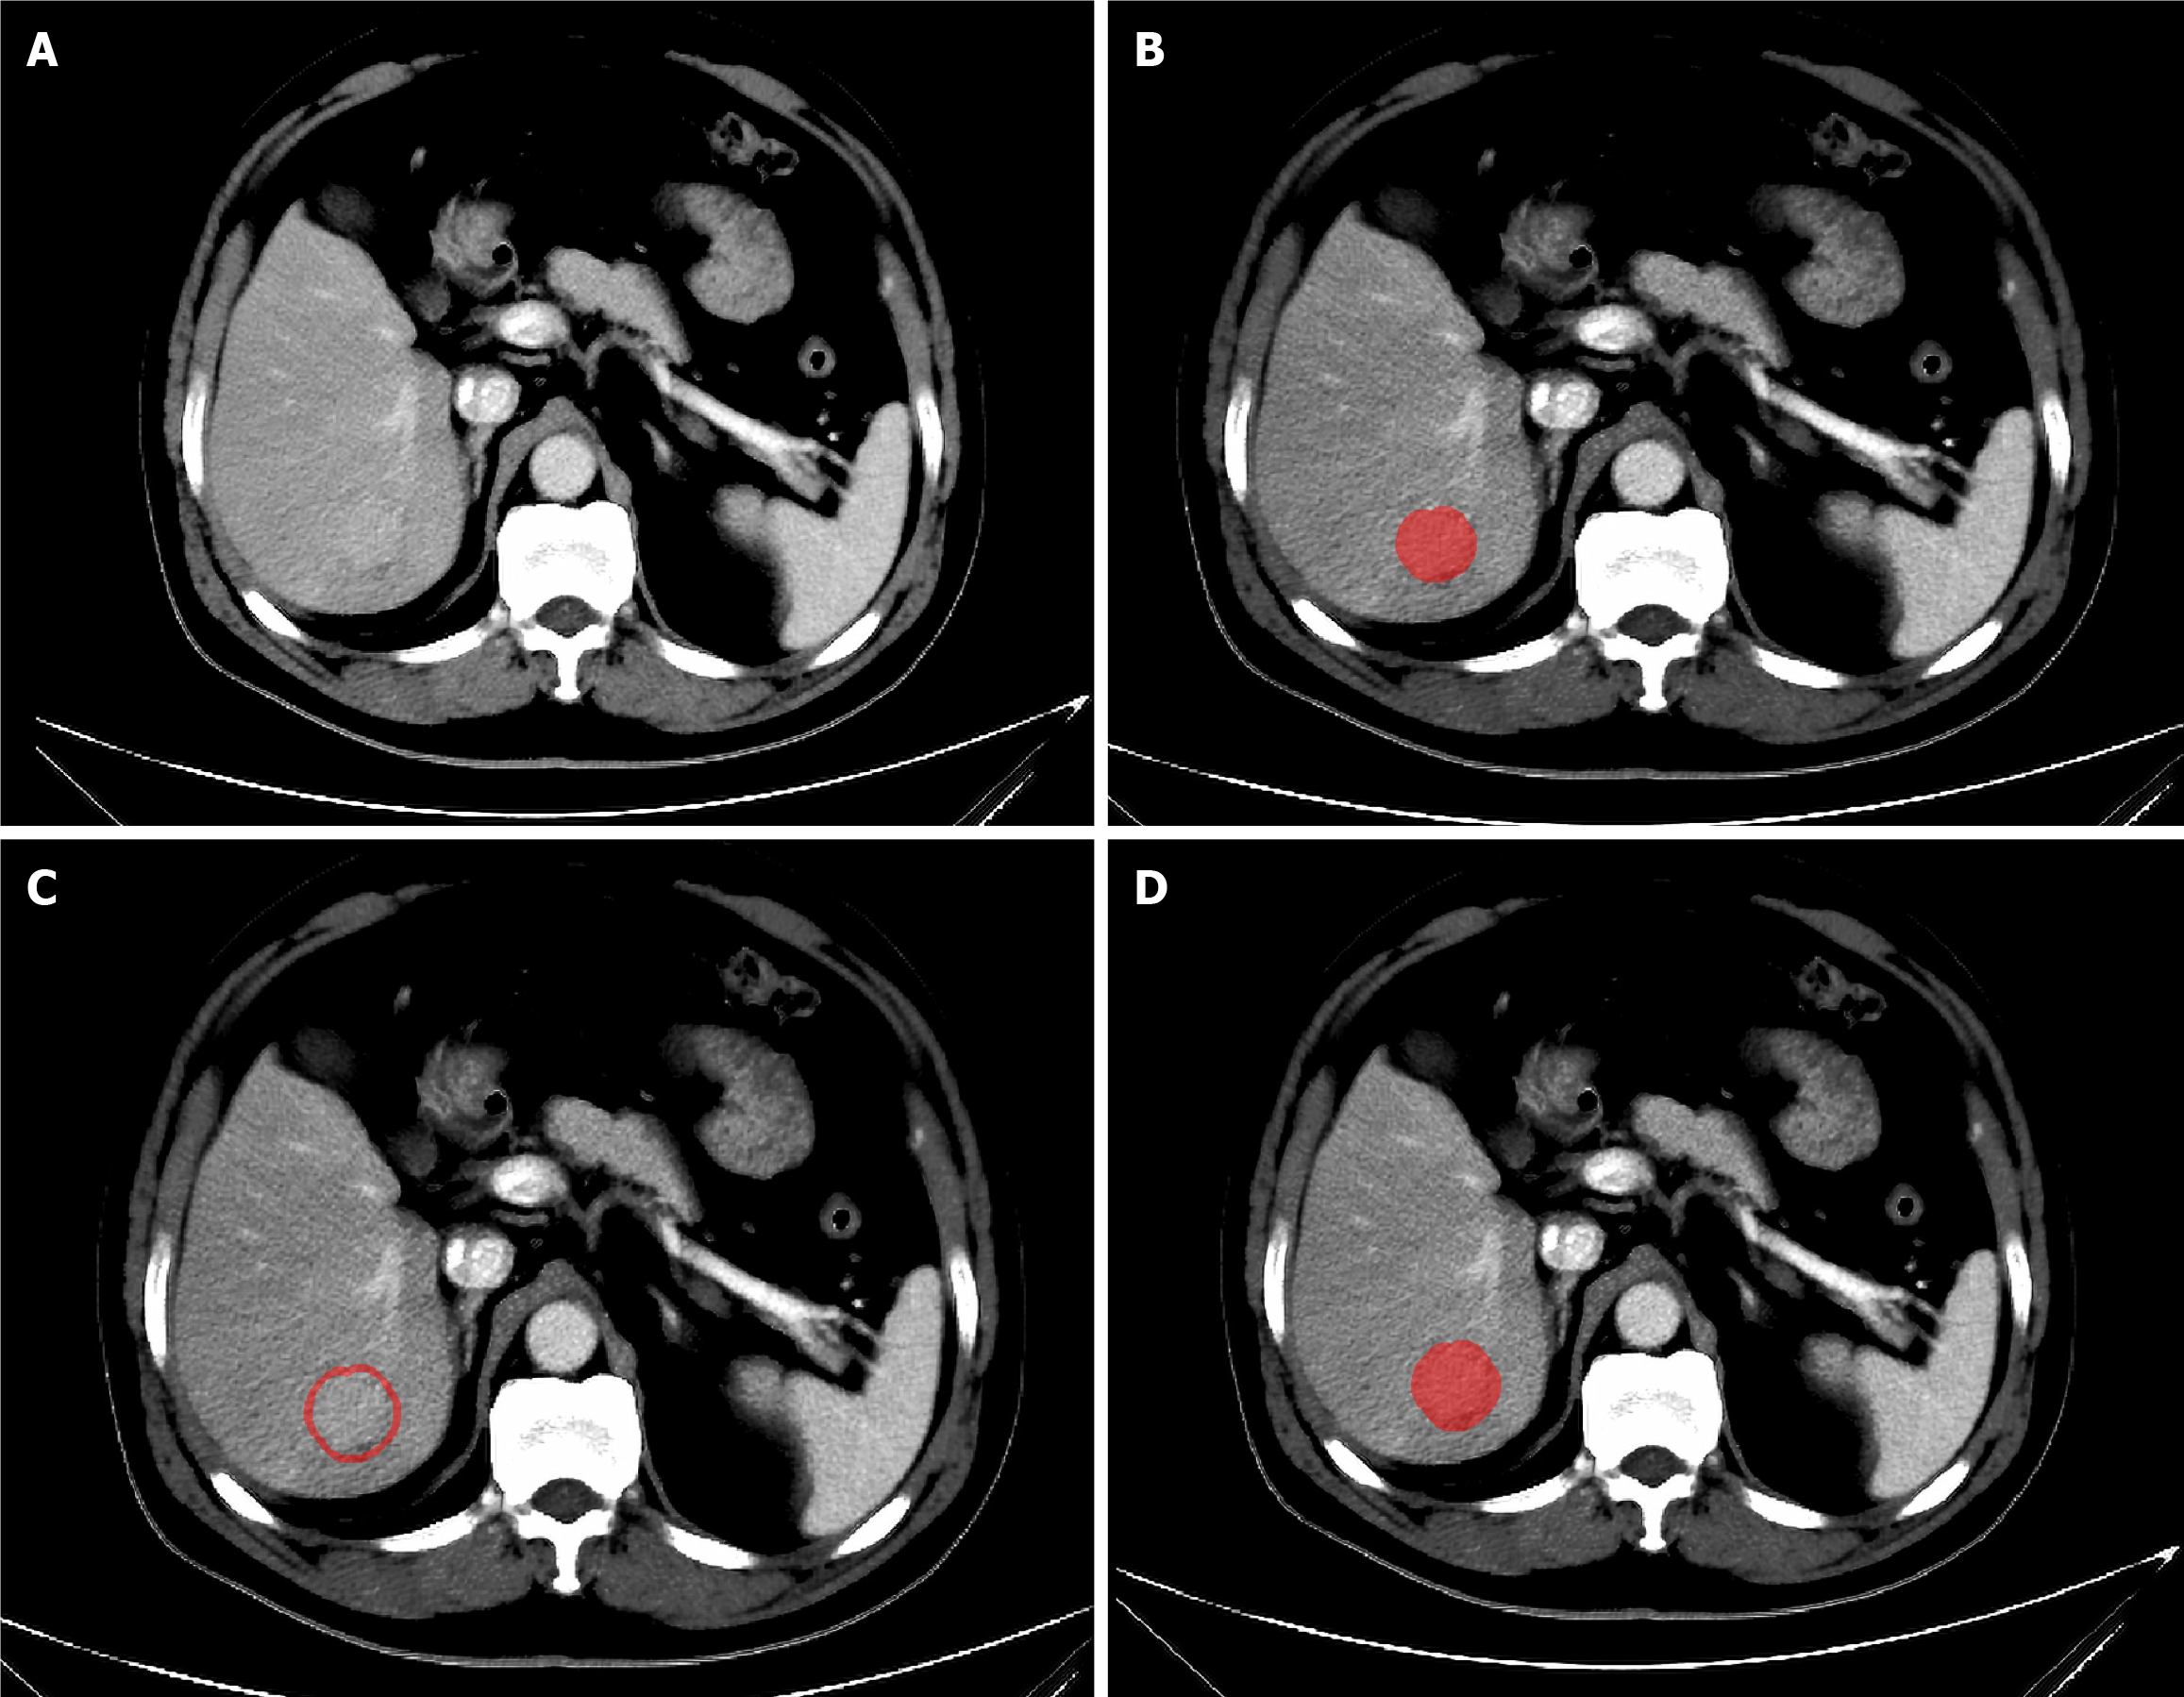
The volume of interest (VOI) is manually delineated on portal venous phase images by a doctor with extensive experience in reading abdominal CT images with ITK-SNAP software (version 3.8.0)[17]. Initially, manual delineation is performed layer by layer along the lesion’s edge in the cross-sectional view to form the VOI. Then, a three-dimensional expansion algorithm in Python software is used to automatically expand the VOI, with manual elimination of areas extending beyond the liver tissue. Zhao et al[18] constructed different prediction models using different sizes of peritumoral regions and reported that the 3-mm peritumoral model had better predictive performance than other regional prediction models. Therefore, in this study, the area within 3 mm around the tumour was defined as the peritumoral region. The VOI within the tumour was removed from the expanded VOI to obtain the peritumoral VOI, as shown in Figure 3. Thus, each patient had three different types of VOIs (intratumoral, peritumoral, and merged VOIs). Subsequently, the CT images of 30 patients were randomly selected, and the VOI was redrawn by the same doctor one month later to assess intraobserver reproducibility. Another senior doctor delineated the VOI on these images to evaluate interobserver reproducibility.
Feature extraction was performed with the open-source PyRadiomics package on the Python platform. All the features were categorized into geometric features, intensity features, and higher-order texture features. Geometric features primarily described the overall shape characteristics of the tumour. The intensity features were focused on the first-order statistical distribution of the voxel intensities within the tumour. Higher-order texture features represented the higher-order spatial distribution of shape or intensity, including grey-level co-occurrence matrix, grey-level run length matrix, grey-level size zone matrix, and neighbouring grey tone difference matrix features. All the features were standardized by Z-score normalization to achieve a normal distribution. Feature selection was then performed stepwise: (1) We evaluated feature consistency with the interclass and intraclass coefficients (ICCs), excluding features with ICCs < 0.8; (2) We also performed a t test, and only radiomic features with a P value < 0.05 were retained; (3) The Pearson correlation coefficients were calculated, and for two highly correlated features (coefficients > 0.9), only one was retained; and (4) Least absolute shrinkage and selection operator regression (LASSO) with 5-fold cross-validation was used to adjust the optimal λ value and determine the best features. A radiomics score (Radscore) for each patient was subsequently calculated by the linear combination of retained features multiplied by their respective coefficients.
We employed logistic regression to construct radiomic models using optimal radiomic features extracted from intratumoral, peritumoral, and combined regions. The ROC curves for every model were generated, and their AUCs were compared. The model that has the highest AUC in the validation group was chosen as the radiomic model with the most outstanding evaluation ability. Each patient’s Radscore was calculated by multiplying the linear combination of retained features by their respective value.
Univariate logistic regression analysis of the clinical features on the training group was performed, and features with P < 0.05 were included in multivariate logistic regression to determine the best clinical features for constructing a clinical model. A combined clinical-radiomics model was established by integrating the Radscore and clinical features, and a nomogram was plotted for clinical application. Calibration curves diagrams were drawn to assess the consistency between the prediction model and the pathologically confirmed Ki-67 status, and the Hosmer-Lemeshow test was used to evaluate the model’s goodness of fit, with P < 0.05 indicating poor calibration[19]. Decision curve analysis (DCA) diagrams were used to analyse the clinical application value at different threshold probabilities.
In this study, statistical analyses were performed using SPSS software and Python software for plotting ROC curves, nomograms, calibration curves, and decision curves. For quantitative variables, the Shapiro-Wilk test was used to determine whether the data conformed to a normal distribution, and the Bartlett test was used to determine whether there was homogeneity of variance. When both of these tests are completed, the independent-sample t test was utilized for comparisons; when either test failed, the Mann-Whitney U test was employed. Categorical variables were analysed with the χ2 test. A two-tailed P value < 0.05 indicated statistical significance.
In total, 164 patients with HCC were included in this study and were randomly divided into a training group of 114 patients and a validation group of 50 patients. There were no significant differences in the baseline characteristics between the training and validation groups, as shown in Supplementary Table 1. Among all patients, 104 (63%) were pathologically diagnosed with high Ki-67 expression, and 60 (37%) had low Ki67 expression. Among the clinical features, the factors that were significantly different between the high and low Ki-67 expression groups were prothrombin time (PT) (P < 0.001), hepatitis B virus infection (P < 0.001) and cirrhosis (P = 0.007) (Table 1).
| Variables | Total (n = 164) | Low Ki-67 (n = 60) | High Ki-67 (n = 104) | P value |
| Age (year), mean ± SD | 59.34 ± 8.47 | 60.73 ± 9.02 | 58.53 ± 8.07 | 0.109 |
| WBC (× 109/L), median (Q1, Q3) | 5.30 (3.90, 6.70) | 5.04 (3.38, 6.70) | 5.45 (4.20, 6.70) | 0.342 |
| RBC (× 1012), mean ± SD | 4.35 ± 0.62 | 4.33 ± 0.51 | 4.37 ± 0.67 | 0.679 |
| HGB (g/L), median (Q1, Q3) | 137.50 (124.75,150.00) | 135.50 (125.00,148.00) | 140.00 (123.75,150.25) | 0.598 |
| PLT (× 109/L), median (Q1, Q3) | 155.50 (111.00, 203.25) | 145.00 (101.50, 191.75) | 157.00 (120.25, 211.50) | 0.094 |
| ALT (U/L), median (Q1, Q3) | 26.87 (19.12, 40.84) | 26.41 (18.96, 37.97) | 27.35 (19.62, 47.19) | 0.307 |
| AST (U/L), median (Q1, Q3) | 26.62 (21.24, 39.60) | 26.62 (21.00, 35.19) | 26.46 (21.30, 43.30) | 0.466 |
| TBIL (μmol/L), median (Q1, Q3) | 12.80 (9.65, 16.15) | 13.20 (9.98, 16.95) | 12.65 (9.25, 15.80) | 0.386 |
| DBIL (μmol/L), median (Q1, Q3) | 3.70 (2.80, 5.60) | 4.05 (3.08, 5.8) | 3.60 (2.70, 4.93) | 0.138 |
| IBIL (μmol/L), median (Q1, Q3) | 8.70 (6.08, 11.38) | 9.05 (6.20, 11.20) | 8.50 (6.00, 11.78) | 0.535 |
| GGT (U/L), median (Q1, Q3) | 50.06 (30.19, 99.39) | 53.98 (31.40, 111.53) | 49.12 (29.25, 93.03) | 0.653 |
| AKP (U/L), median (Q1, Q3) | 85.01 (69.99, 103.85) | 88.06 (71.27, 103.67) | 83.460 (67.38, 104.75) | 0.478 |
| TBA (μmol/L), median (Q1, Q3) | 8.35 (5.00, 14.48) | 8.35 (5.00, 18.15) | 8.25 (5.15, 12.78) | 0.377 |
| PT (second), median (Q1, Q3) | 13.50 (12.70, 14.39) | 13.80 (13.20, 14.72) | 13.30 (12.50, 14.12) | < 0.001 |
| INR (second), median (Q1, Q3) | 1.06 (1.00, 1.13) | 1.05 (1.02, 1.16) | 1.06 (1.00, 1.11) | 0.190 |
| APTT (second), median (Q1, Q3) | 35.30 (30.35, 38.63) | 35.50 (33.38, 38.75) | 35.10 (28.98, 38.23) | 0.173 |
| FIB (g/L), median (Q1, Q3) | 2.82 (2.32, 3.31) | 2.89 (2.28, 3.49) | 2.76 (2.35, 3.17) | 0.725 |
| TT (second), mean ± SD | 17.29 ± 1.14 | 17.40 ± 0.99 | 17.22 ± 1.21 | 0.347 |
| AFP (IU/mL), median (Q1, Q3) | 22.70 (4.35, 209.33) | 9.91 (3.95, 119.80) | 44.83 (4.54, 238.39) | 0.055 |
| CNLC | 0.066 | |||
| Ia | 68 (41.46) | 31 (51.67) | 37 (35.58) | |
| Ib | 63 (38.42) | 16 (26.67) | 47 (45.19) | |
| IIa | 30 (18.29) | 12 (20.00) | 18 (17.31) | |
| IIb | 1 (0.61) | 1 (1.67) | 0 (0.00) | |
| IIIa | 2 (1.22) | 0 (0.00) | 2 (1.92) | |
| BCLC | 0.457 | |||
| A | 131 (79.88) | 47 (78.33) | 84 (80.77) | |
| B | 31 (18.90) | 13 (21.67) | 18 (17.31) | |
| C | 2 (1.22) | 0 (0.00) | 2 (1.92) | |
| Gender | 0.957 | |||
| Female | 27 (16.46) | 10 (16.67) | 17 (16.35) | |
| Male | 137 (83.54) | 50 (83.33) | 87 (83.65) | |
| Hepatitis B | < 0.001 | |||
| Negative | 45 (27.434) | 26 (43.33) | 19 (18.27) | |
| Positive | 119 (72.56) | 34 (56.67) | 85 (81.73) | |
| Hepatitis C | 0.669 | |||
| Negative | 141 (85.98) | 53 (88.33) | 88 (84.62) | |
| Positive | 23 (14.02) | 7 (11.67) | 16 (15.39) | |
| Drink | 0.977 | |||
| No | 100 (60.98) | 36 (60.00) | 64 (61.54) | |
| Yes | 64 (39.02) | 24 (40.00) | 40 (38.46) | |
| Smoke | 0.324 | |||
| No | 86 (52.44) | 35 (58.33) | 51 (49.04) | |
| Yes | 78 (47.56) | 25 (41.67) | 53 (50.96) | |
| Cirrhosis | 0.007 | |||
| Absent | 110 (67.07) | 48 (80.00) | 62 (59.62) | |
| Present | 54 (32.93) | 12 (20.00) | 42 (40.38) |
A total of 1834 radiomic features were extracted from the intratumoral, peritumoral, and fused VOIs of the portal venous phase images. On the basis of the ICCs, 46, 86, and 88 features were removed from the intratumoral, peritumoral, and fused VOIs, respectively. Subsequently, 45, 23, and 34 features were retained for LASSO regression after t tests and correlation screening. Finally, by means of LASSO regression screening, 10, 14, and 7 features were selected from the intratumoral, peritumoral, and fused VOIs, respectively. The specific LASSO results can be found in Supplementary Figures 1-3 and Supplementary Table 2.
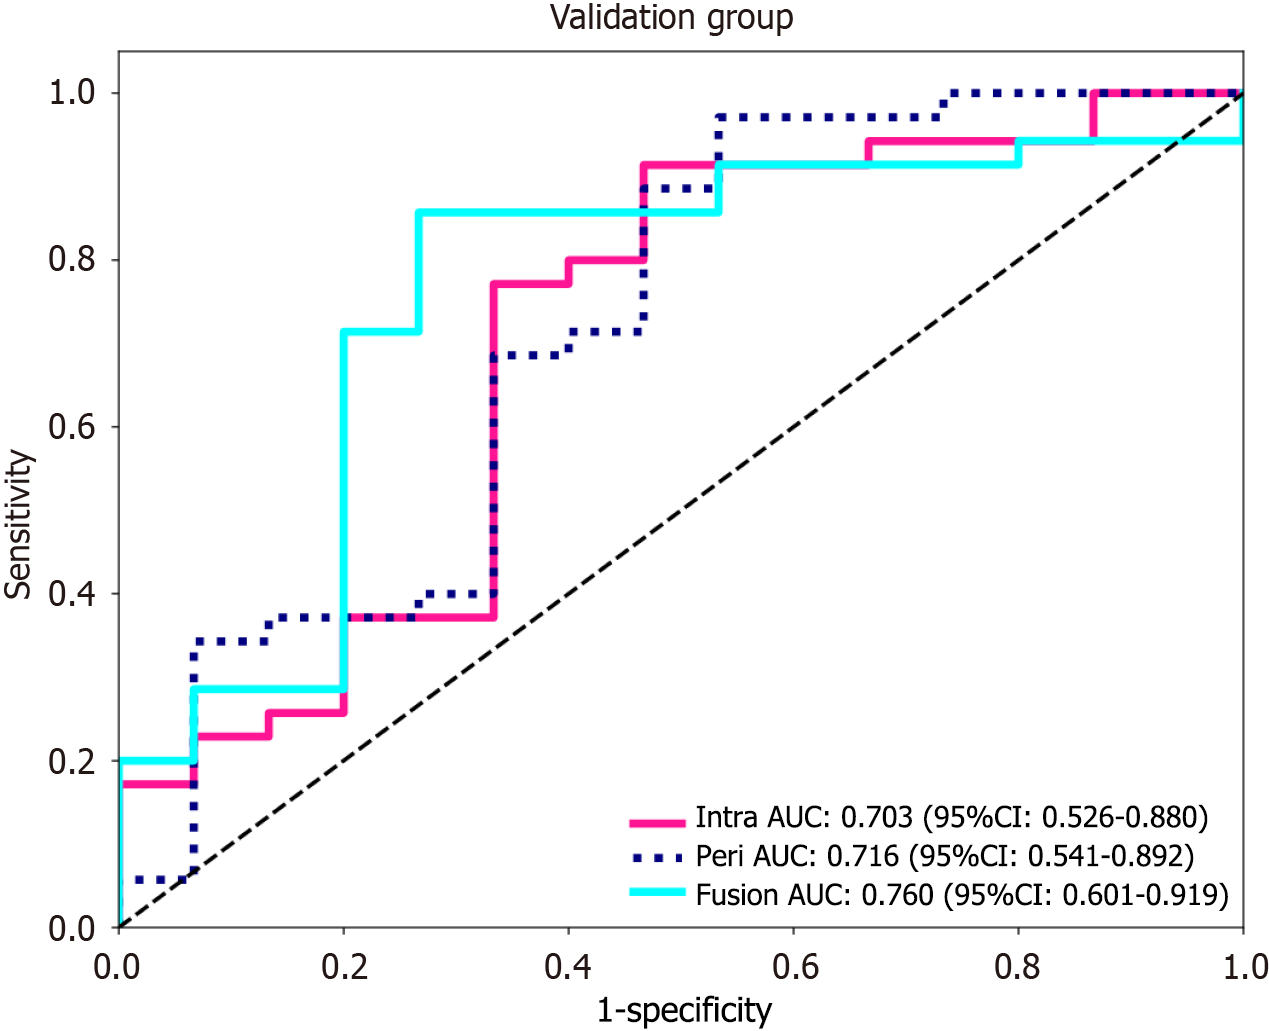
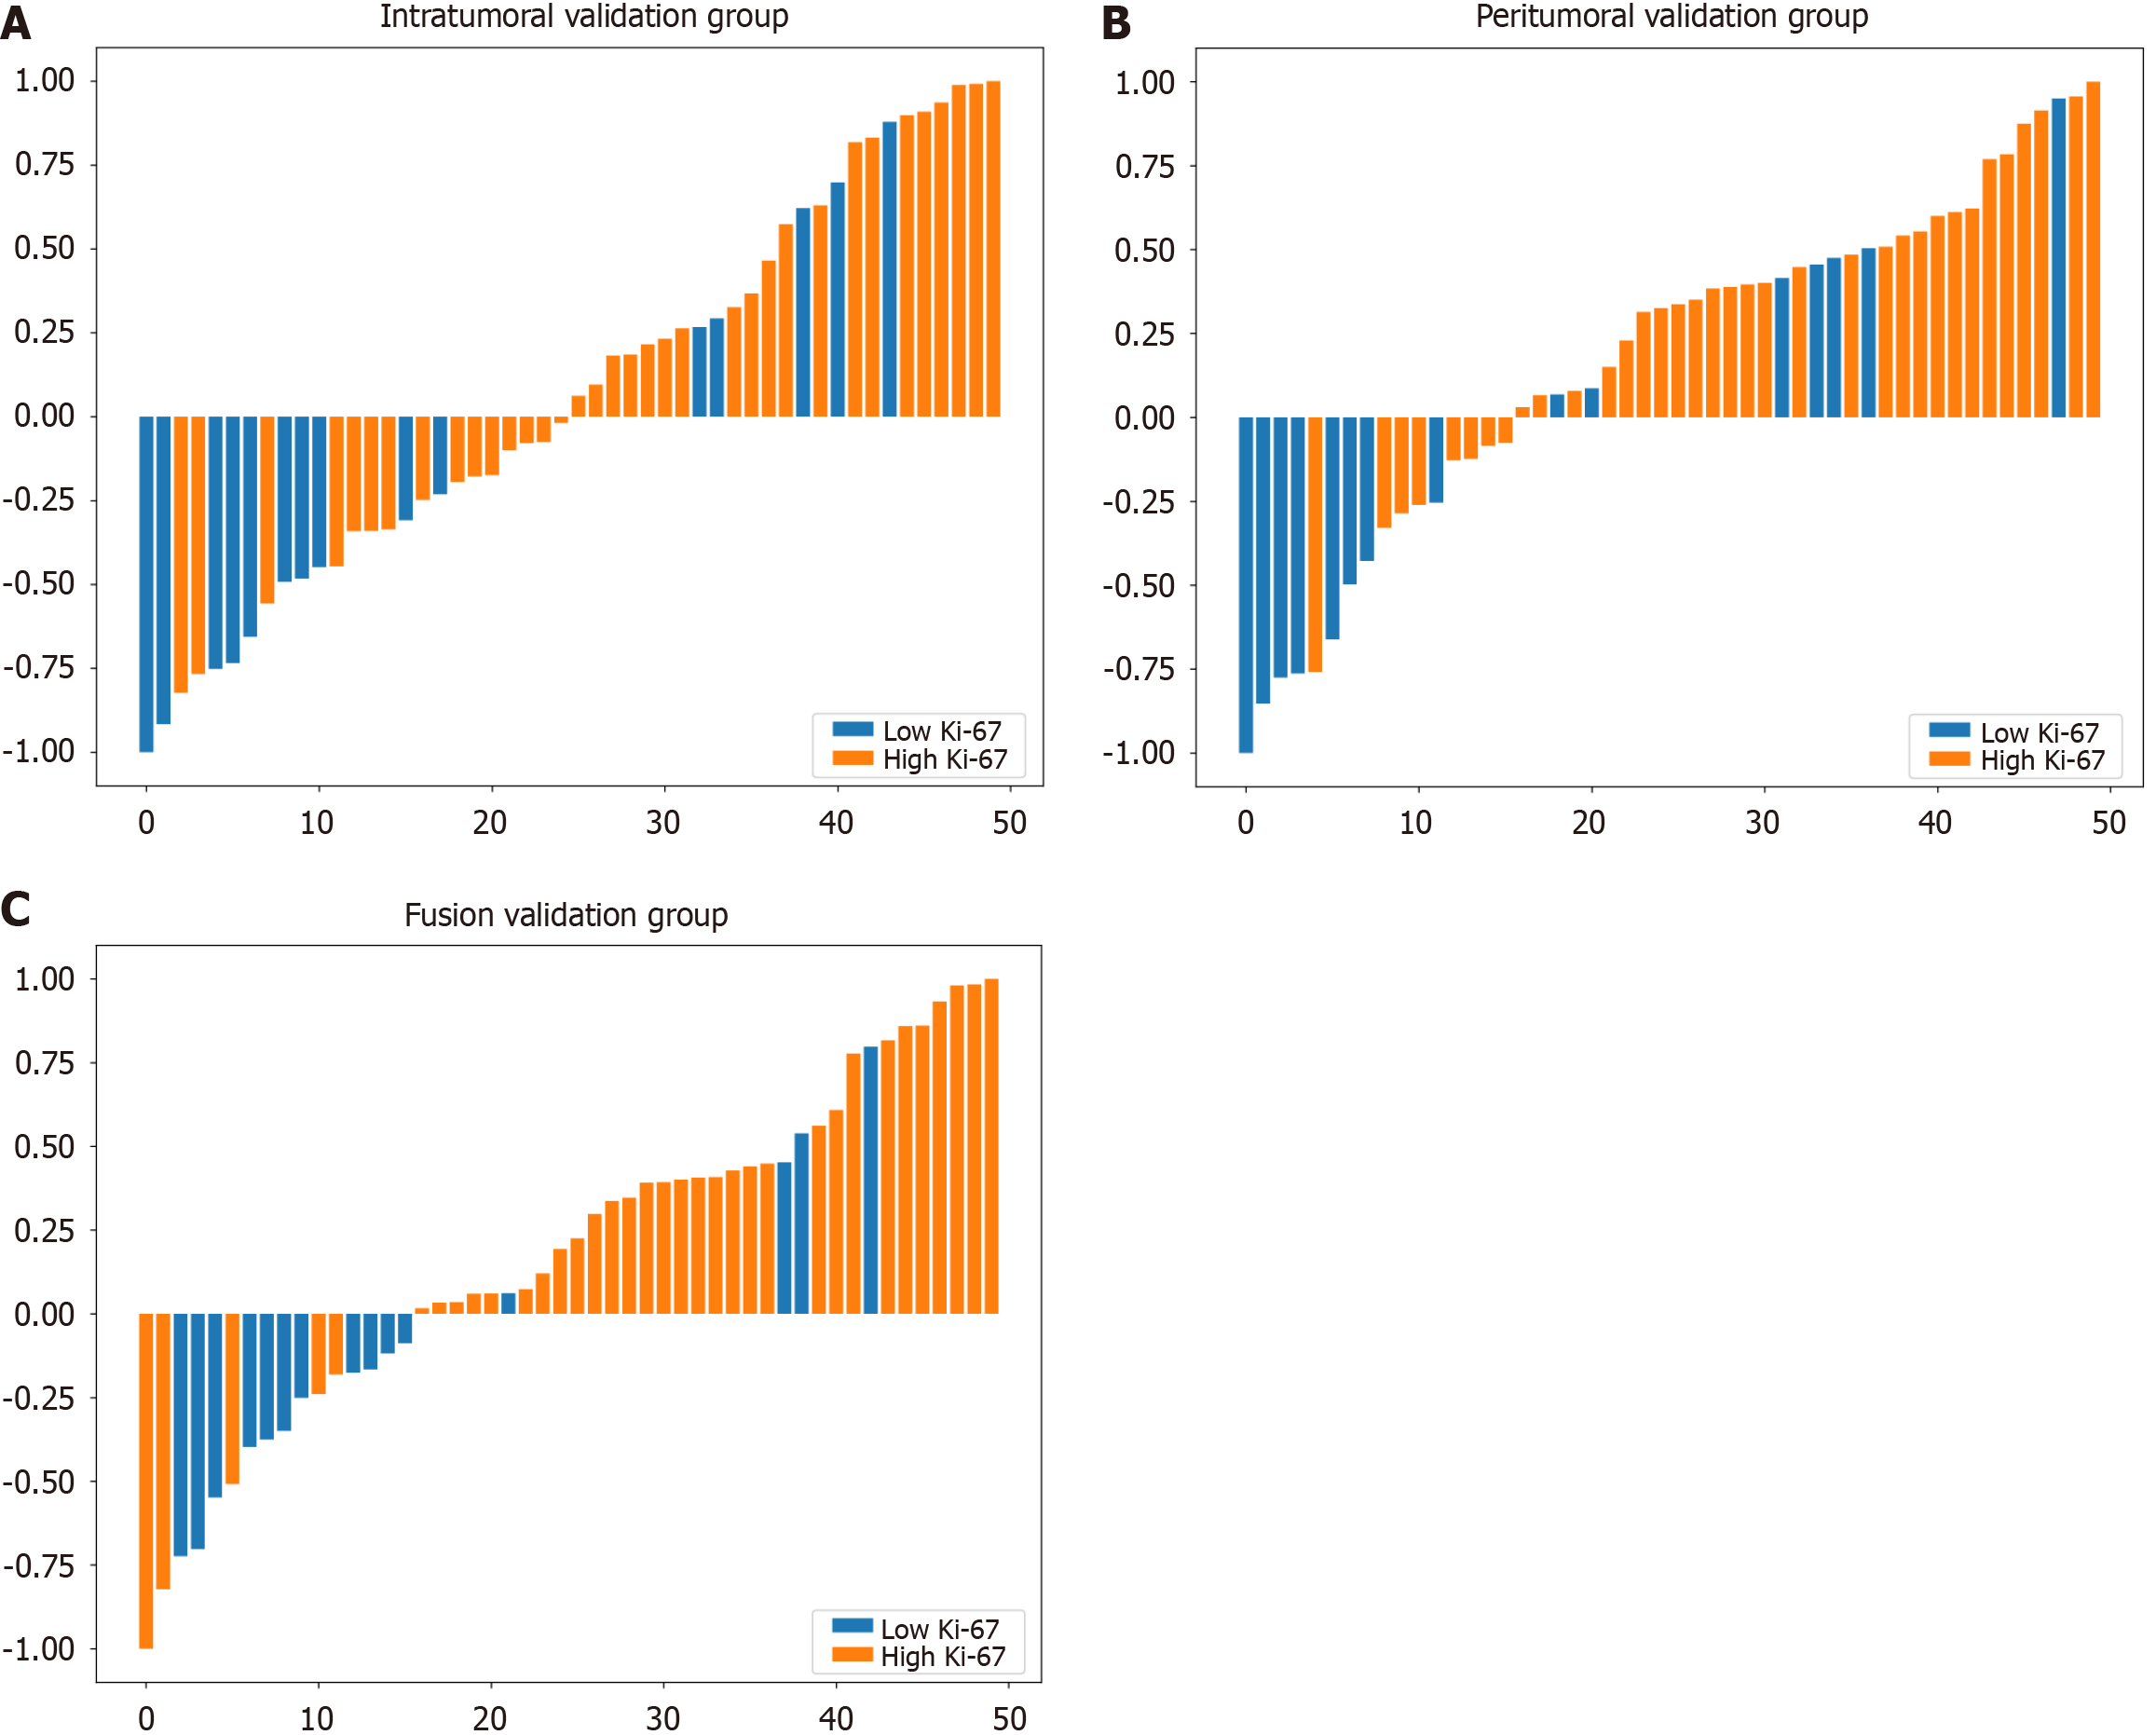
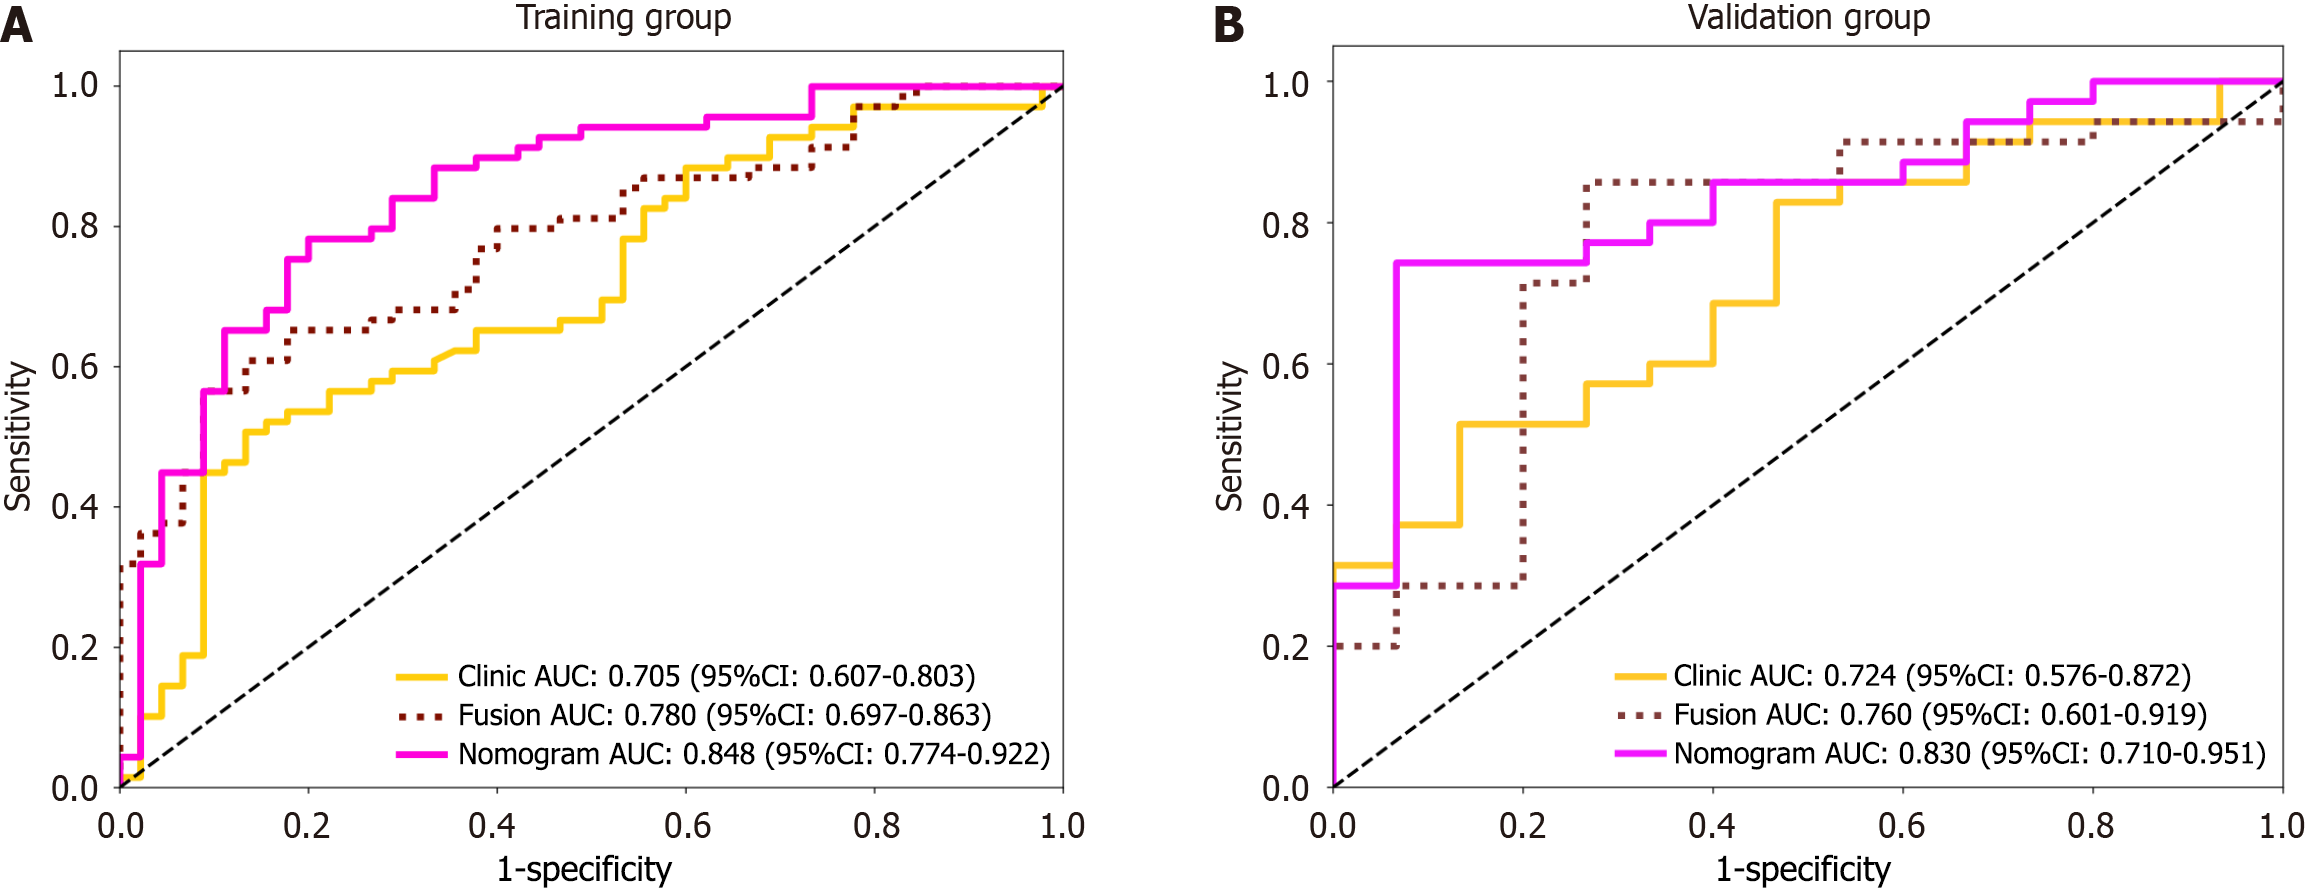
Using the logistic regression algorithm, we constructed predictive models and selected the best-performing model. Among the three models in the validation group, the fusion model had the highest predictive capability, with an AUC of 0.760 (0.601-0.919), which surpassed those of the intratumoral model [AUC of 0.703 (0.526-0.880)] and the peritumoral model [AUC of 0.716 (0.541-0.892)], as shown in Figure 4. The ROC curve for the training group is presented in Supplementary Figure 4. To further demonstrate the performance of the model, we plotted waterfall plots for each of the three prediction models. The results showed that the three models have high accuracy in assessing the expression level of Ki-67. The waterfall plot of the validation group is shown in Figure 5, and the waterfall plot of the training group is shown in Supplementary Figure 5.
The associations among the clinical features of patients in the training group, the Radscore of the fusion model, and high Ki-67 expression were reported via both univariate and multivariate logistic regression analyses. The computation formula for the Radscore is provided in Supplementary material. The results revealed that Radscore [12.828 (2.467, 66.686), P = 0.011]; alanine aminotransferase (ALT) [1.050 (1.010-1.092), P = 0.040]; hepatitis B virus infection [8.294 (2.651-25.946), P = 0.002]; and cirrhosis [6.698 (2.008-22.354), P = 0.009], showed a positive association with high Ki-67 expression. The specific data are presented in Supplementary Table 3.
A logistic regression model was developed that incorporated ALT, hepatitis B virus infection, and cirrhosis. The model demonstrated an AUC of 0.705 (0.607-0.803) in the training group and 0.724 (0.576-0.872) in the validation group, as illustrated in Supplementary Figure 6.
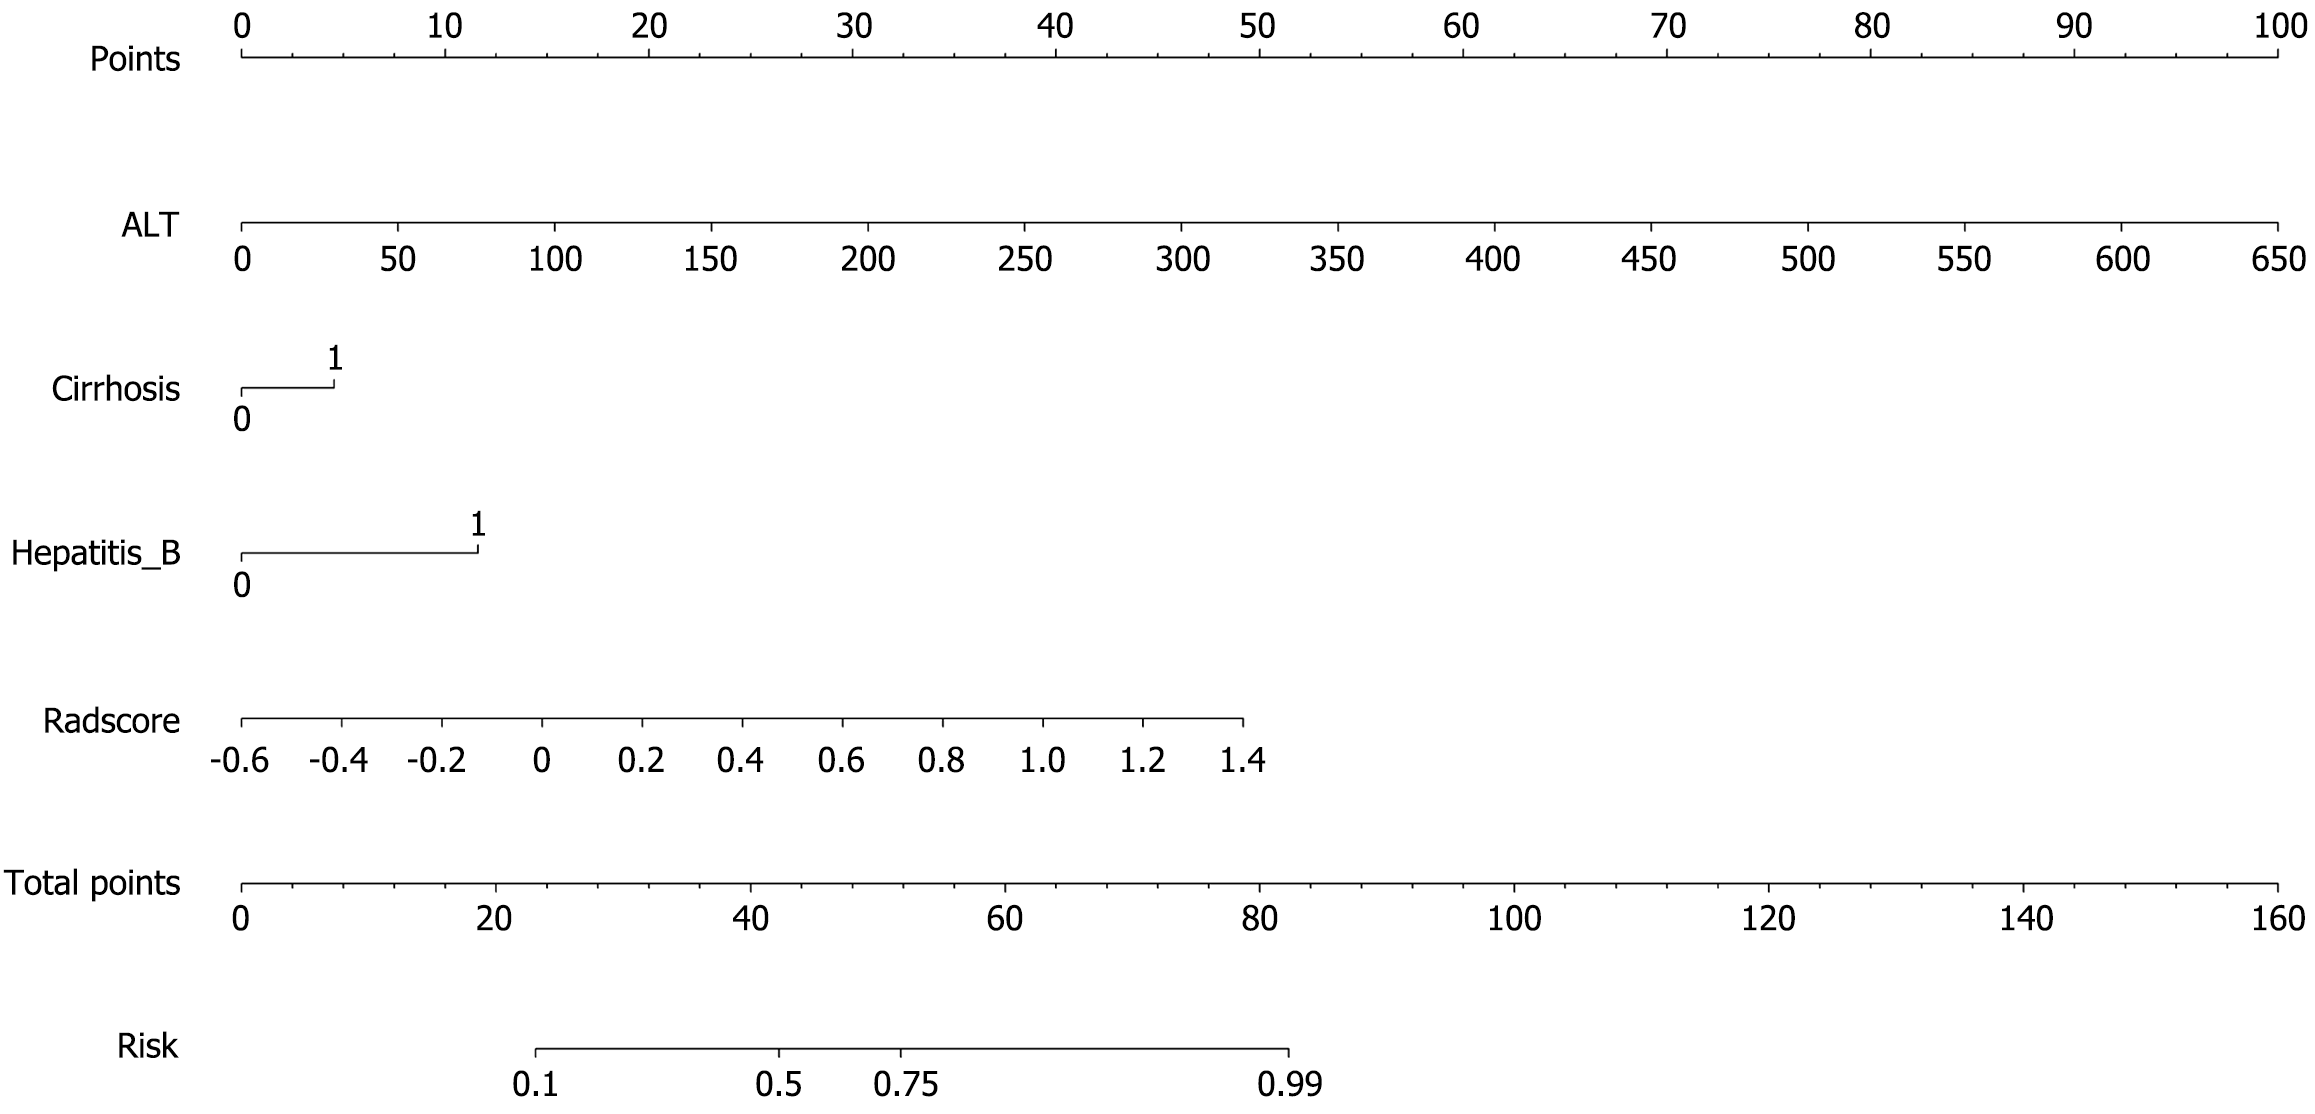
A combined clinical-radiomic nomogram was developed by integrating the Radscore from the fusion model with the clinical characteristics from the clinical model. This nomogram achieved an AUC of 0.848 (0.774-0.922) in the training group and 0.830 (0.710-0.951) in the validation group, demonstrating superior predictive performance compared with both the radiomic fusion model and the clinical model alone, as shown in Figures 6 and 7.
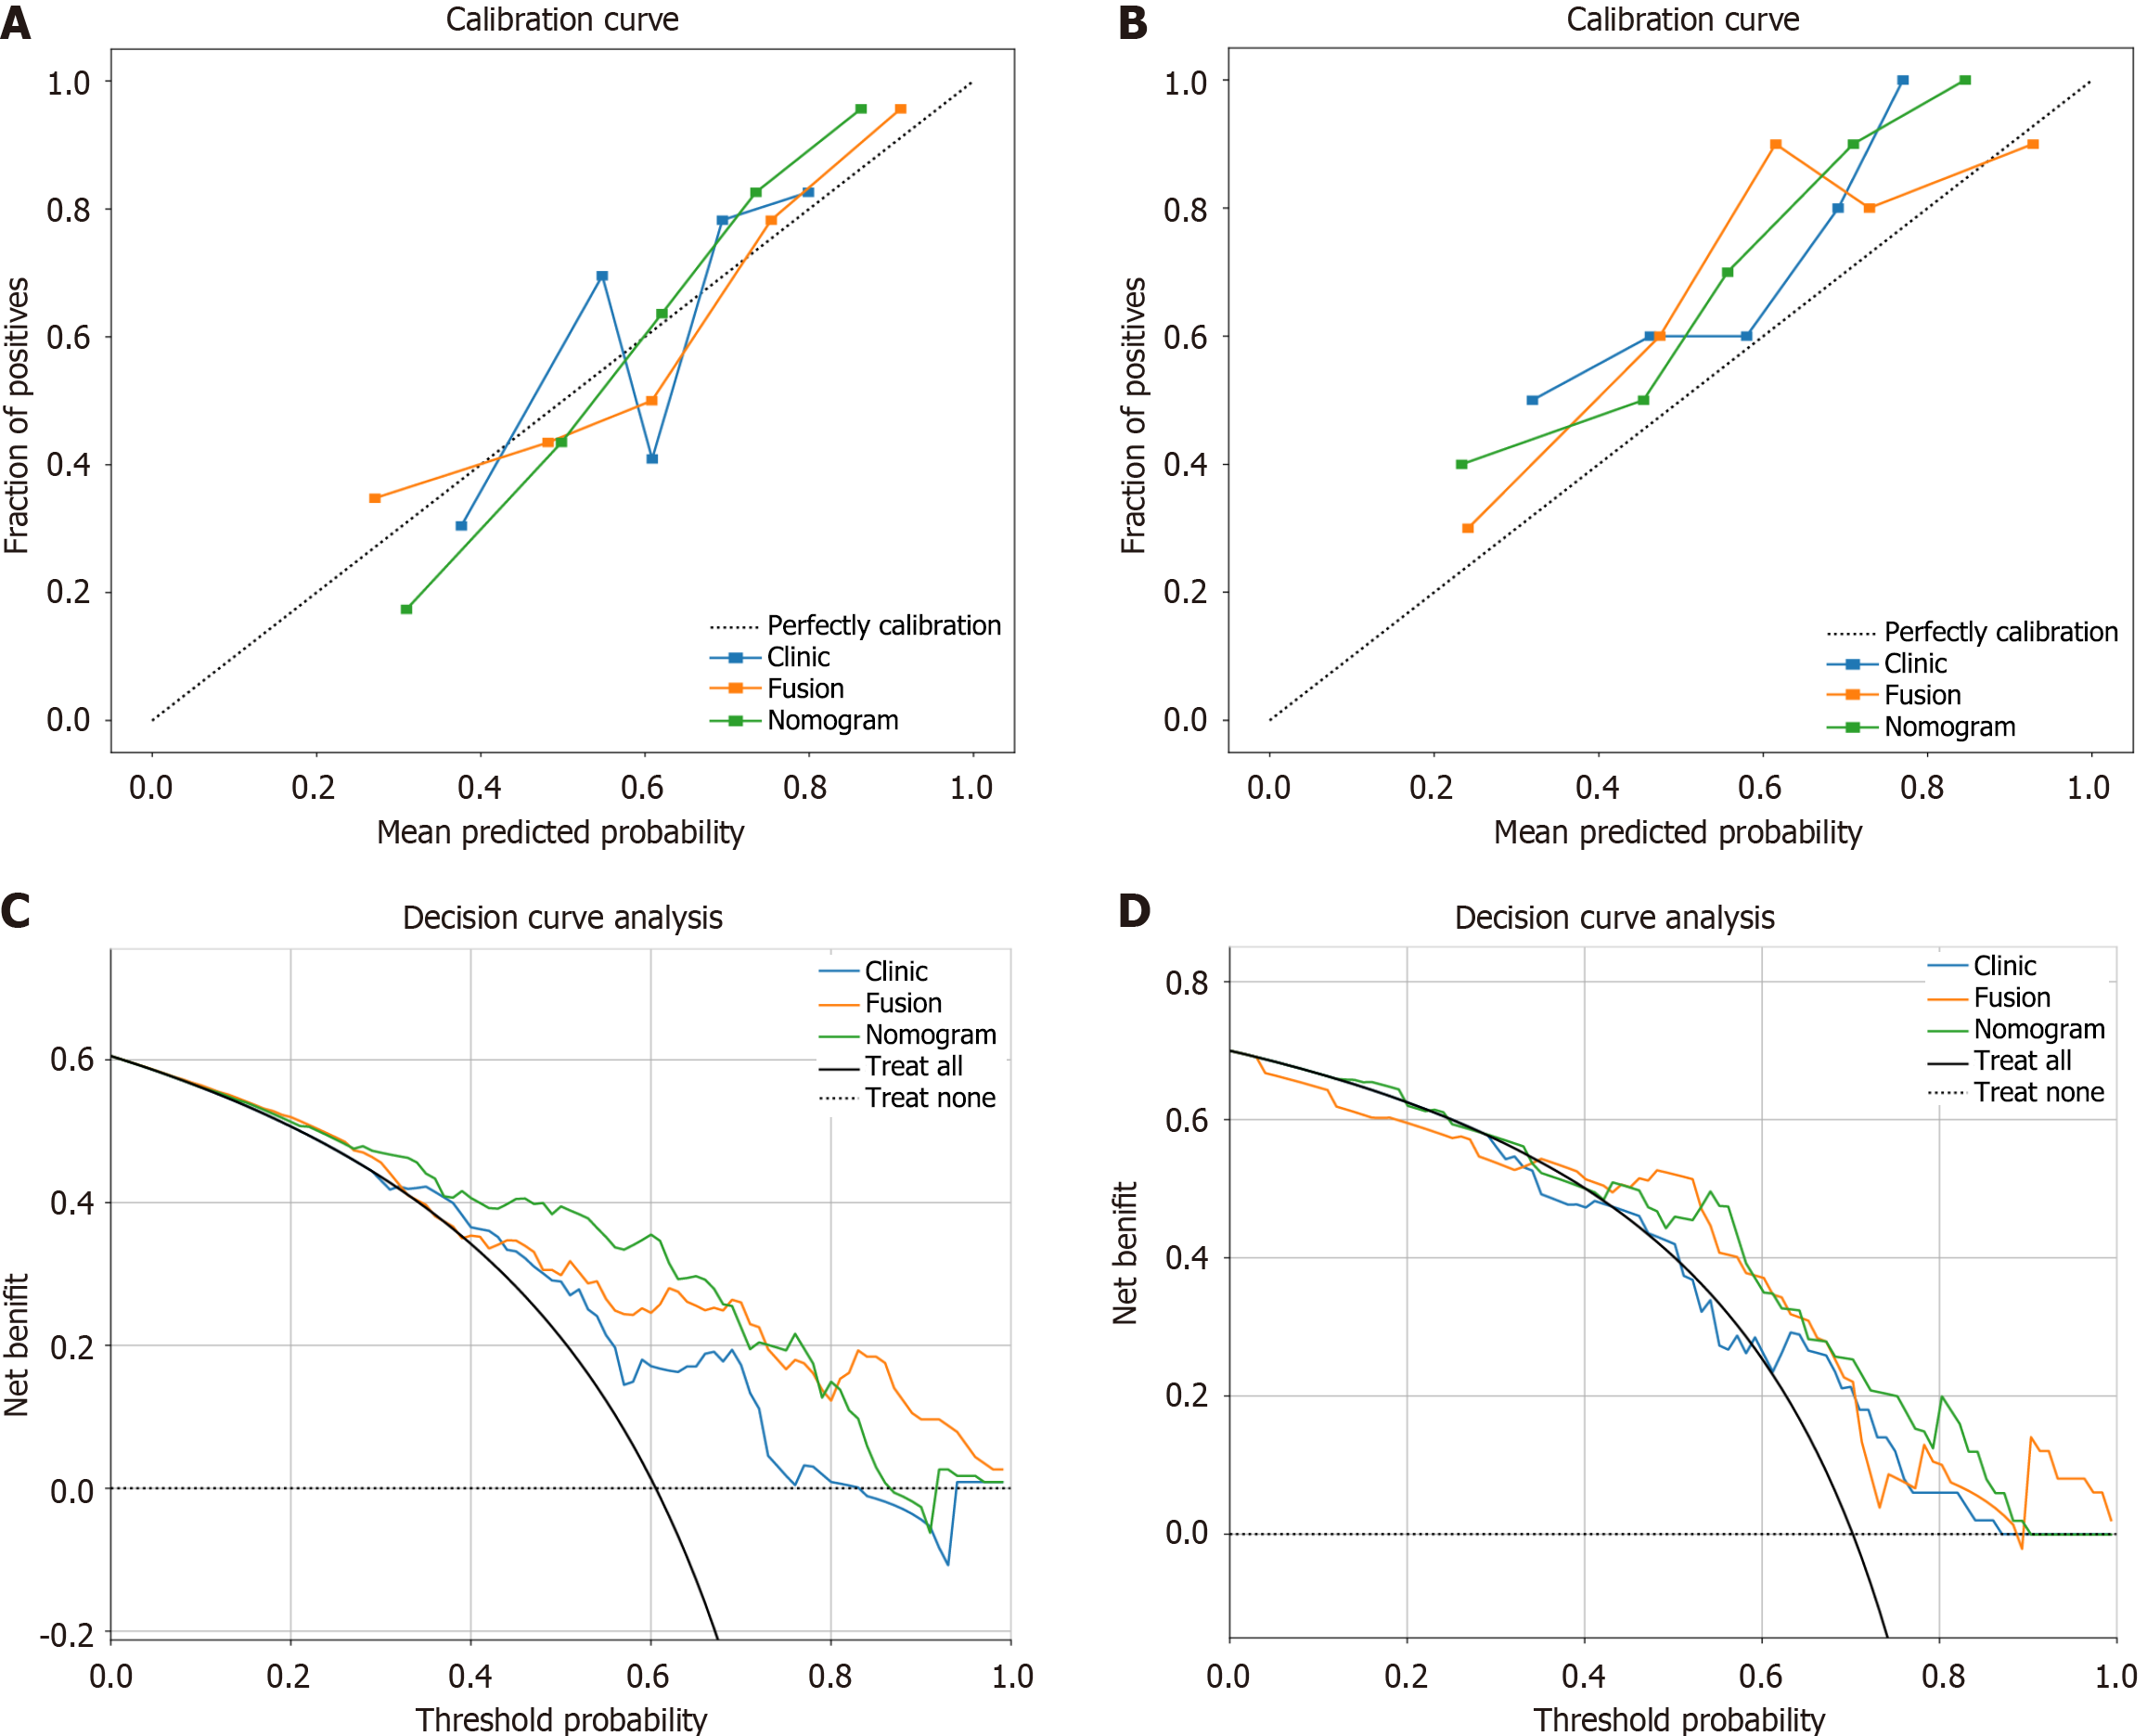
All the calibration curves diagrams and DCA for the training and validation groups of the three models are presented in Figure 8. The Hosmer-Lemeshow test revealed P values higher than 0.05 for all models (training group: P = 0.672, 0.570, and 0.339; validation group: P = 0.121, 0.202, and 0.109), suggesting good consistency between the predicted and actual Ki-67 expression. DCA demonstrated that the nomogram yielded a greater overall net benefit in assessing Ki-67 expression status than did the clinical model or the radiomic model alone.
To better promote personalized treatment and research into neoadjuvant therapies for HCC, we compared the predictive accuracy of radiomic models for intratumoral, peritumoral, and fusion regions and validated a clinical-radiomic nomogram combining the Radscore and clinical features to predict Ki-67 expression. Our results shown that the fusion model performed better than the intratumoral or peritumoral models alone in evaluating Ki-67 expression. The nomogram further enhanced the prediction accuracy and practical applicability in clinical settings.
HCC with high Ki-67 expression often has faster growth rates and greater invasiveness[20]. In our analysis of clinical factors, we found that elevated Ki-67 levels in patients with HCC were associated with hepatitis B virus infection, cirrhosis, and ALT. Previous studies have shown that hepatitis B virus infection and subsequent cirrhosis indicate a high risk for liver cancer[21]. Hepatitis B virus infection can promote liver cancer progression and invasion through interactions with the hepatitis B virus X protein[22]. A multicentre study involving 734 liver cancer patients demonstrated that cirrhosis is an independent risk factor for late-stage liver cancer recurrence[23]. ALT is a frequently used marker of chronic liver injury[24]. A prospective study by Suruki et al[25] in Japanese liver cancer patients revealed that elevated ALT levels predict liver cancer progression. Therefore, we believe that these markers should be carefully considered during the preoperative assessment of liver cancer. However, in the study by Ye et al[26], the serum alpha fetoprotein level was used as an indicator for predicting the Ki-67 expression level. However, serum alpha fetoprotein levels were excluded from the multivariate analysis in our study, which could be attributed to the different cut-off values used for high Ki-67 status.
In our study, although the intratumoral and peritumoral models achieved training group AUCs of 0.782 and 0.813, respectively, both of which exceeded the fusion model’s 0.780, their validation group AUCs were 0.703 and 0.716, respectively, both of which were lower than that of the fusion model (0.760). This discrepancy between the training and validation groups can be attributed to overfitting issues in the intratumoral and peritumoral models[27]. The development of the fusion model demonstrated that combining radiomic features from both inside and surrounding the tumor tissues for analysis can address this problem. Our findings also confirm that leveraging radiomic characteristics from the peritumoral region enhances model predictive power, which is consistent with previous research conclusions[28,29]. This is likely because liver cancer development is not only related to the tumour microenvironment but also closely linked to the peritumoral microenvironment (PME)[30]. In the PME, thymidine phosphorylase expression promotes angiogenesis through the mitogen-activated protein kinase 1 (extracellular signal-regulated kinase 2)/ribosomal S6 kinase 1/nuclear factor-kappaB pathway, thereby increasing HCC invasion[31]. Additionally, the secretion of serum amyloid A in this region promotes M2 polarization of macrophages, further promoting HCC progression[32]. Therefore, extracting radiomic features related to these enzymes and immune cells may provide an explanation for the improved prediction efficiency. Furthermore, our results suggest that for narrow-margin surgeries, adopting a wider margin approach may remove the PME along with the tumour, potentially diminishing the likelihood of postoperative recurrence and extending overall survival.
Previously, Qian et al[33] successfully developed a model based on ultrasound radiomic features of intratumoral and peritumoral regions to evaluate Ki-67 expression. However, ultrasound images can be highly dependent on operator experience. Different technicians and equipment settings introduce significant variability. Additionally, ultrasound usually provides 2D images, limiting the depth of analysis and the ability to fully capture tumour complexity. In contrast, CT images offer higher spatial resolution and a more comprehensive 3D spatial area, enabling more precise delineation of tumour boundaries and extraction of more radiomic features. In previous studies, Wu et al[15] extracted radiological features from ordinary-resolution CT images of tumour regions. Radiomic features were obtained through ICC, analysis of variance, Spearman correlation analysis, and gradient boosting decision tree screening, and a nomogram was constructed using these features and clinical features to assess the possibility of Ki-67 expression. The AUC of the validation group was 0.819. In our research, we extracted radiological features within and around the tumour from CT images reconstructed via superresolution, making feature extraction more comprehensive. In terms of feature selection, ICC, Pearson correlation analysis, t tests, and LASSO regression were used for screening, and different screening strategies were selected. The final constructed clinical-radiomic nomogram had an AUC of 0.830 in the validation group, indicating the superior evaluation ability for Ki-67 expression.
Although the outcomes seem positive, our study had a few limitations. Firstly, since this study was a single-centre retrospective one, the number of cases was extremely limited, which restricts the generalizability of our findings to other institutions. Future prospective multicentre trials with larger sample sizes are necessary. Furthermore, our analysis relied solely on characteristics extracted from CT images taken during the portal venous phase. However, the potential predictive capabilities of other phases and magnetic resonance imaging scans necessitate additional research. Moreover, we established the peritumoral zone as 3 mm on the basis of prior investigations. However, it is still uncertain whether this particular peritumoral region is the most advantageous region. Finally, at present, there is no universally accepted criterion for determining the ideal threshold value for high Ki-67 expression in liver cancer. Subsequent investigations are required to ascertain the most favourable threshold. Moreover, our study used only machine learning methods to construct predictive models, yet the use of deep learning methods for modelling may further improve the predictive ability of the model, thereby enhancing its clinical value.
we constructed and validated a machine learning model that combines intratumoral and peritumoral radiomic features derived from preoperative enhanced CT images reconstructed via superresolution with clinical features to predict Ki-67 expression. Our findings underscore the potential of this model to enhance personalized treatment strategies for HCC patients and contribute to neoadjuvant therapy research in liver cancer.
Thanks for the technical support provided by Onekey platform.
| 1. | Llovet JM, Kelley RK, Villanueva A, Singal AG, Pikarsky E, Roayaie S, Lencioni R, Koike K, Zucman-Rossi J, Finn RS. Hepatocellular carcinoma. Nat Rev Dis Primers. 2021;7:6. [RCA] [PubMed] [DOI] [Full Text] [Cited by in Crossref: 4432] [Cited by in RCA: 3883] [Article Influence: 970.8] [Reference Citation Analysis (3)] |
| 2. | Akateh C, Black SM, Conteh L, Miller ED, Noonan A, Elliott E, Pawlik TM, Tsung A, Cloyd JM. Neoadjuvant and adjuvant treatment strategies for hepatocellular carcinoma. World J Gastroenterol. 2019;25:3704-3721. [RCA] [PubMed] [DOI] [Full Text] [Full Text (PDF)] [Cited by in CrossRef: 89] [Cited by in RCA: 112] [Article Influence: 18.7] [Reference Citation Analysis (0)] |
| 3. | Lei HJ, Wang SY, Chau IY, Li AF, Chau YP, Hsia CY, Chou SC, Kao YC, Chau GY. Hepatoma upregulated protein and Ki-67 expression in resectable hepatocellular carcinoma. J Chin Med Assoc. 2021;84:623-632. [RCA] [PubMed] [DOI] [Full Text] [Cited by in Crossref: 1] [Reference Citation Analysis (0)] |
| 4. | Cao Y, Ke R, Wang S, Zhu X, Chen J, Huang C, Jiang Y, Lv L. DNA topoisomerase IIα and Ki67 are prognostic factors in patients with hepatocellular carcinoma. Oncol Lett. 2017;13:4109-4116. [RCA] [PubMed] [DOI] [Full Text] [Full Text (PDF)] [Cited by in Crossref: 11] [Cited by in RCA: 33] [Article Influence: 4.1] [Reference Citation Analysis (0)] |
| 5. | Li HH, Qi LN, Ma L, Chen ZS, Xiang BD, Li LQ. Effect of KI-67 positive cellular index on prognosis after hepatectomy in Barcelona Clinic Liver Cancer stage A and B hepatocellular carcinoma with microvascular invasion. Onco Targets Ther. 2018;11:4747-4754. [RCA] [PubMed] [DOI] [Full Text] [Full Text (PDF)] [Cited by in Crossref: 9] [Cited by in RCA: 30] [Article Influence: 4.3] [Reference Citation Analysis (0)] |
| 6. | Zhao YF, Xiong X, Chen K, Tang W, Yang X, Shi ZR. Evaluation of the Therapeutic Effect of Adjuvant Transcatheter Arterial Chemoembolization Based on Ki67 After Hepatocellular Carcinoma Surgery. Front Oncol. 2021;11:605234. [RCA] [PubMed] [DOI] [Full Text] [Full Text (PDF)] [Cited by in Crossref: 4] [Cited by in RCA: 11] [Article Influence: 2.8] [Reference Citation Analysis (0)] |
| 7. | Calderaro J, Seraphin TP, Luedde T, Simon TG. Artificial intelligence for the prevention and clinical management of hepatocellular carcinoma. J Hepatol. 2022;76:1348-1361. [RCA] [PubMed] [DOI] [Full Text] [Cited by in Crossref: 19] [Cited by in RCA: 139] [Article Influence: 46.3] [Reference Citation Analysis (0)] |
| 8. | Zhang D, Zhang XY, Lu WW, Liao JT, Zhang CX, Tang Q, Cui XW. Predicting Ki-67 expression in hepatocellular carcinoma: nomogram based on clinical factors and contrast-enhanced ultrasound radiomics signatures. Abdom Radiol (NY). 2024;49:1419-1431. [RCA] [PubMed] [DOI] [Full Text] [Reference Citation Analysis (0)] |
| 9. | Gong XQ, Liu N, Tao YY, Li L, Li ZM, Yang L, Zhang XM. Radiomics models based on multisequence MRI for predicting PD-1/PD-L1 expression in hepatocellular carcinoma. Sci Rep. 2023;13:7710. [RCA] [PubMed] [DOI] [Full Text] [Full Text (PDF)] [Cited by in Crossref: 23] [Cited by in RCA: 22] [Article Influence: 11.0] [Reference Citation Analysis (0)] |
| 10. | Xu X, Zhang HL, Liu QP, Sun SW, Zhang J, Zhu FP, Yang G, Yan X, Zhang YD, Liu XS. Radiomic analysis of contrast-enhanced CT predicts microvascular invasion and outcome in hepatocellular carcinoma. J Hepatol. 2019;70:1133-1144. [RCA] [PubMed] [DOI] [Full Text] [Cited by in Crossref: 278] [Cited by in RCA: 495] [Article Influence: 82.5] [Reference Citation Analysis (0)] |
| 11. | Liu Z, Mi M, Li X, Zheng X, Wu G, Zhang L. A lncRNA prognostic signature associated with immune infiltration and tumour mutation burden in breast cancer. J Cell Mol Med. 2020;24:12444-12456. [RCA] [PubMed] [DOI] [Full Text] [Full Text (PDF)] [Cited by in Crossref: 24] [Cited by in RCA: 87] [Article Influence: 17.4] [Reference Citation Analysis (0)] |
| 12. | Uematsu T. Focal breast edema associated with malignancy on T2-weighted images of breast MRI: peritumoral edema, prepectoral edema, and subcutaneous edema. Breast Cancer. 2015;22:66-70. [RCA] [PubMed] [DOI] [Full Text] [Cited by in Crossref: 59] [Cited by in RCA: 100] [Article Influence: 9.1] [Reference Citation Analysis (0)] |
| 13. | Qian H, Huang Y, Xu L, Fu H, Lu B. Role of peritumoral tissue analysis in predicting characteristics of hepatocellular carcinoma using ultrasound-based radiomics. Sci Rep. 2024;14:11538. [RCA] [PubMed] [DOI] [Full Text] [Reference Citation Analysis (0)] |
| 14. | Wu H, Han X, Wang Z, Mo L, Liu W, Guo Y, Wei X, Jiang X. Prediction of the Ki-67 marker index in hepatocellular carcinoma based on CT radiomics features. Phys Med Biol. 2020;65:235048. [RCA] [PubMed] [DOI] [Full Text] [Cited by in Crossref: 8] [Cited by in RCA: 32] [Article Influence: 6.4] [Reference Citation Analysis (0)] |
| 15. | Wu C, Chen J, Fan Y, Zhao M, He X, Wei Y, Ge W, Liu Y. Nomogram Based on CT Radiomics Features Combined With Clinical Factors to Predict Ki-67 Expression in Hepatocellular Carcinoma. Front Oncol. 2022;12:943942. [RCA] [PubMed] [DOI] [Full Text] [Full Text (PDF)] [Cited by in RCA: 18] [Reference Citation Analysis (0)] |
| 16. | Fan M, Liu Z, Xu M, Wang S, Zeng T, Gao X, Li L. Generative adversarial network-based super-resolution of diffusion-weighted imaging: Application to tumour radiomics in breast cancer. NMR Biomed. 2020;33:e4345. [RCA] [PubMed] [DOI] [Full Text] [Cited by in Crossref: 10] [Cited by in RCA: 24] [Article Influence: 4.8] [Reference Citation Analysis (0)] |
| 17. | Xu Y, Li Z, Yang Y, Li L, Zhou Y, Ouyang J, Huang Z, Wang S, Xie L, Ye F, Zhou J, Ying J, Zhao H, Zhao X. A CT-based radiomics approach to predict intra-tumoral tertiary lymphoid structures and recurrence of intrahepatic cholangiocarcinoma. Insights Imaging. 2023;14:173. [RCA] [PubMed] [DOI] [Full Text] [Cited by in RCA: 15] [Reference Citation Analysis (0)] |
| 18. | Zhao H, Feng Z, Li H, Yao S, Zheng W, Rong P. Influence of different region of interest sizes on CT-based radiomics model for microvascular invasion prediction in hepatocellular carcinoma. Zhong Nan Da Xue Xue Bao Yi Xue Ban. 2022;47:1049-1057. [RCA] [PubMed] [DOI] [Full Text] [Cited by in RCA: 1] [Reference Citation Analysis (0)] |
| 19. | Kramer AA, Zimmerman JE. Assessing the calibration of mortality benchmarks in critical care: The Hosmer-Lemeshow test revisited. Crit Care Med. 2007;35:2052-2056. [RCA] [PubMed] [DOI] [Full Text] [Cited by in Crossref: 476] [Cited by in RCA: 637] [Article Influence: 35.4] [Reference Citation Analysis (0)] |
| 20. | Schmilovitz-Weiss H, Tobar A, Halpern M, Levy I, Shabtai E, Ben-Ari Z. Tissue expression of squamous cellular carcinoma antigen and Ki67 in hepatocellular carcinoma-correlation with prognosis: a historical prospective study. Diagn Pathol. 2011;6:121. [RCA] [PubMed] [DOI] [Full Text] [Full Text (PDF)] [Cited by in Crossref: 36] [Cited by in RCA: 48] [Article Influence: 3.4] [Reference Citation Analysis (0)] |
| 21. | Jia L, Gao Y, He Y, Hooper JD, Yang P. HBV induced hepatocellular carcinoma and related potential immunotherapy. Pharmacol Res. 2020;159:104992. [RCA] [PubMed] [DOI] [Full Text] [Cited by in Crossref: 29] [Cited by in RCA: 77] [Article Influence: 15.4] [Reference Citation Analysis (0)] |
| 22. | Son J, Kim MJ, Lee JS, Kim JY, Chun E, Lee KY. Hepatitis B virus X Protein Promotes Liver Cancer Progression through Autophagy Induction in Response to TLR4 Stimulation. Immune Netw. 2021;21:e37. [RCA] [PubMed] [DOI] [Full Text] [Full Text (PDF)] [Cited by in Crossref: 6] [Cited by in RCA: 24] [Article Influence: 6.0] [Reference Citation Analysis (0)] |
| 23. | Xu XF, Xing H, Han J, Li ZL, Lau WY, Zhou YH, Gu WM, Wang H, Chen TH, Zeng YY, Li C, Wu MC, Shen F, Yang T. Risk Factors, Patterns, and Outcomes of Late Recurrence After Liver Resection for Hepatocellular Carcinoma: A Multicenter Study From China. JAMA Surg. 2019;154:209-217. [RCA] [PubMed] [DOI] [Full Text] [Cited by in Crossref: 375] [Cited by in RCA: 395] [Article Influence: 65.8] [Reference Citation Analysis (0)] |
| 24. | Zelman S, Wang CC. Transaminases in serum and liver correlated with liver cell necrosis in needle aspiration biopsies. Am J Med Sci. 1959;237:323-334. [RCA] [PubMed] [DOI] [Full Text] [Cited by in Crossref: 32] [Cited by in RCA: 32] [Article Influence: 0.5] [Reference Citation Analysis (0)] |
| 25. | Suruki R, Hayashi K, Kusumoto K, Uto H, Ido A, Tsubouchi H, Stuver SO. Alanine aminotransferase level as a predictor of hepatitis C virus-associated hepatocellular carcinoma incidence in a community-based population in Japan. Int J Cancer. 2006;119:192-195. [RCA] [PubMed] [DOI] [Full Text] [Cited by in Crossref: 24] [Cited by in RCA: 27] [Article Influence: 1.4] [Reference Citation Analysis (0)] |
| 26. | Ye Z, Jiang H, Chen J, Liu X, Wei Y, Xia C, Duan T, Cao L, Zhang Z, Song B. Texture analysis on gadoxetic acid enhanced-MRI for predicting Ki-67 status in hepatocellular carcinoma: A prospective study. Chin J Cancer Res. 2019;31:806-817. [RCA] [PubMed] [DOI] [Full Text] [Full Text (PDF)] [Cited by in Crossref: 21] [Cited by in RCA: 35] [Article Influence: 5.8] [Reference Citation Analysis (0)] |
| 27. | Fusco R, Granata V, Grazzini G, Pradella S, Borgheresi A, Bruno A, Palumbo P, Bruno F, Grassi R, Giovagnoni A, Grassi R, Miele V, Barile A. Radiomics in medical imaging: pitfalls and challenges in clinical management. Jpn J Radiol. 2022;40:919-929. [RCA] [PubMed] [DOI] [Full Text] [Cited by in Crossref: 1] [Cited by in RCA: 43] [Article Influence: 14.3] [Reference Citation Analysis (0)] |
| 28. | Liao H, Jiang H, Chen Y, Duan T, Yang T, Han M, Xue Z, Shi F, Yuan K, Bashir MR, Shen D, Song B, Zeng Y. Predicting Genomic Alterations of Phosphatidylinositol-3 Kinase Signaling in Hepatocellular Carcinoma: A Radiogenomics Study Based on Next-Generation Sequencing and Contrast-Enhanced CT. Ann Surg Oncol. 2022;. [RCA] [PubMed] [DOI] [Full Text] [Cited by in Crossref: 2] [Cited by in RCA: 2] [Article Influence: 0.7] [Reference Citation Analysis (0)] |
| 29. | Yang Y, Fan W, Gu T, Yu L, Chen H, Lv Y, Liu H, Wang G, Zhang D. Radiomic Features of Multi-ROI and Multi-Phase MRI for the Prediction of Microvascular Invasion in Solitary Hepatocellular Carcinoma. Front Oncol. 2021;11:756216. [RCA] [PubMed] [DOI] [Full Text] [Full Text (PDF)] [Cited by in Crossref: 4] [Cited by in RCA: 17] [Article Influence: 4.3] [Reference Citation Analysis (0)] |
| 30. | Zhang Y, Yang C, Sheng R, Dai Y, Zeng M. Predicting the recurrence of hepatocellular carcinoma (≤ 5 cm) after resection surgery with promising risk factors: habitat fraction of tumor and its peritumoral micro-environment. Radiol Med. 2023;128:1181-1191. [RCA] [PubMed] [DOI] [Full Text] [Cited by in Crossref: 4] [Cited by in RCA: 16] [Article Influence: 8.0] [Reference Citation Analysis (0)] |
| 31. | Gu Y, Guo Y, Gao N, Fang Y, Xu C, Hu G, Guo M, Ma Y, Zhang Y, Zhou J, Luo Y, Zhang H, Wen Q, Qiao H. The proteomic characterization of the peritumor microenvironment in human hepatocellular carcinoma. Oncogene. 2022;41:2480-2491. [RCA] [PubMed] [DOI] [Full Text] [Full Text (PDF)] [Cited by in Crossref: 1] [Cited by in RCA: 27] [Article Influence: 9.0] [Reference Citation Analysis (0)] |
| 32. | Wu L, Yan J, Bai Y, Chen F, Zou X, Xu J, Huang A, Hou L, Zhong Y, Jing Z, Yu Q, Zhou X, Jiang Z, Wang C, Cheng M, Ji Y, Hou Y, Luo R, Li Q, Wu L, Cheng J, Wang P, Guo D, Huang W, Lei J, Liu S, Yan Y, Chen Y, Liao S, Li Y, Sun H, Yao N, Zhang X, Zhang S, Chen X, Yu Y, Li Y, Liu F, Wang Z, Zhou S, Yang H, Yang S, Xu X, Liu L, Gao Q, Tang Z, Wang X, Wang J, Fan J, Liu S, Yang X, Chen A, Zhou J. An invasive zone in human liver cancer identified by Stereo-seq promotes hepatocyte-tumor cell crosstalk, local immunosuppression and tumor progression. Cell Res. 2023;33:585-603. [RCA] [PubMed] [DOI] [Full Text] [Full Text (PDF)] [Cited by in Crossref: 95] [Cited by in RCA: 102] [Article Influence: 51.0] [Reference Citation Analysis (0)] |
| 33. | Qian H, Shen Z, Zhou D, Huang Y. Intratumoral and peritumoral radiomics model based on abdominal ultrasound for predicting Ki-67 expression in patients with hepatocellular cancer. Front Oncol. 2023;13:1209111. [RCA] [PubMed] [DOI] [Full Text] [Reference Citation Analysis (0)] |


