Copyright
©The Author(s) 2025.
World J Gastrointest Oncol. May 15, 2025; 17(5): 104172
Published online May 15, 2025. doi: 10.4251/wjgo.v17.i5.104172
Published online May 15, 2025. doi: 10.4251/wjgo.v17.i5.104172
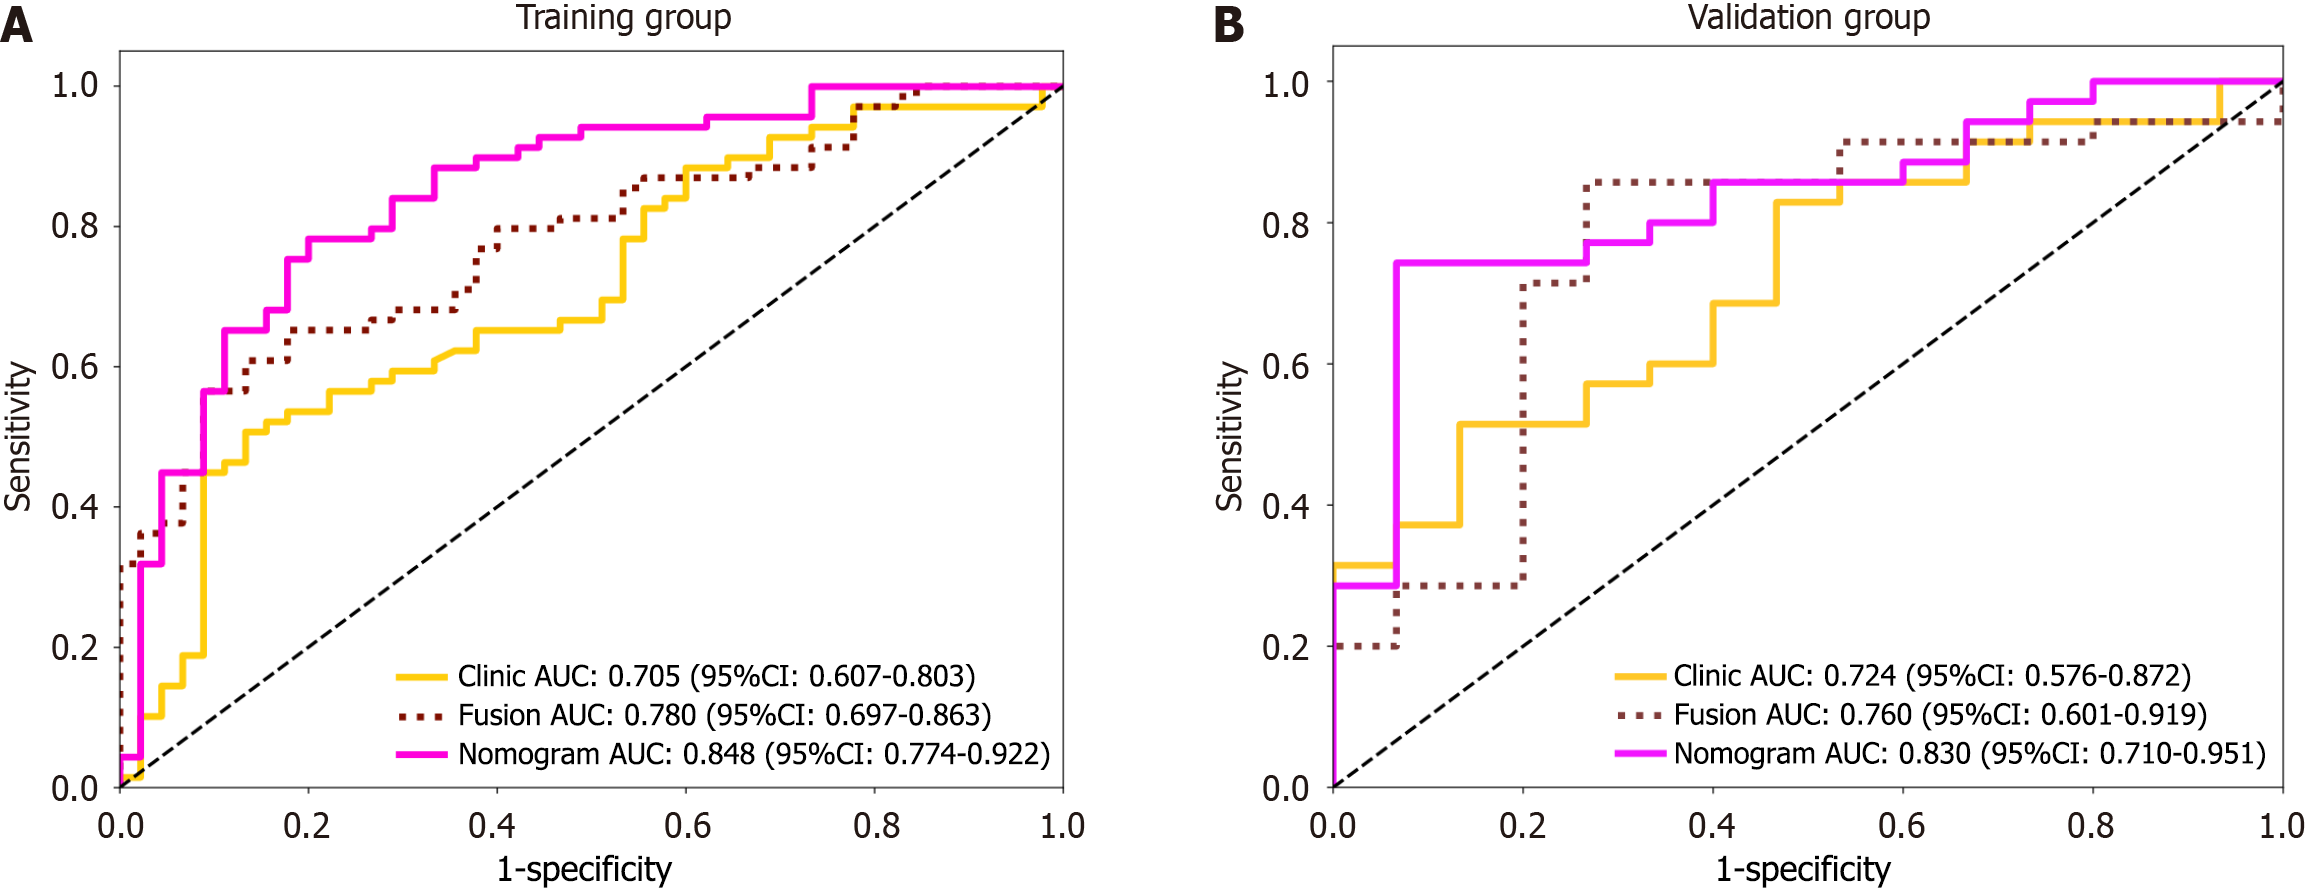
Figure 6 The receiver operating characteristic curve shows the performance of the different models in predicting Ki-67 expression.
A: Receiver operating characteristic curve comparison of the training group for the three models; B: Receiver operating characteristic curve comparison of the validation group for the three models. AUC: Area under the receiver operating characteristic curve; CI: Confidence interval.
- Citation: Zhu ZW, Wu J, Guo Y, Ren QY, Li DN, Li ZY, Han L. Prediction of Ki-67 expression in hepatocellular carcinoma with machine learning models based on intratumoral and peritumoral radiomic features. World J Gastrointest Oncol 2025; 17(5): 104172
- URL: https://www.wjgnet.com/1948-5204/full/v17/i5/104172.htm
- DOI: https://dx.doi.org/10.4251/wjgo.v17.i5.104172


