
















Copyright: ©Author(s) 2026.
World J Gastrointest Oncol. Oct 15, 2026; 18(10): 121843
Published online Oct 15, 2026. doi: 10.4251/wjgo.121843
Published online Oct 15, 2026. doi: 10.4251/wjgo.121843
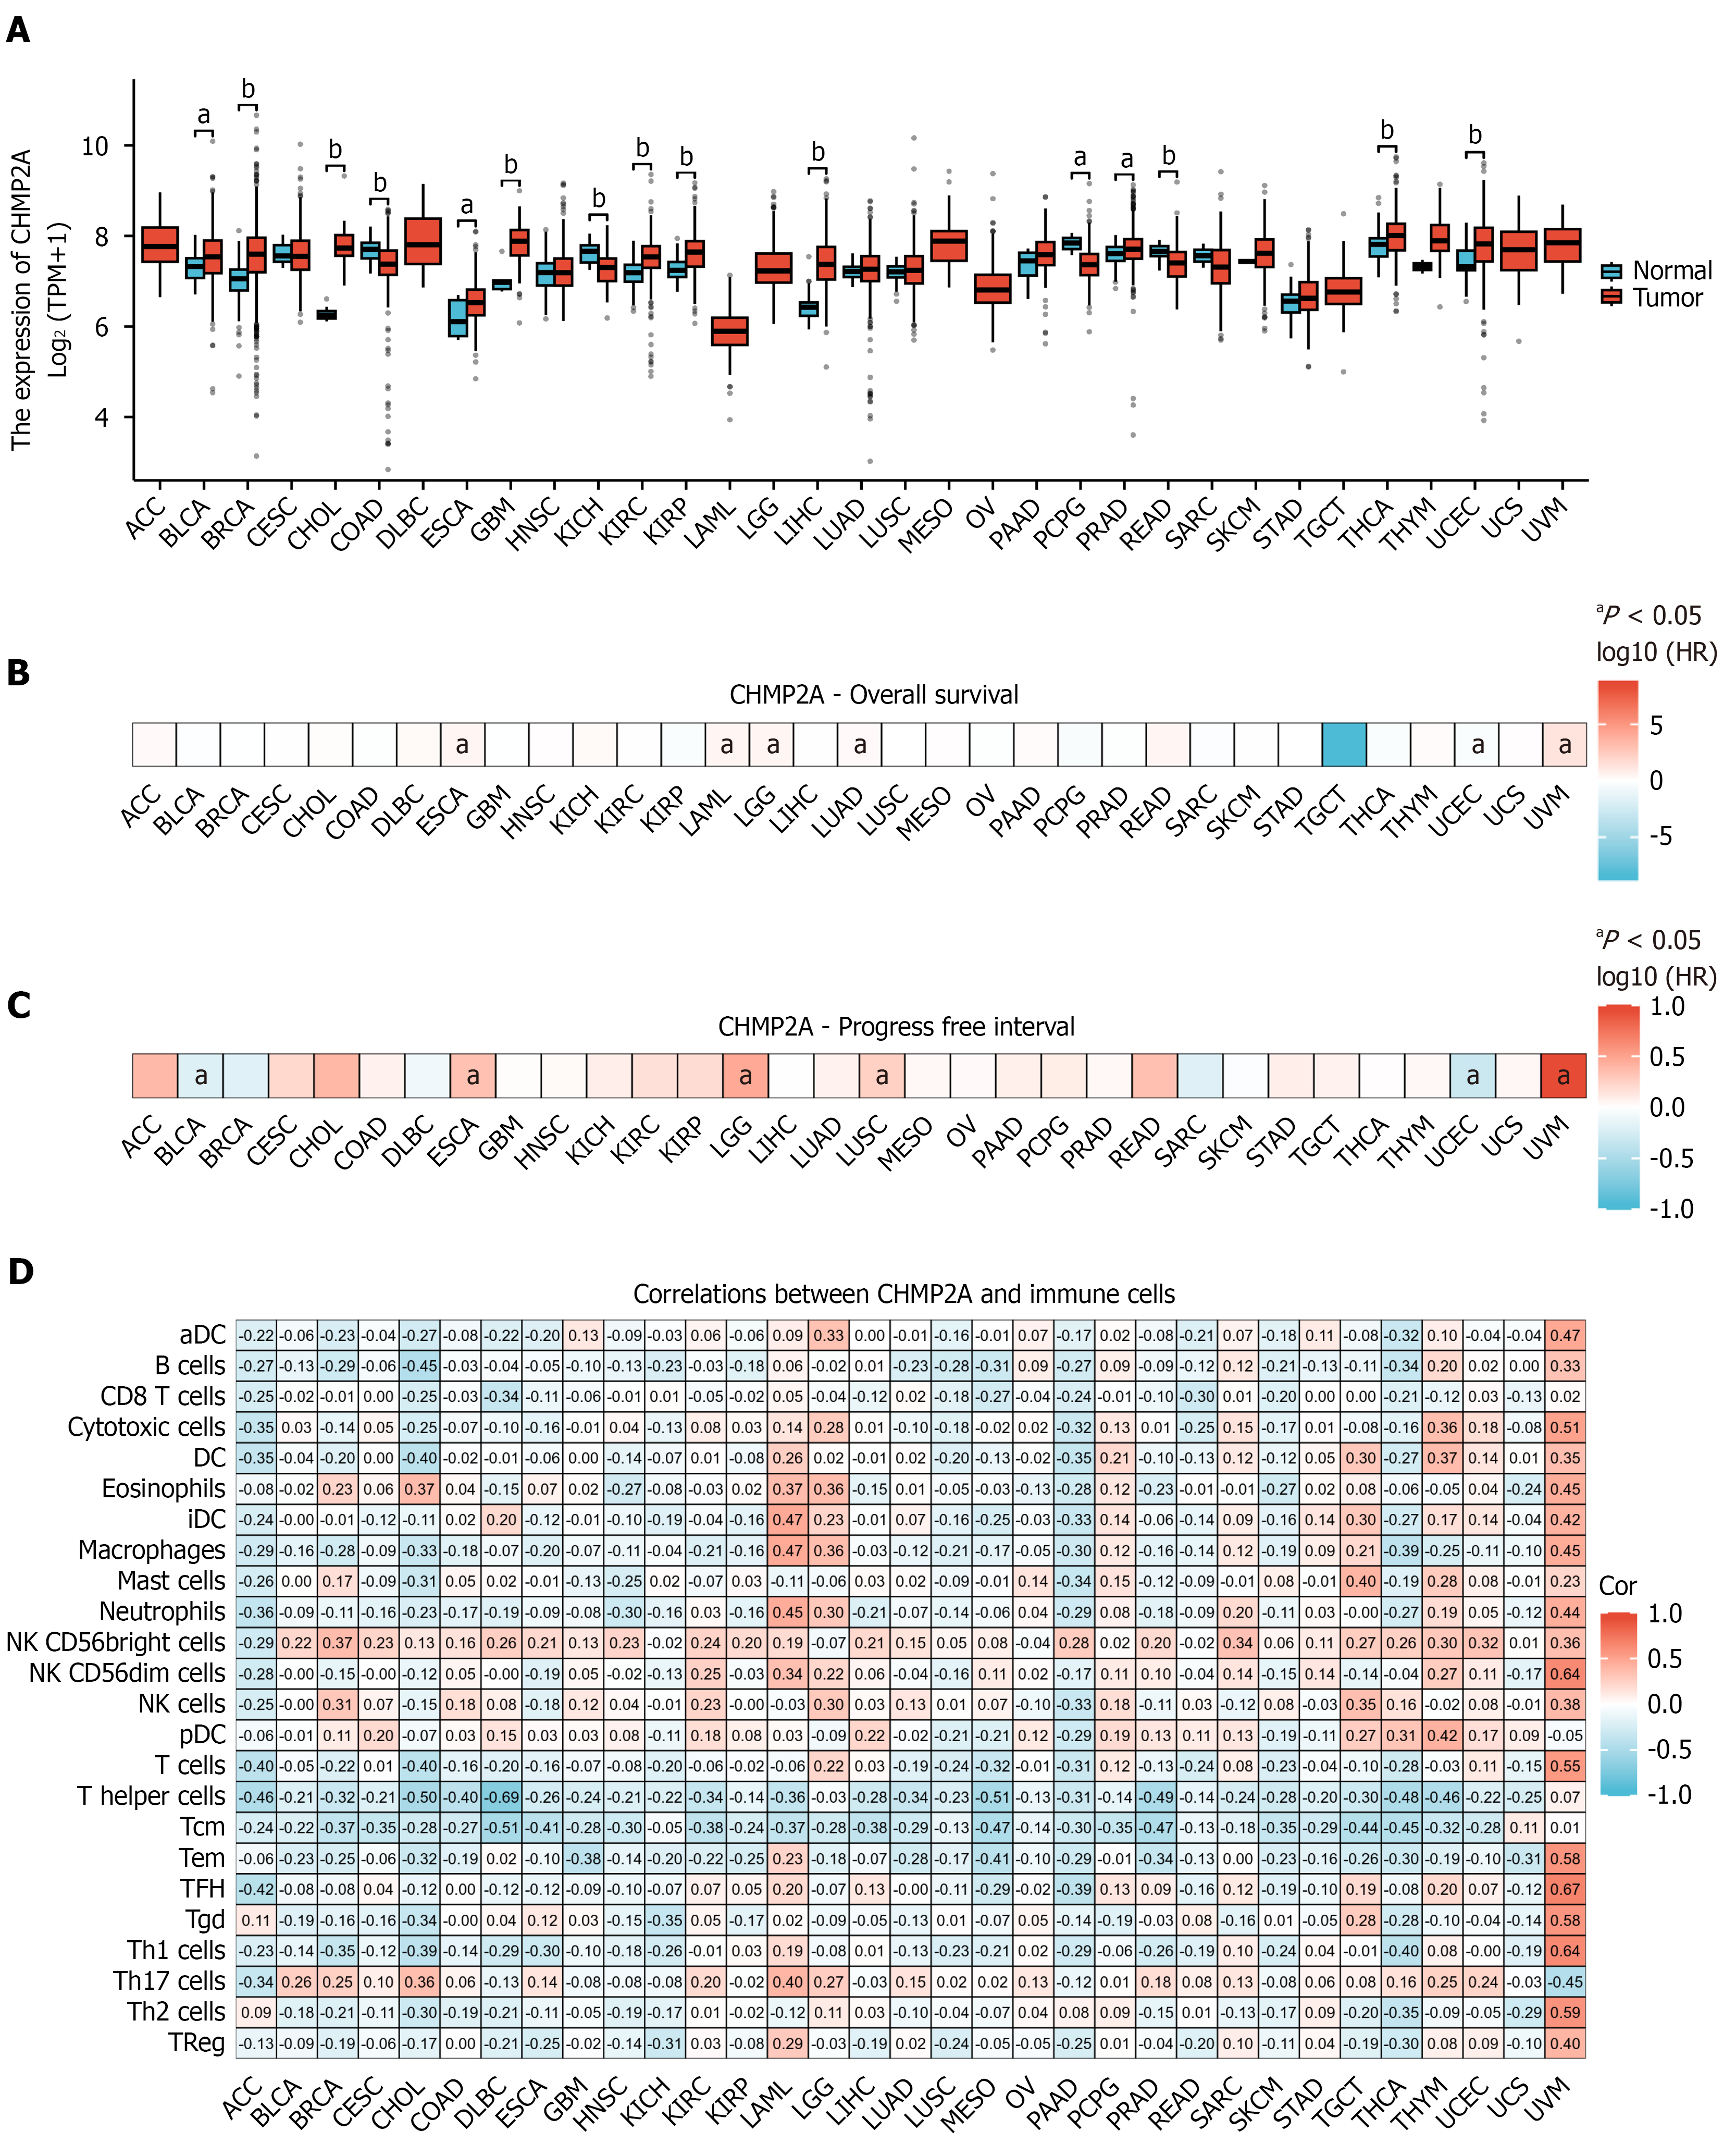
Figure 1 CHMP2A expression is significantly upregulated in multiple tumor types and correlates with the level of immune cell infiltration.
A: CHMP2A mRNA levels across different cancer types from The Cancer Genome Atlas data; B and C: Correlation analysis of CHMP2A mRNA with overall survival and progression-free interval in tumor patients; D: Correlation between CHMP2A expression levels and the degree of immune cell infiltration. The numbers in the heatmap represent the corresponding P values of the correlation analysis. aP < 0.05; bP <0.01. TPM: Transcripts per million; ESCA: Esophageal carcinoma.
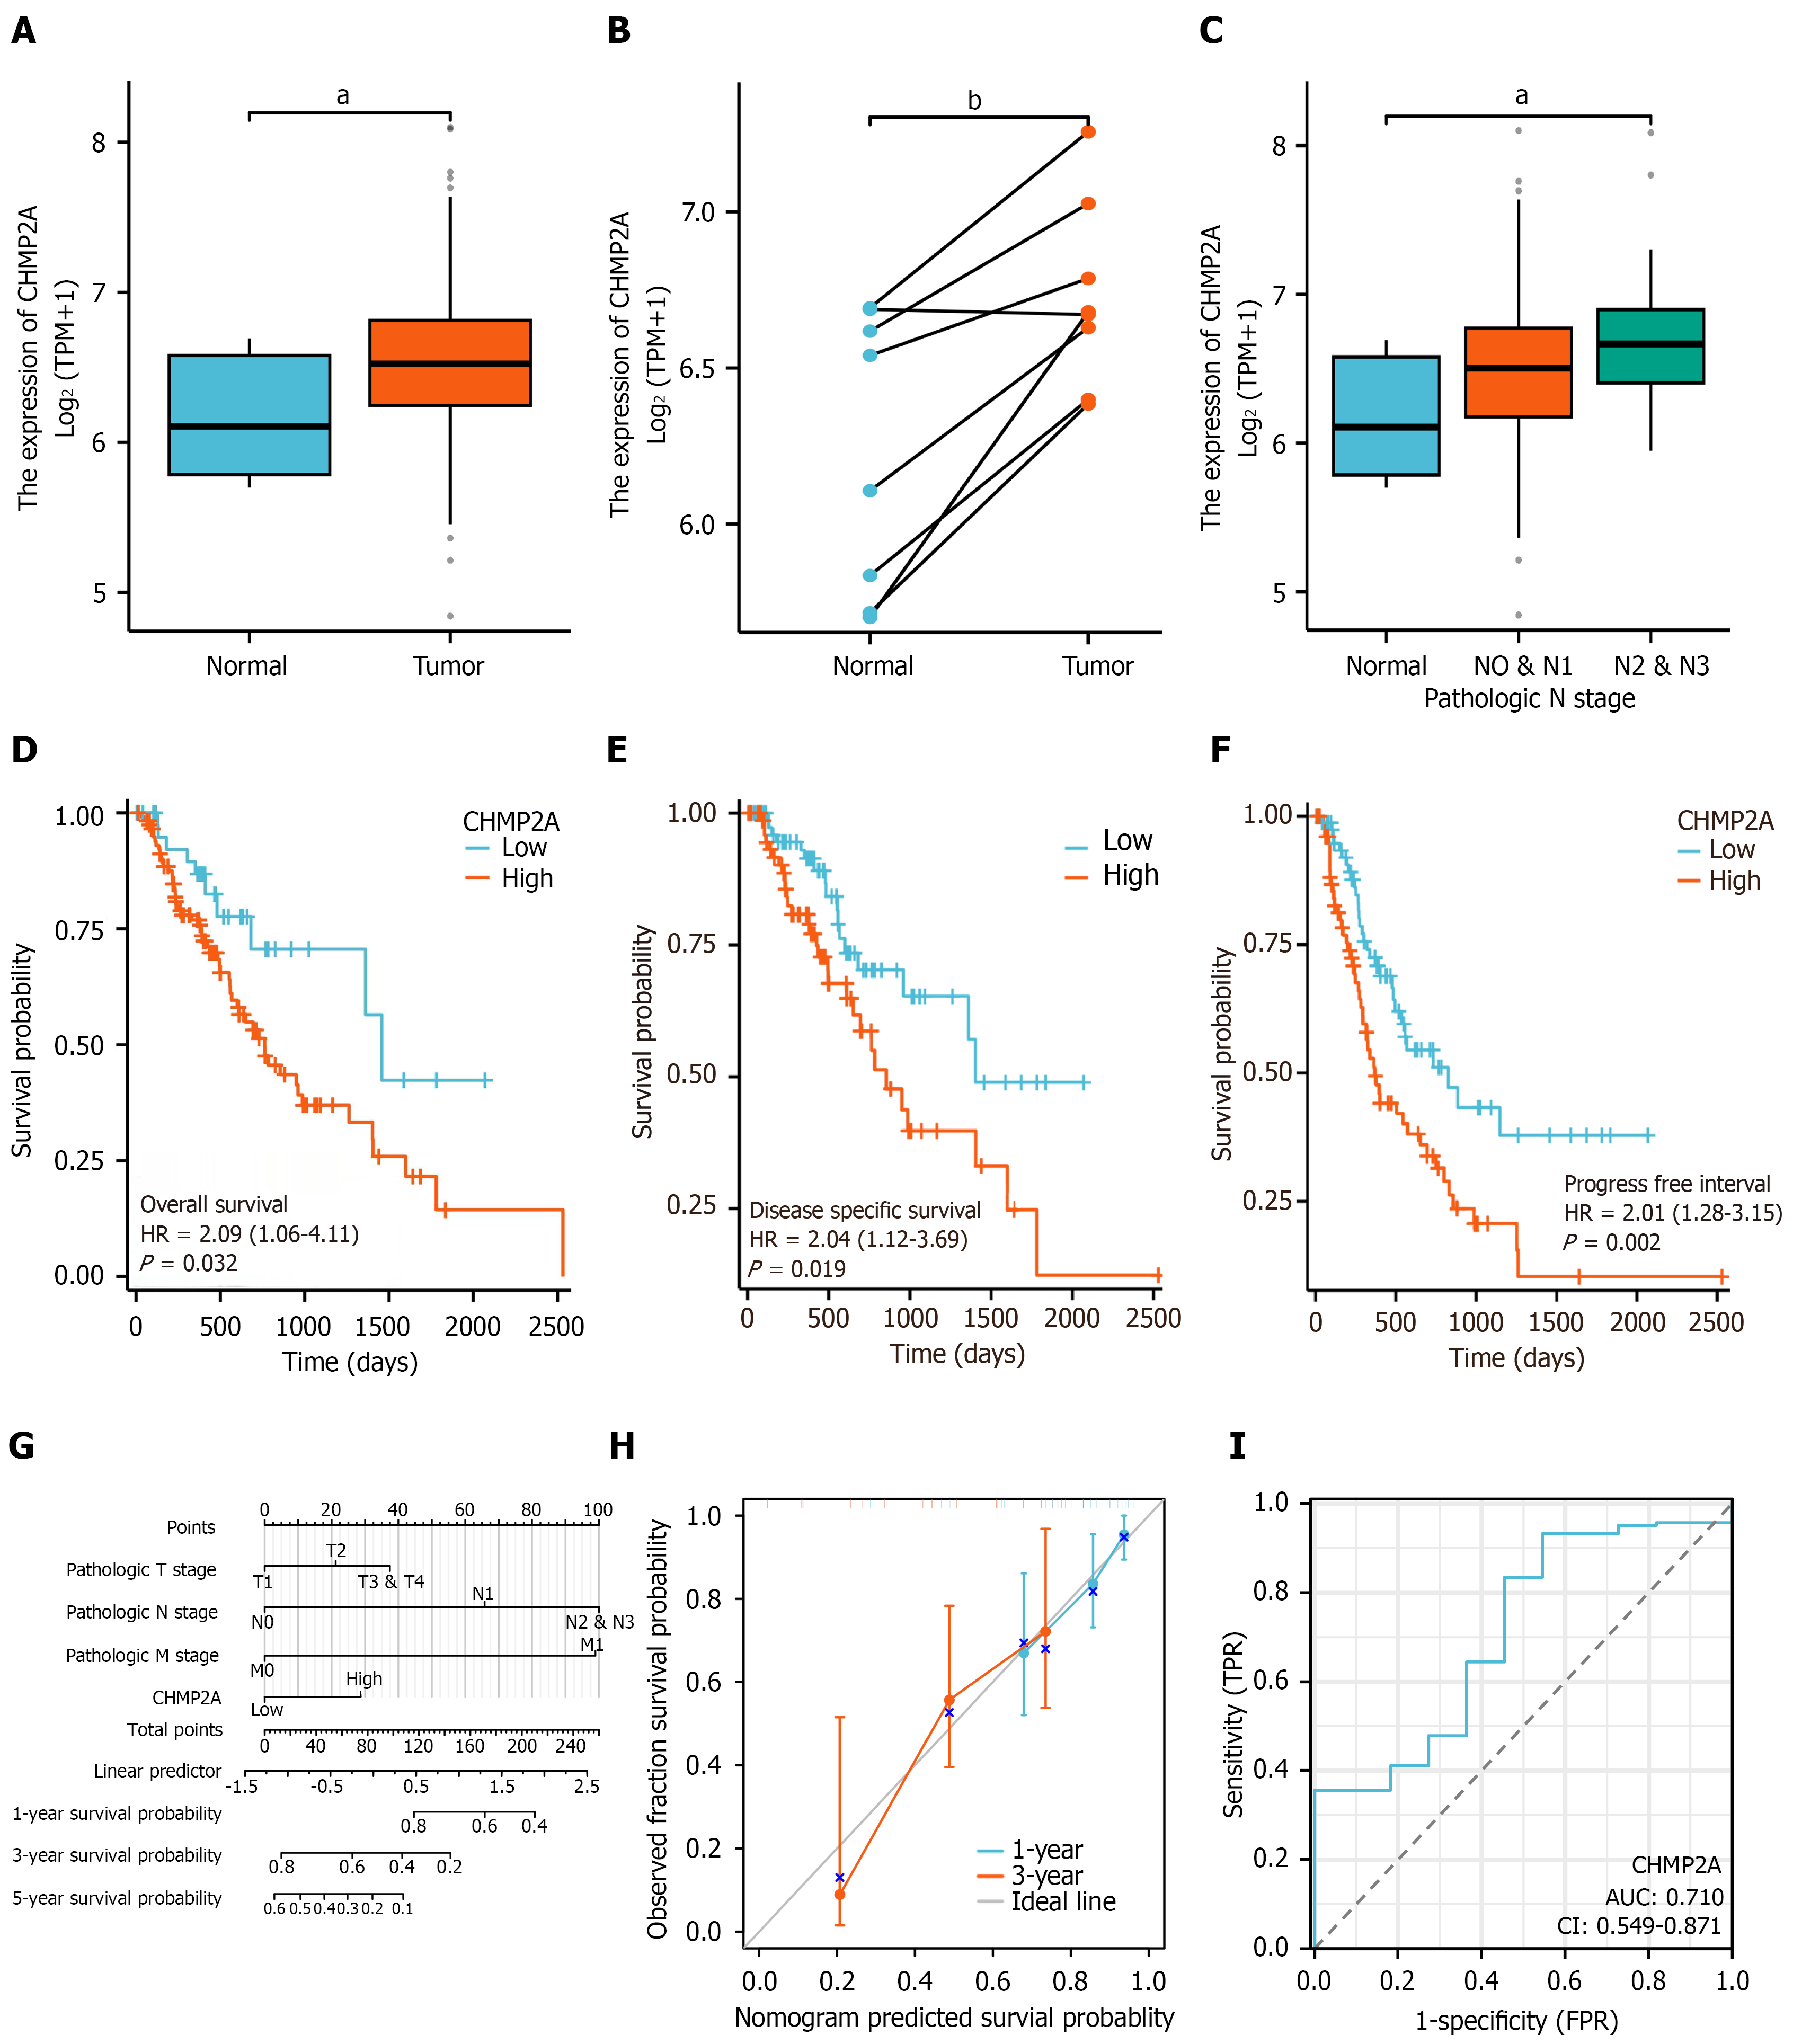
Figure 2 CHMP2A expression is elevated in esophageal cancer and predicts poor prognosis.
A and B: CHMP2A mRNA expression in esophageal cancer patients from The Cancer Genome Atlas data; C: Correlation of CHMP2A expression with N stage; D-F: Kaplan-Meier curves elucidate the correlation between CHMP2A expression and overall survival, disease-specific survival, and progression-free interval in patients with esophageal cancer; G: Nomogram showing patients with esophageal cancer projected to have 1-, 3-, and 5-year survival probability; H: Correction curve demonstrating the degree of agreement between predictions and actual observations; I: Receiver operating characteristic curve showing the diagnostic value of CHMP2A in patients with esophageal cancer. aP < 0.05; bP <0.01. AUC: Area under the curve; TPM: Transcripts per million; TPR: True positive rate; FPR: False positive rate.
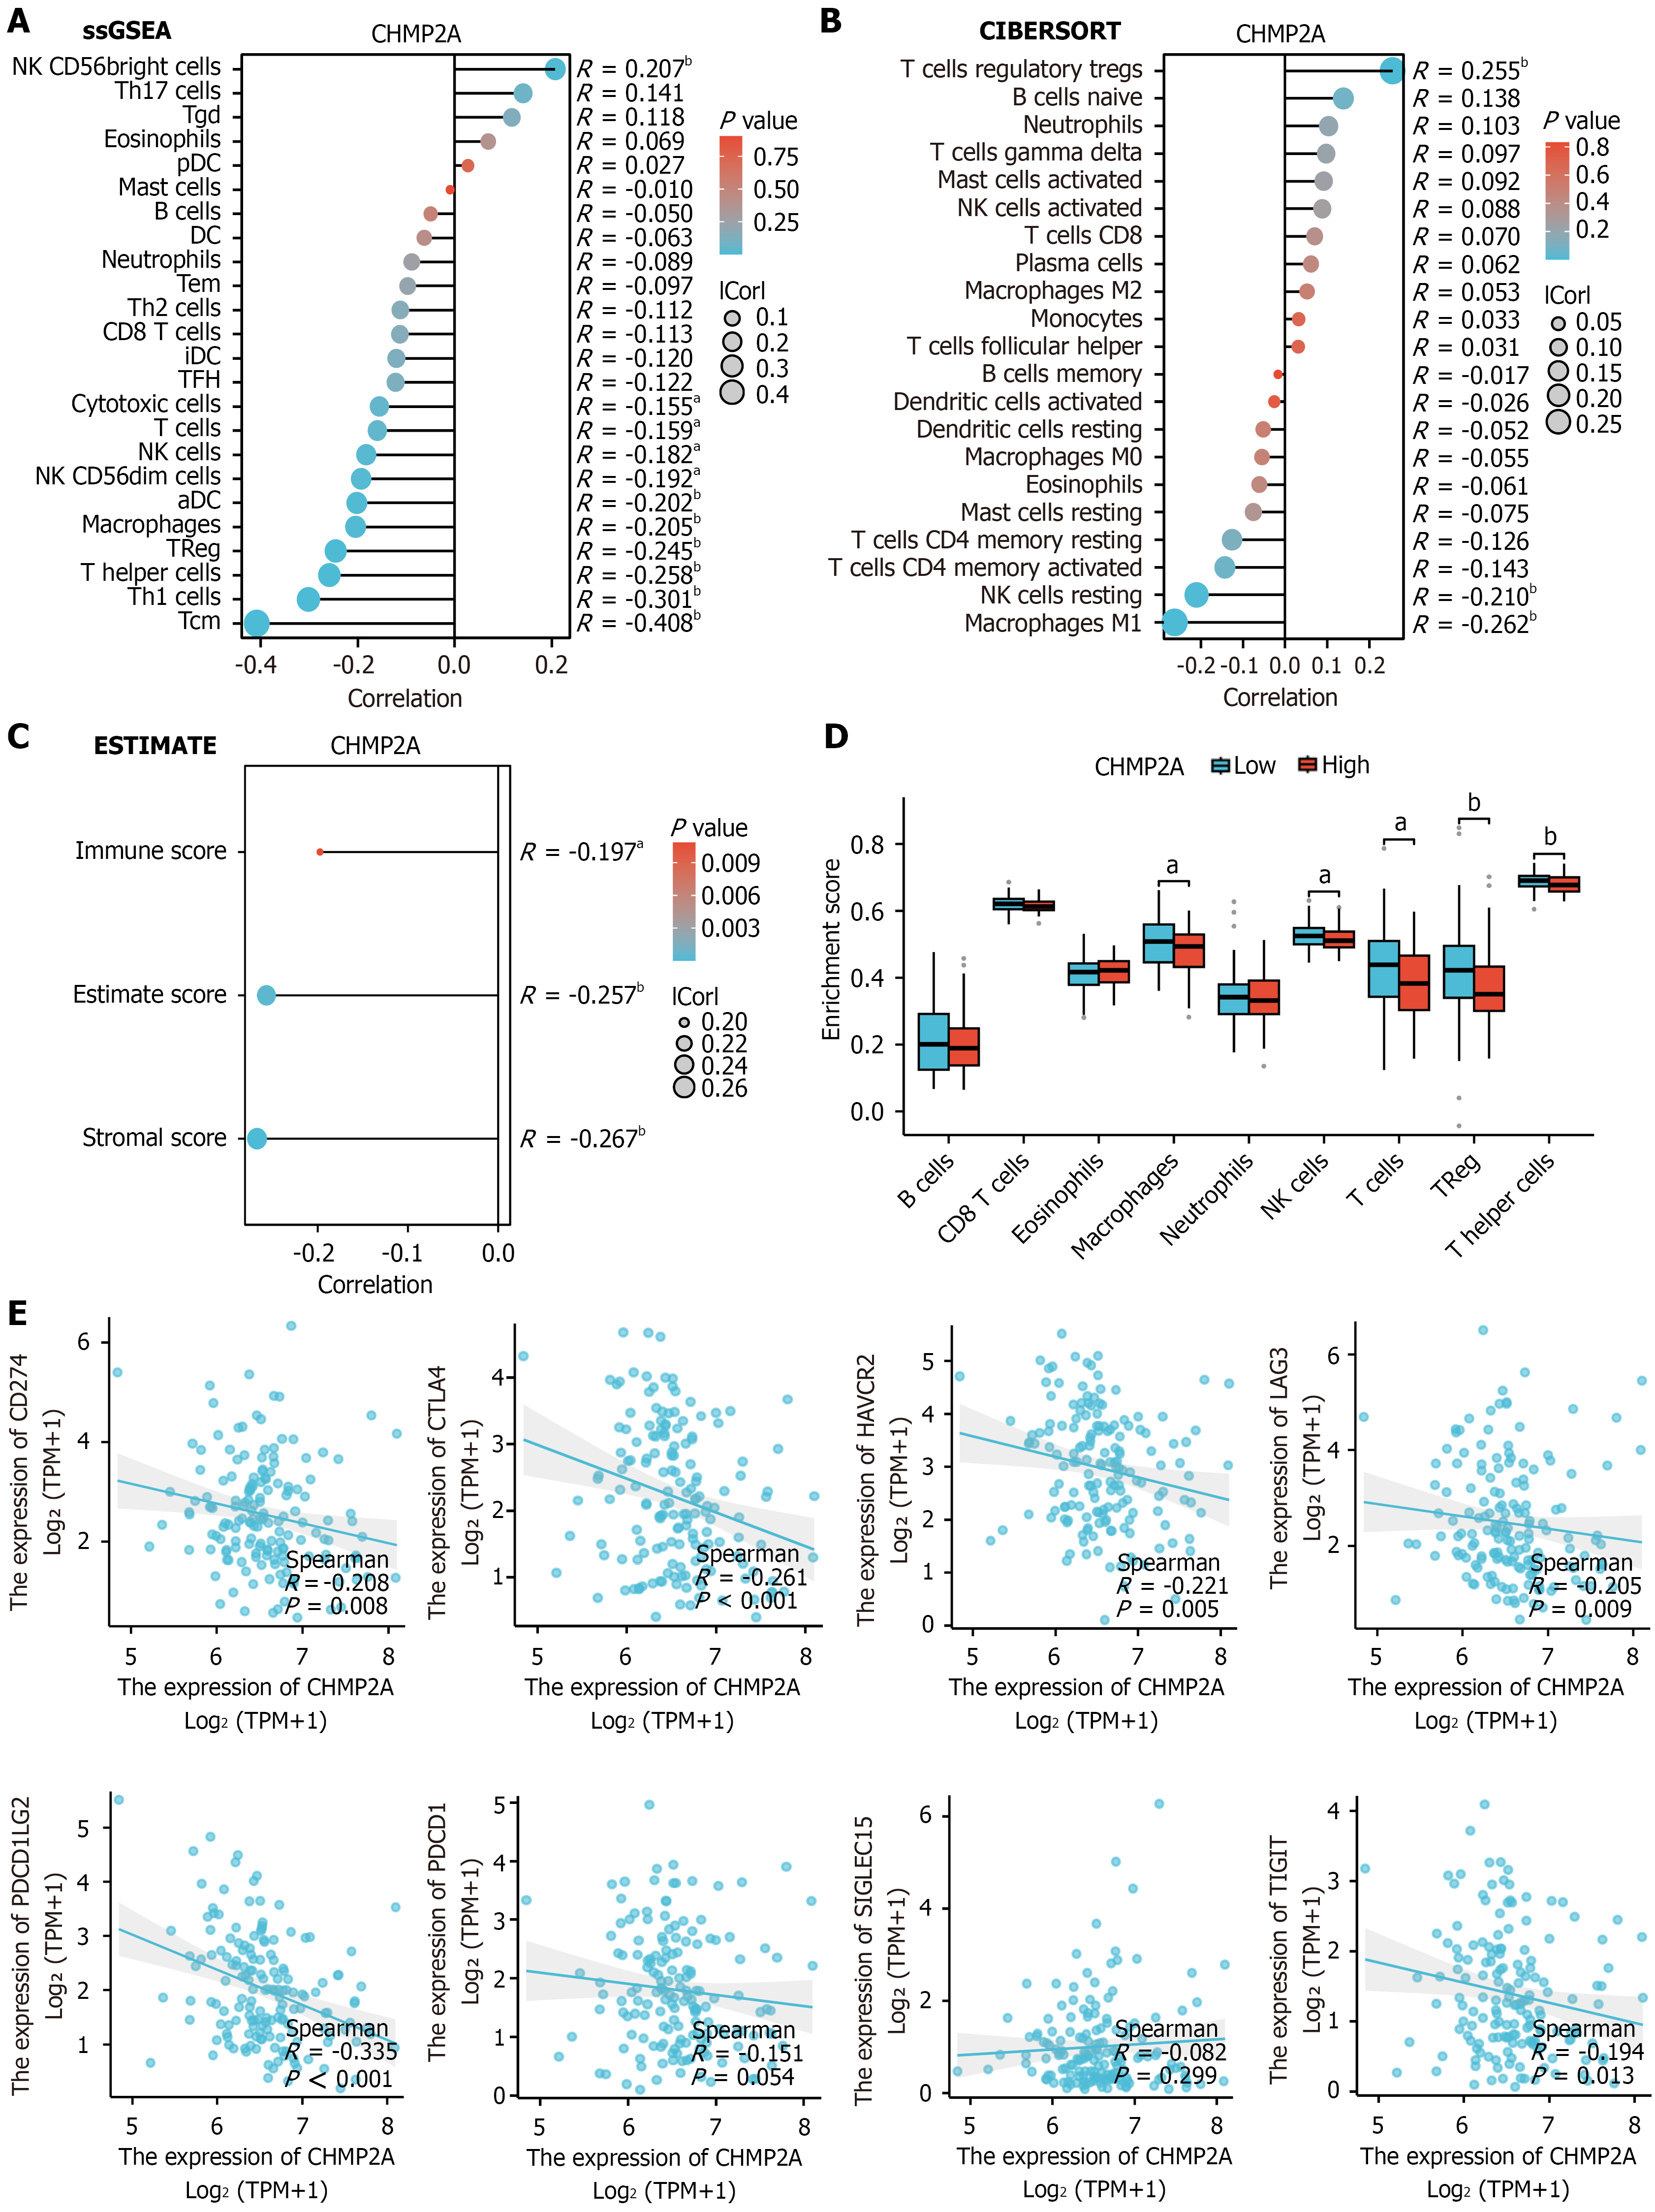
Figure 3 CHMP2A expression is associated with infiltration of multiple immune cells in esophageal squamous cell carcinoma.
A: Correlation of CHMP2A with immune, estimate, and stromal as analyzed by the ESTIMATE algorithm; B and C: Relationship between CHMP2A expression and immune cells as elucidated by the single sample gene set enrichment analysis and CIBERSORT algorithms; D: Elevated CHMP2A expression inhibited the infiltration of multiple immune cells; E: Relationship between CHMP2A expression and immune checkpoint expression levels, including CD274 (PD-L1), CTLA4, HAVCR2, LAG3, PDCD1 LG2, PDCD1 (PD-1), SIGLEC15, and TIGIT. aP < 0.05; bP < 0.01. ssGSEA: Single sample gene set enrichment analysis; TPM: Transcripts per million.
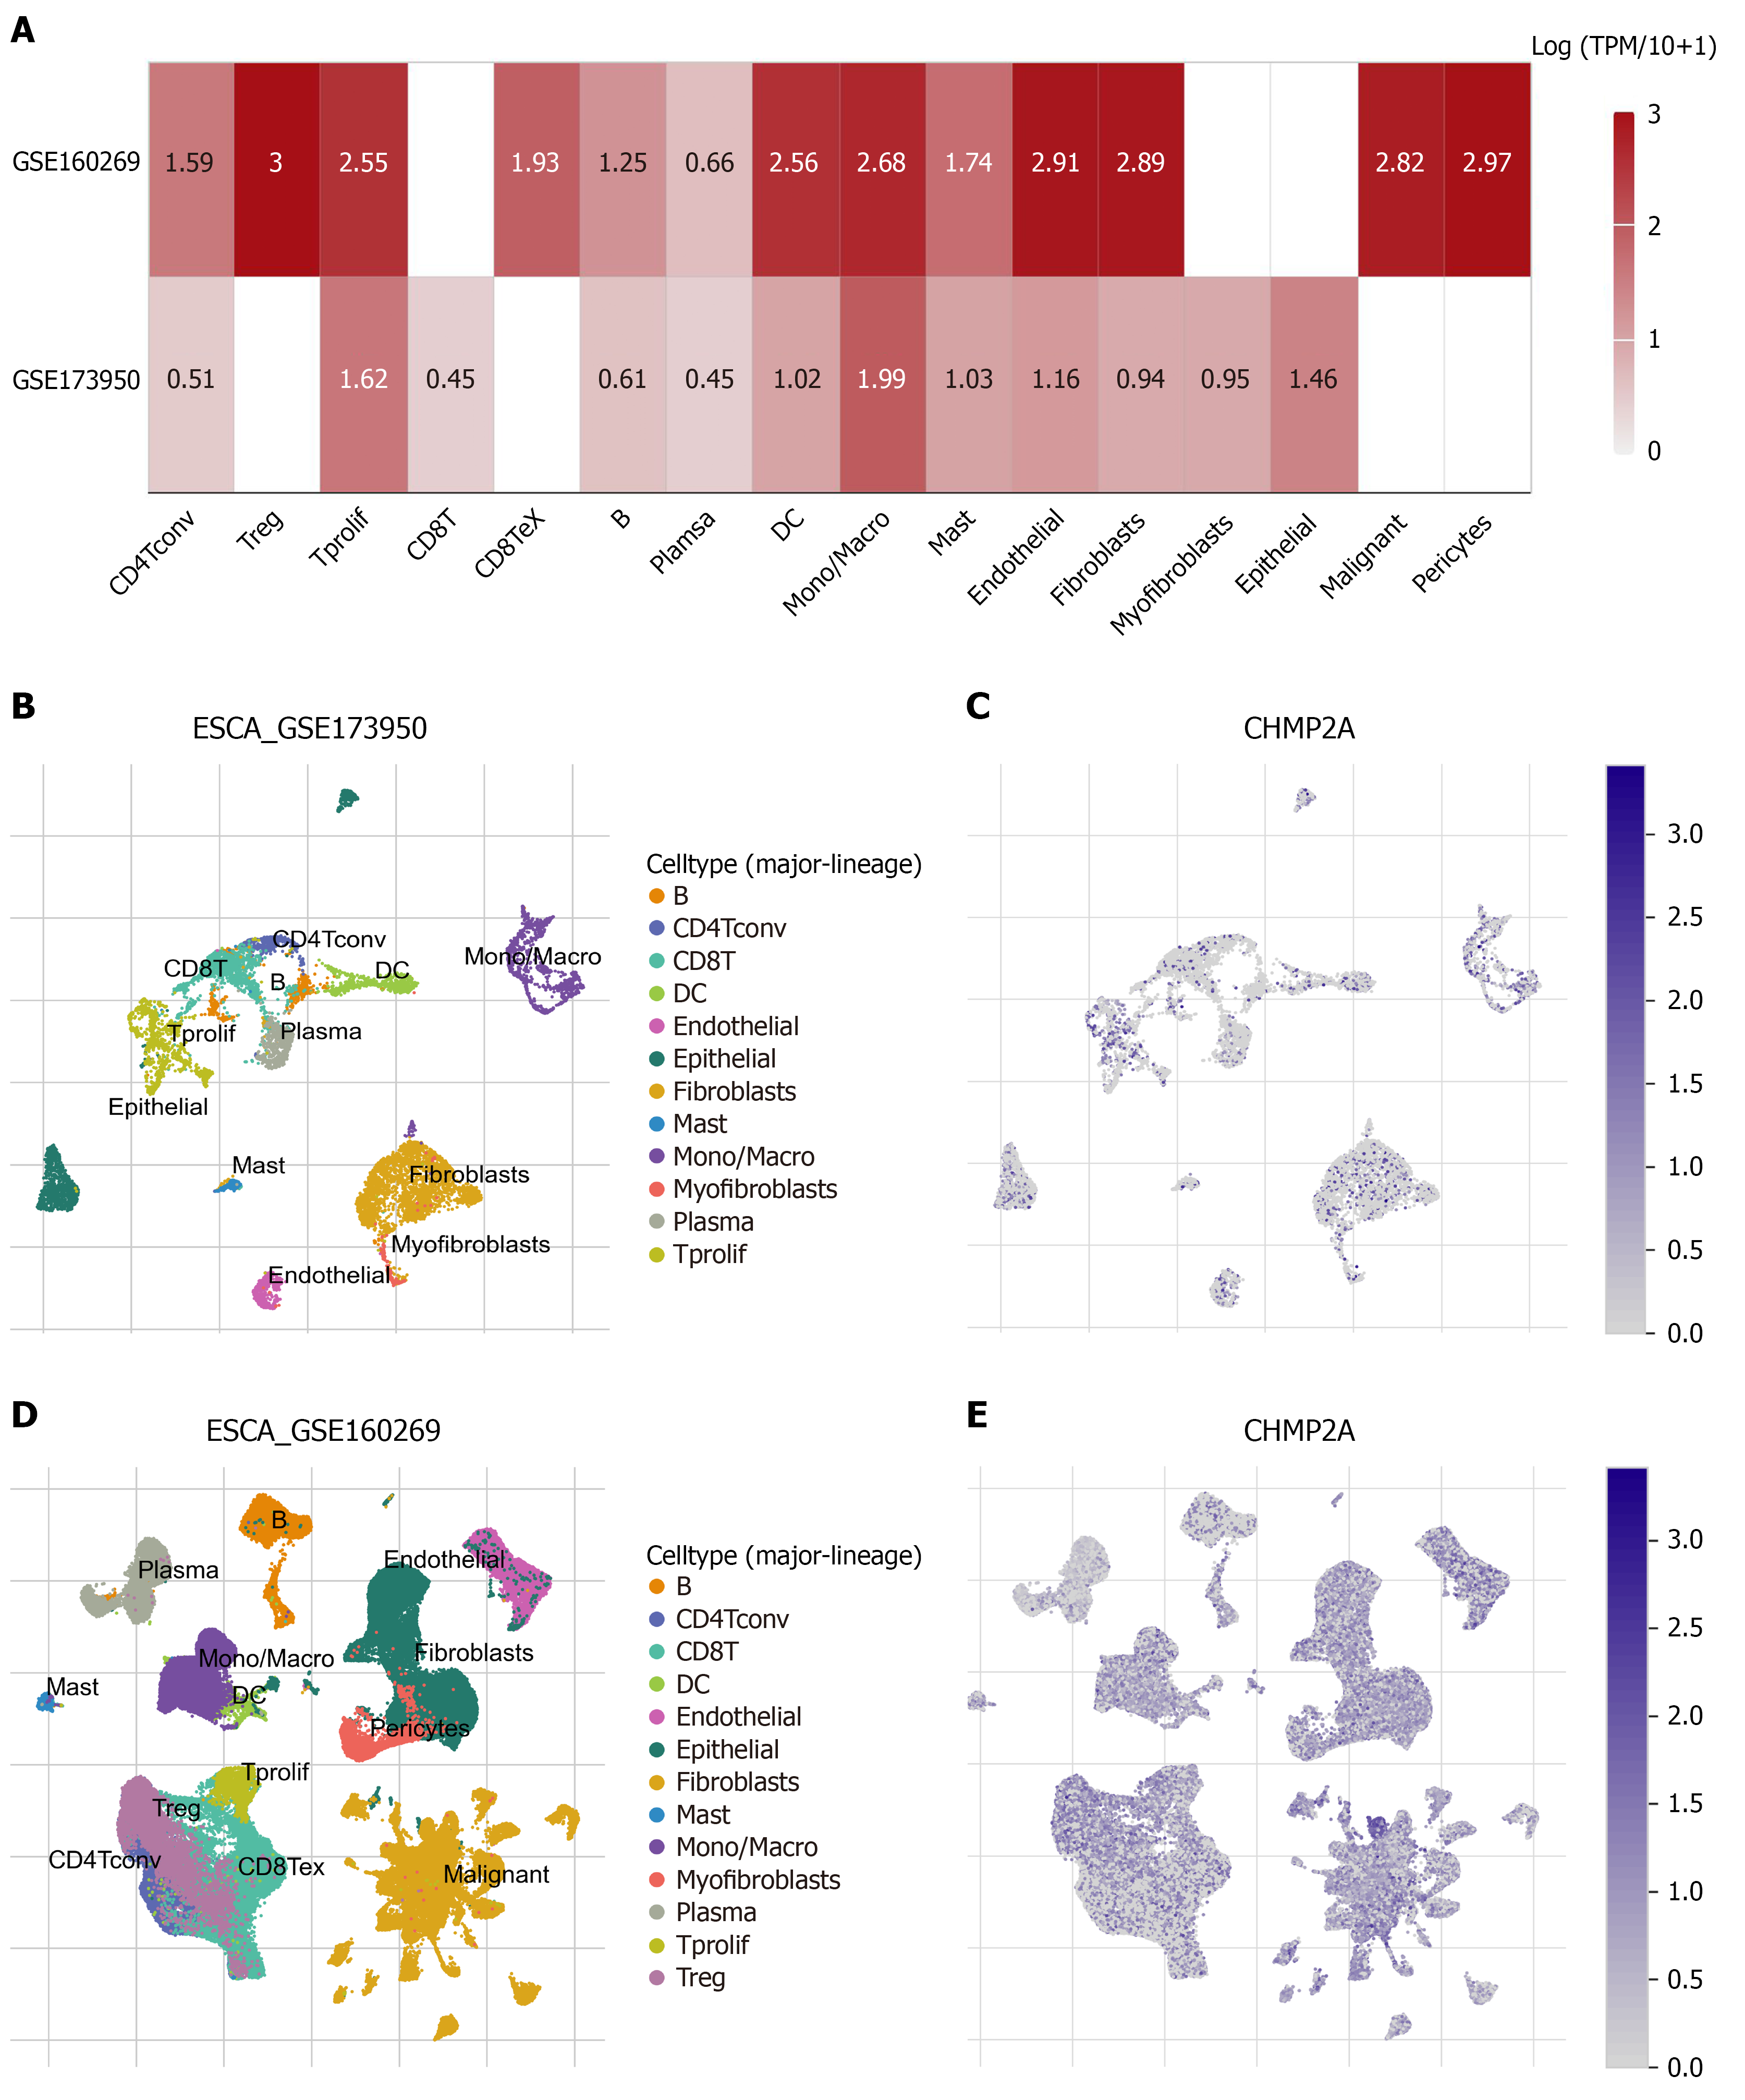
Figure 4 Single-cell transcriptomic analysis of the distribution of CHMP2A expression in different cell types in the tumor micro
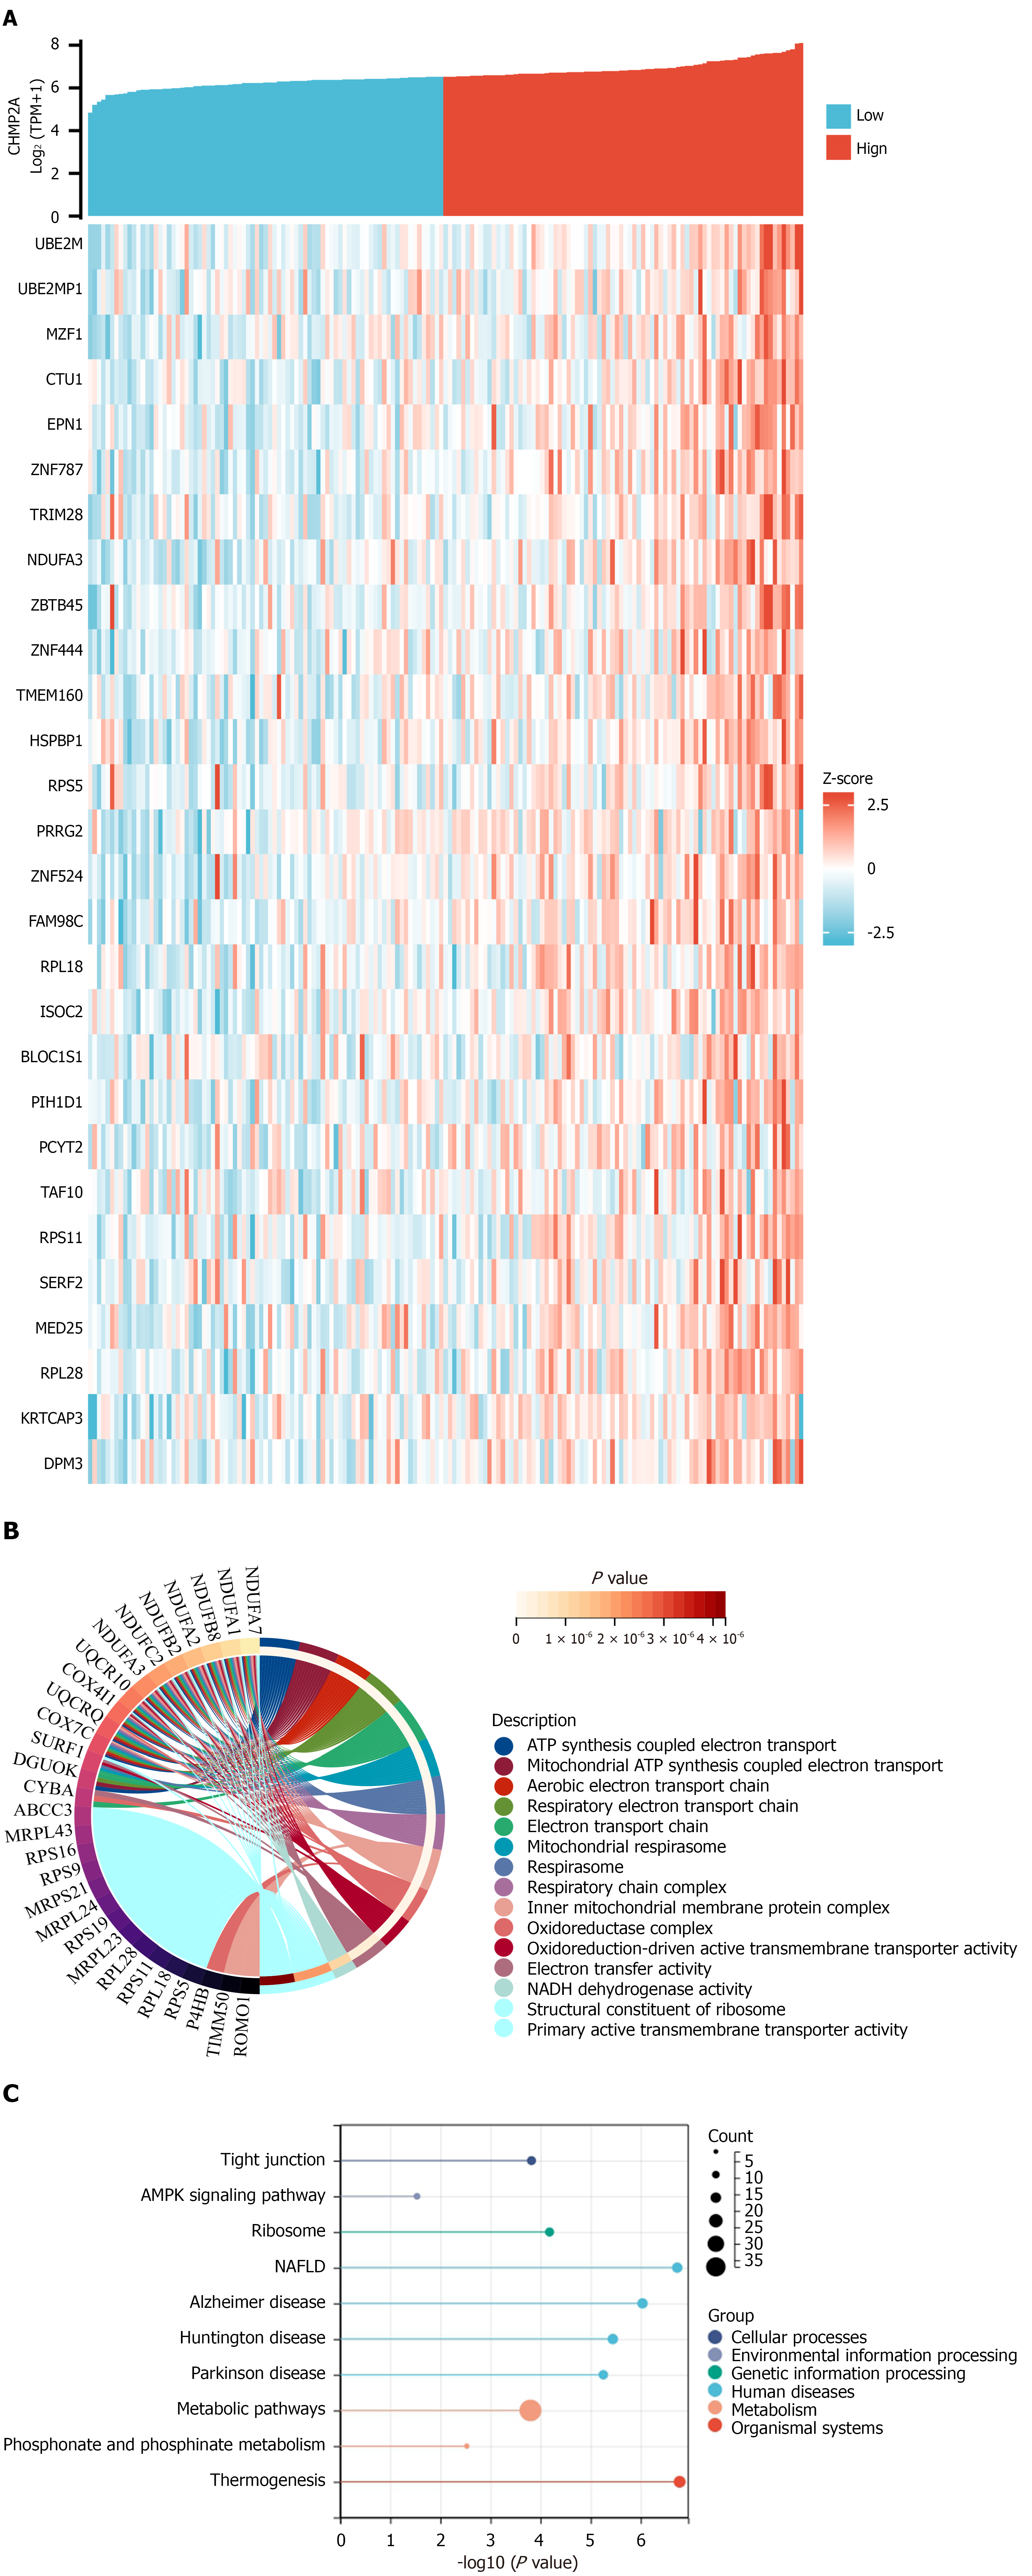
Figure 5 Functional enrichment study of genes co-expressed with CHMP2A.
A: The CHMP2A gene was subjected to correlation analysis with the co-expressed genes obtained; B: Genes co-expressed with CHMP2A were analyzed using Gene Ontology enrichment; C: Analysis of Kyoto Encyclopedia of Genes and Genomes enrichment for genes co-expressed with CHMP2A. NAFLD: Non-alcoholic fatty liver disease; TPM: Transcripts per million.
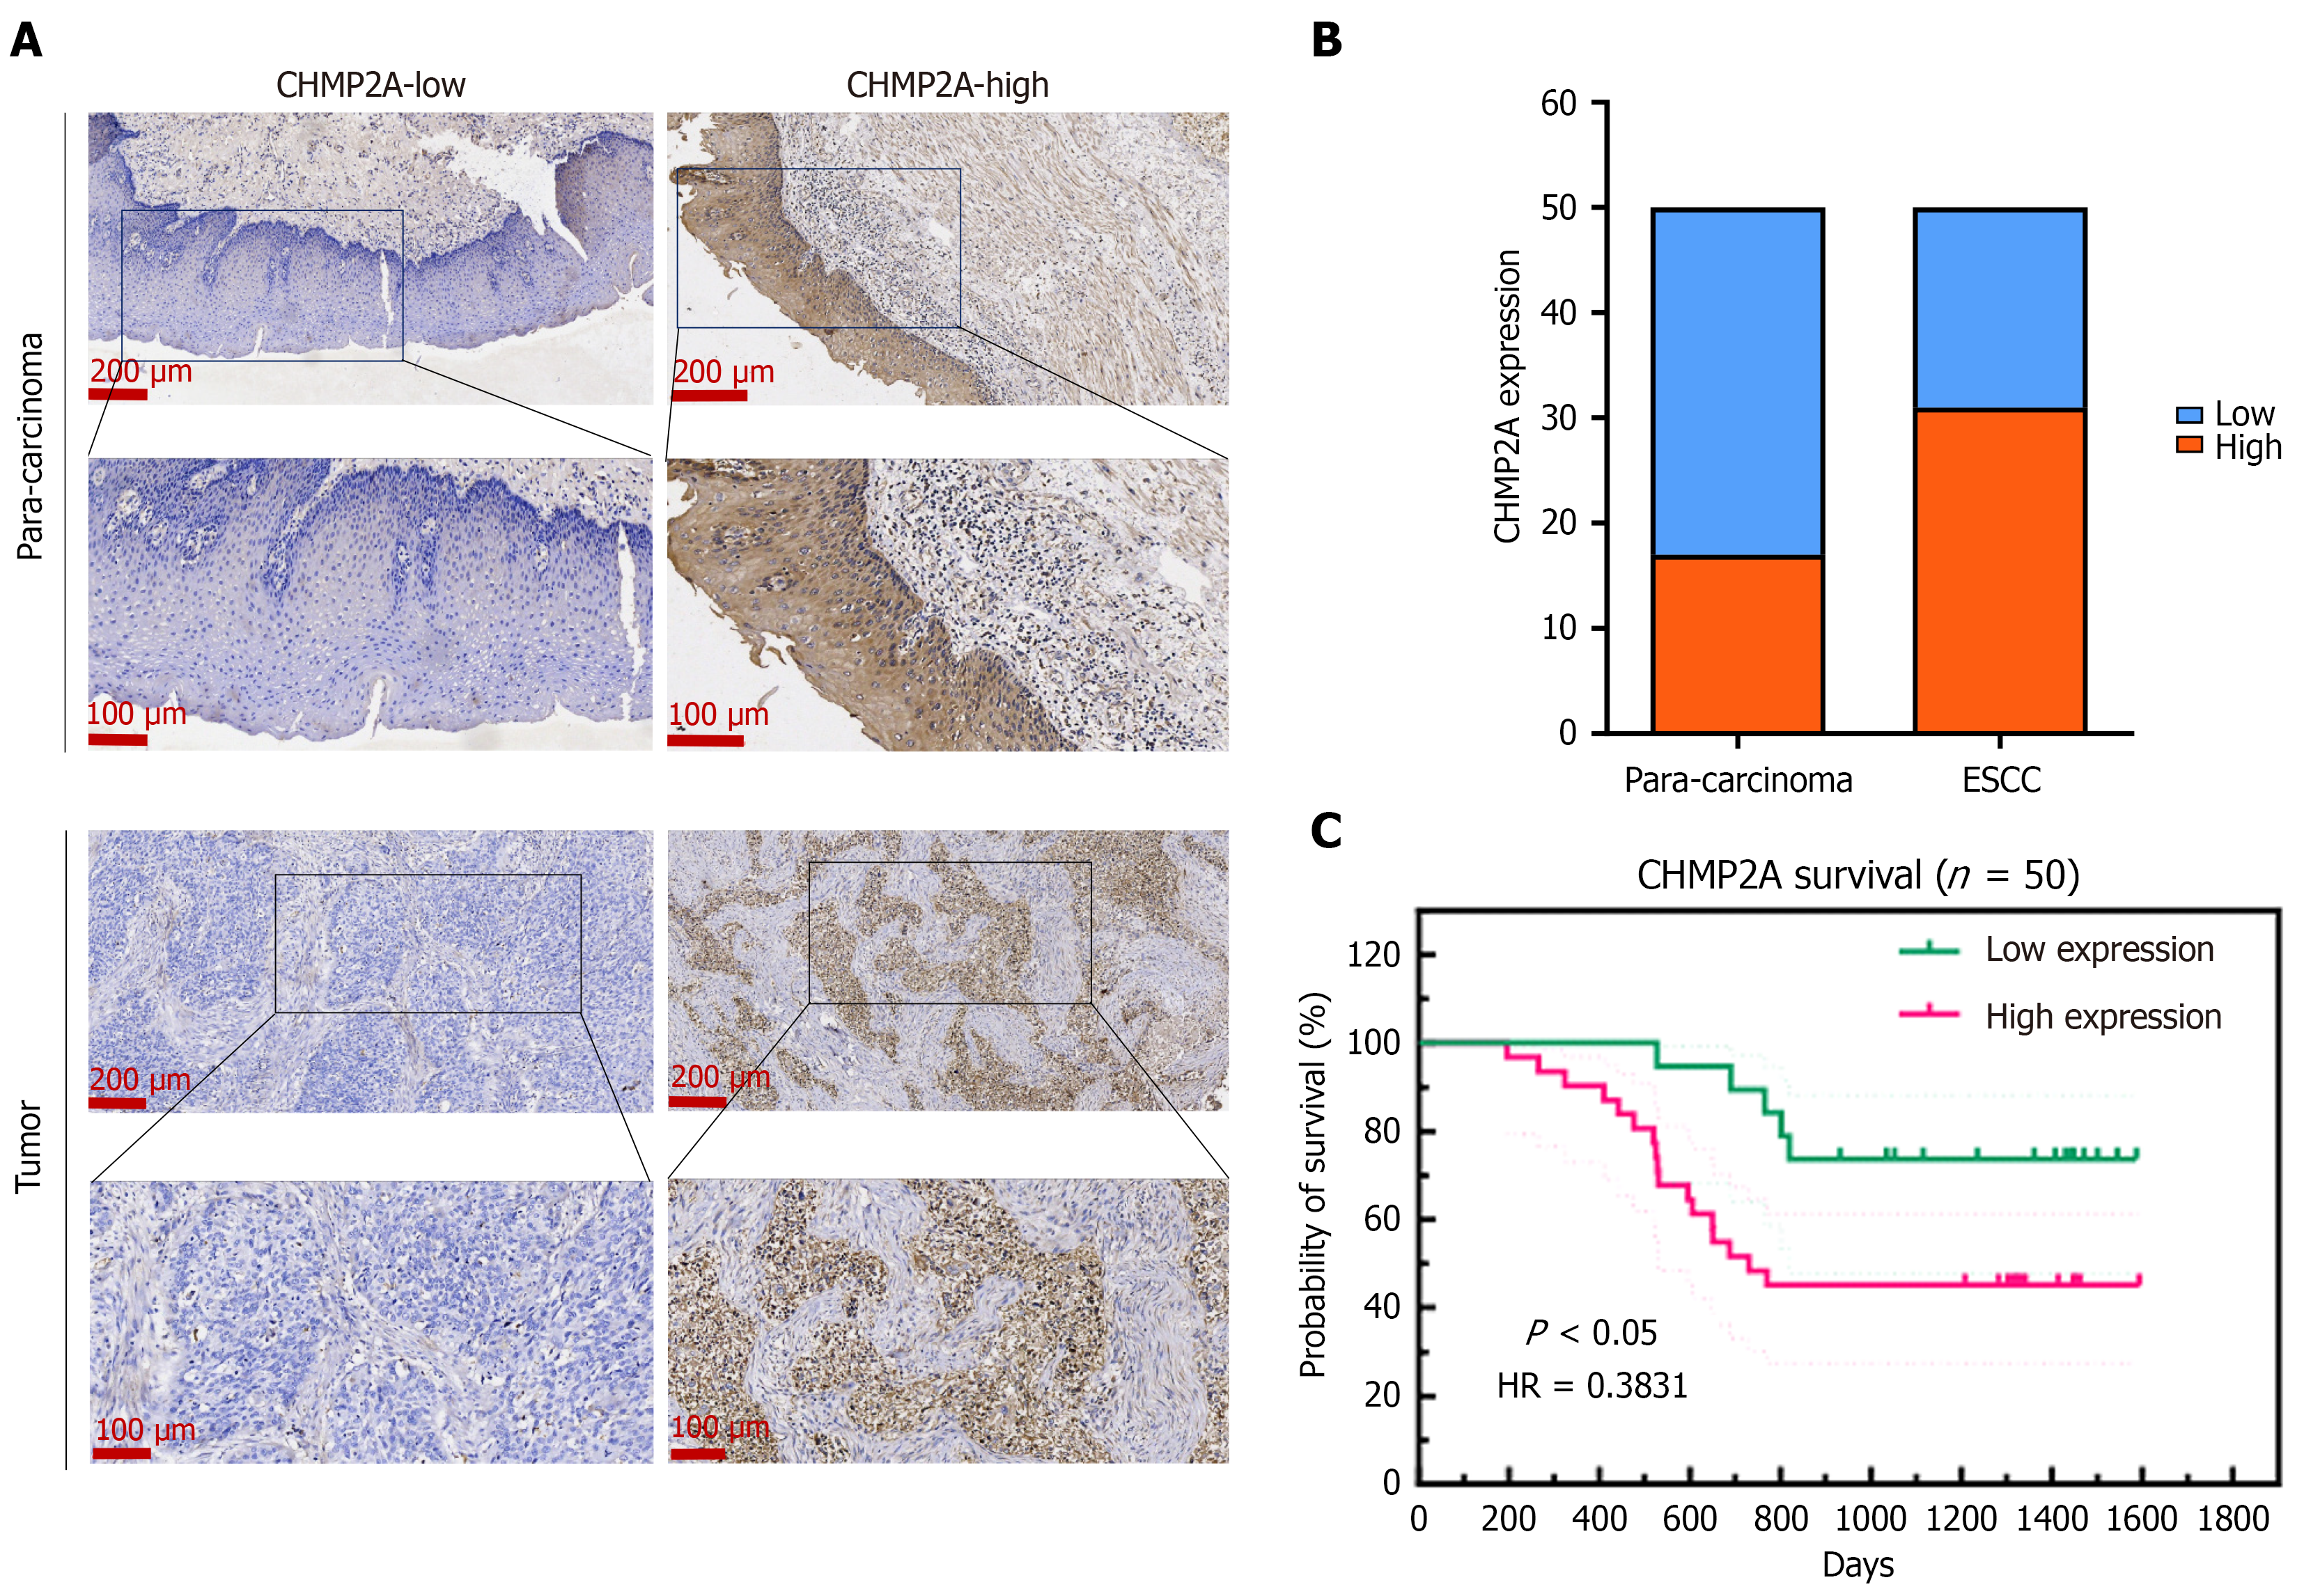
Figure 6 CHMP2A expression is upregulated in esophageal squamous cell carcinoma and correlates with a poor prognosis.
A and B: Immunohistochemistry detection of CHMP2A expression in esophageal squamous cell carcinoma (ESCC) tissues and para-carcinoma tissues; C: Correlation between CHMP2A expression and prognosis in ESCC patients (n = 50). ESCC: Esophageal squamous cell carcinoma.
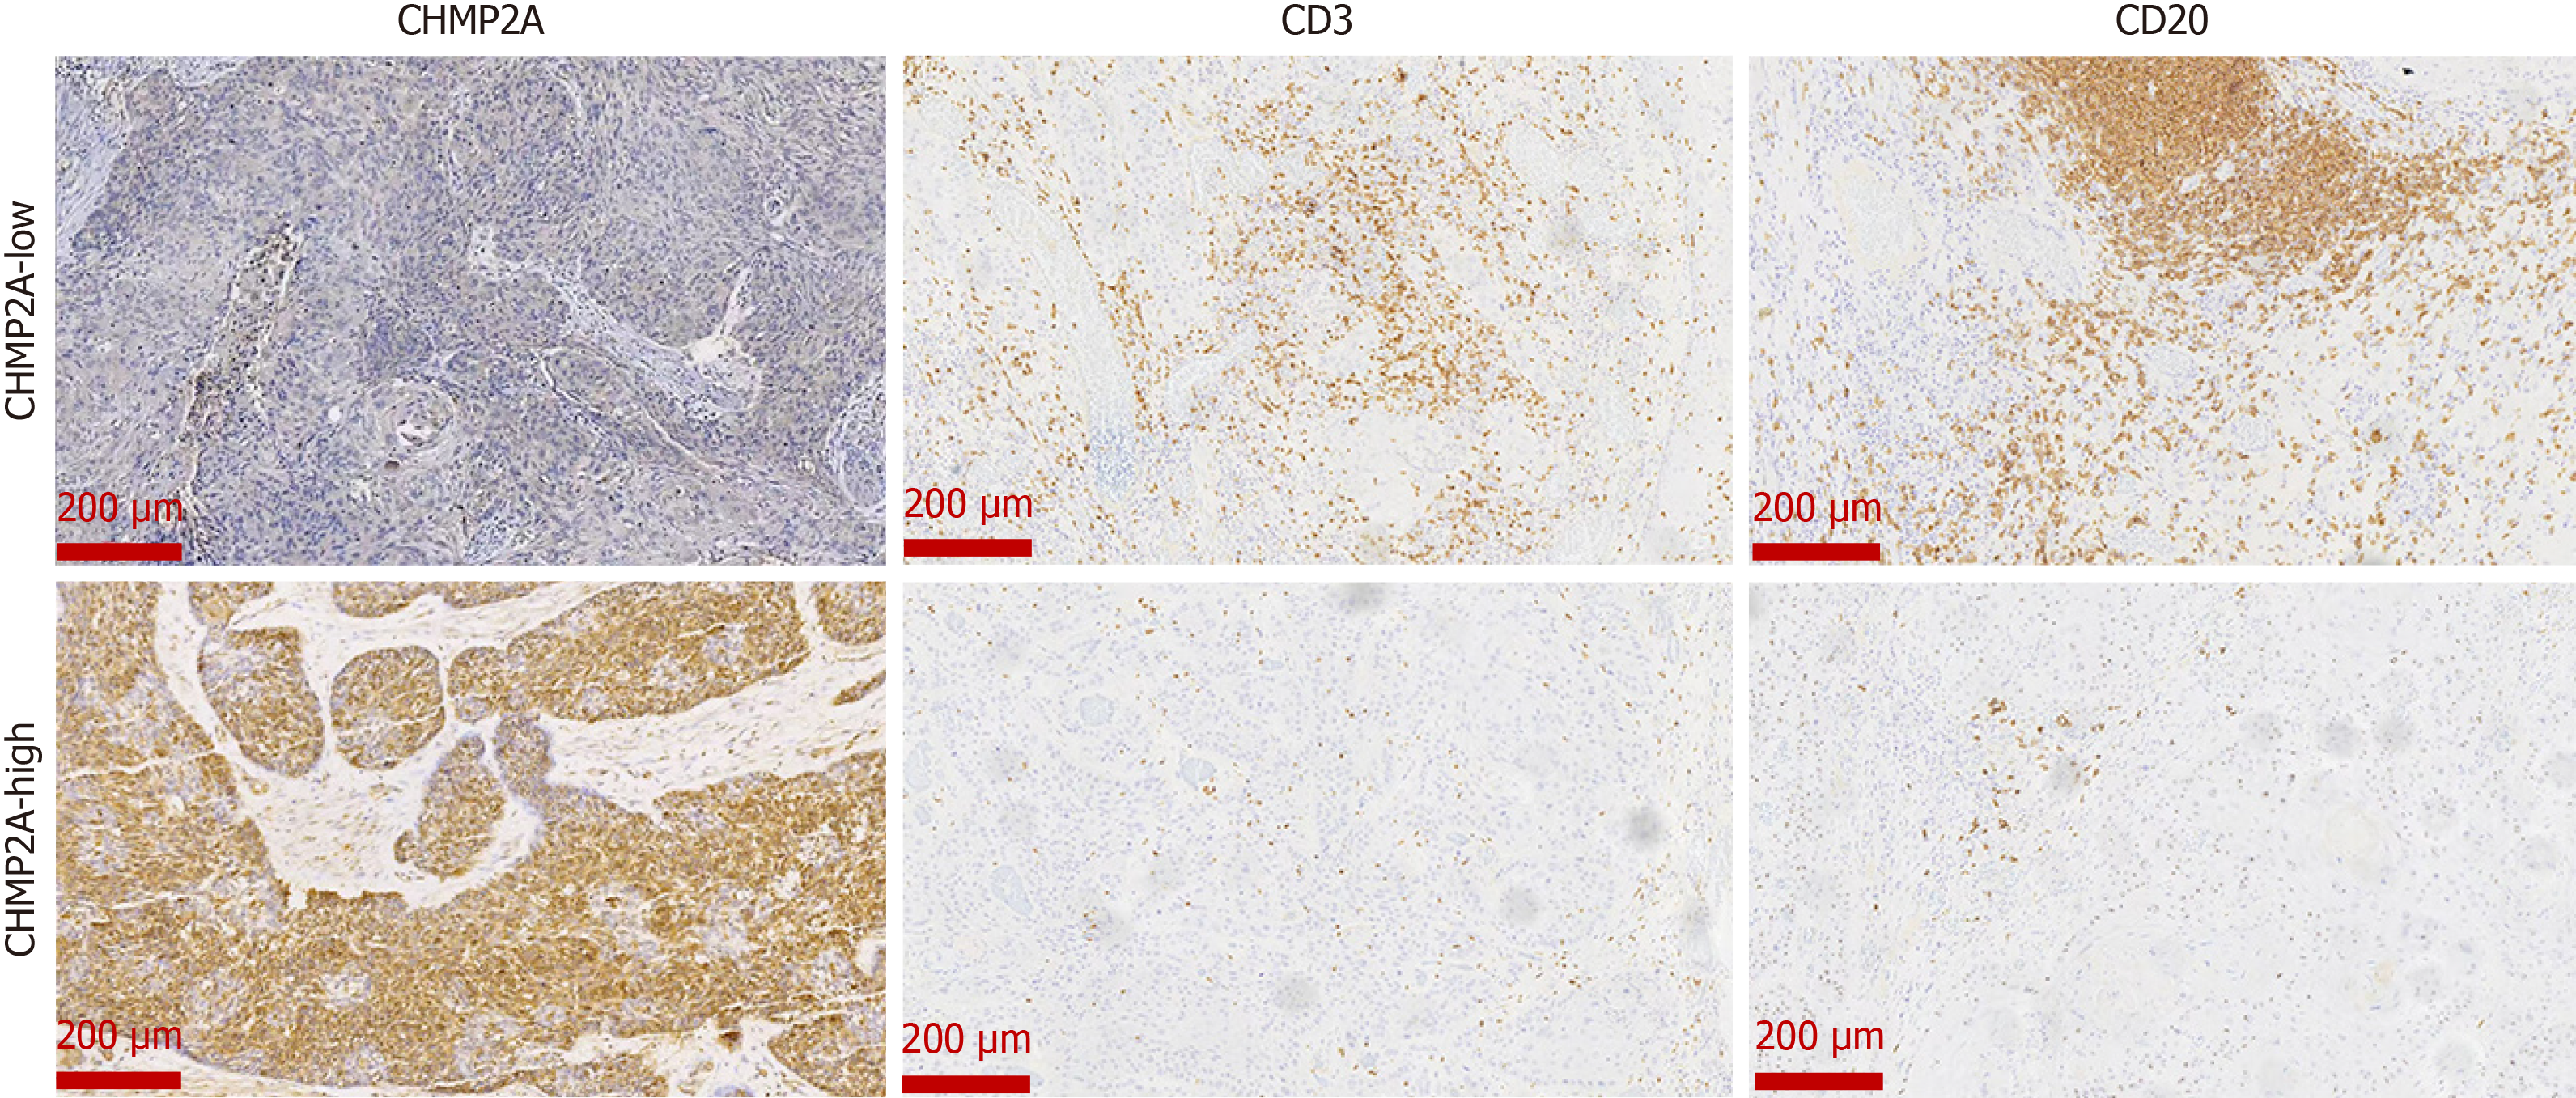
Figure 7
Levels of CD3+ T cells and CD20+ B cells in the same esophageal squamous cell carcinoma patient’s tumor tissues.
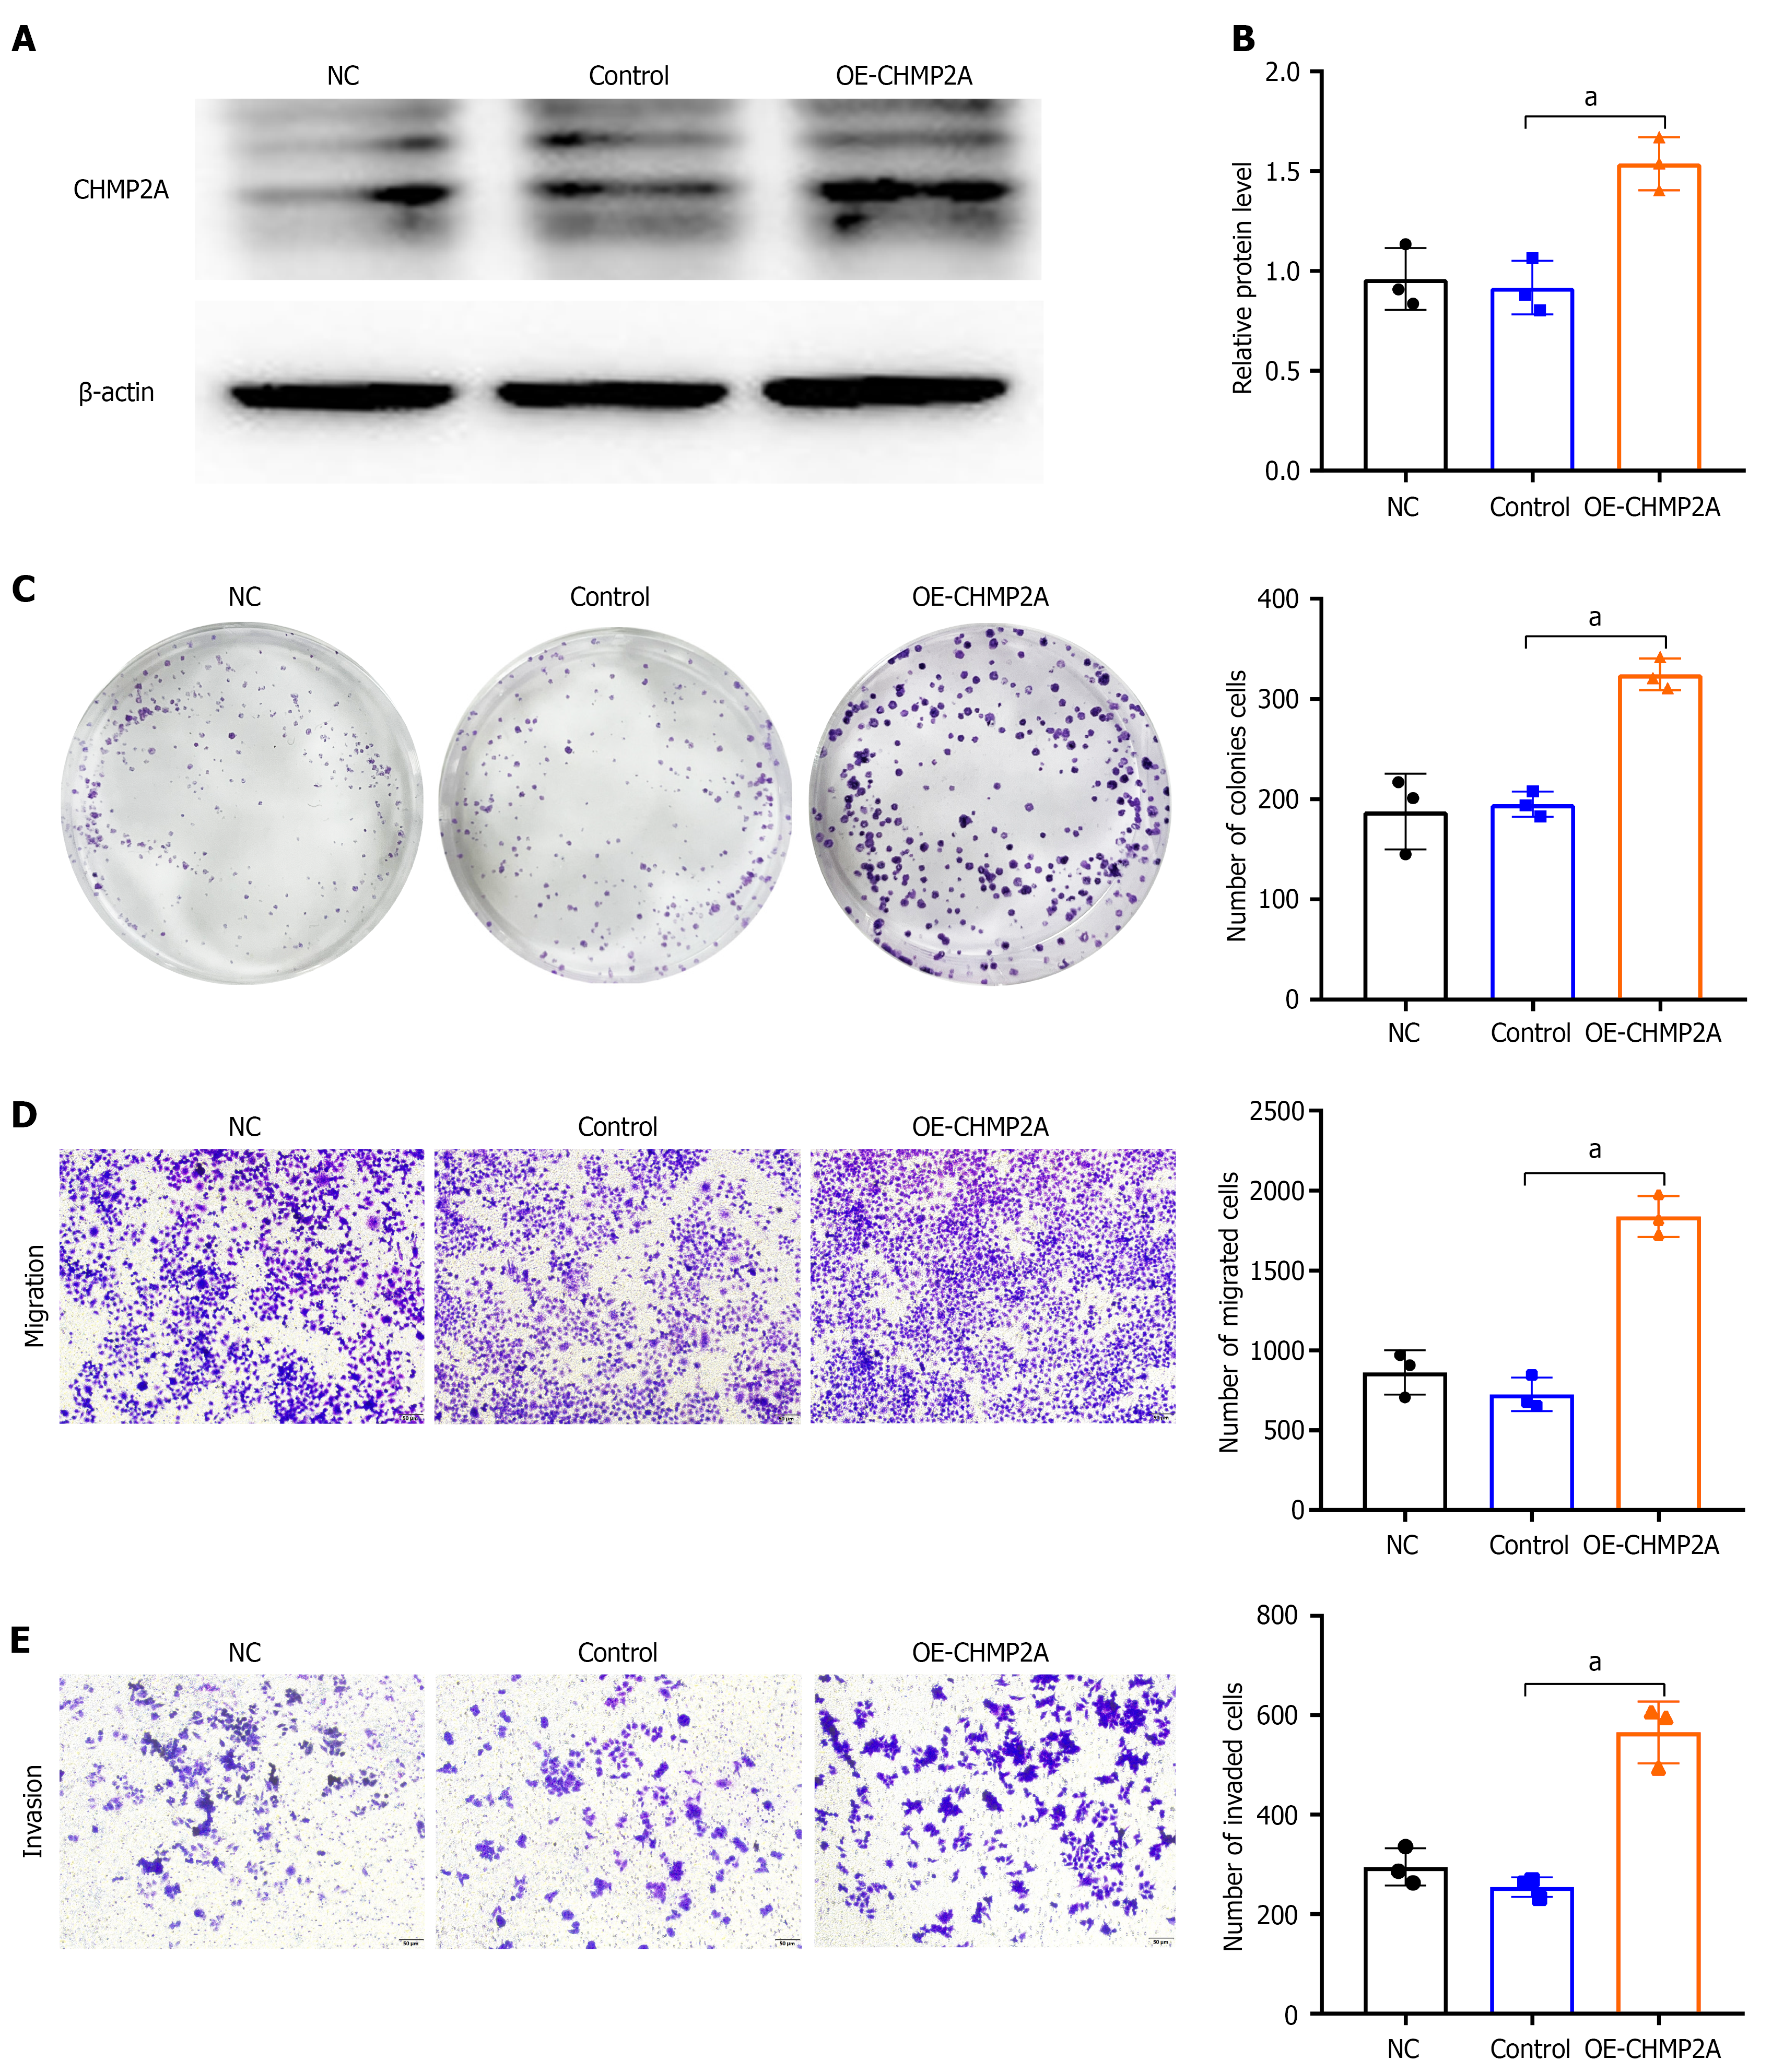
Figure 8 Elevated CHMP2A expression promotes the proliferation, migration, and invasion of esophageal squamous cell carcinoma.
A and B: Protein expression level of CHMP2A detected by western blotting (n = 3); C: Plate colony formation test assessing the impact of CHMP2A expression on the proliferation of esophageal squamous cell carcinoma (ESCC) cells (n = 3); D and E: Influence of CHMP2A expression on the migratory and invasive capabilities of ESCC cells (n = 3), examined using Transwell assay. aP < 0.05.
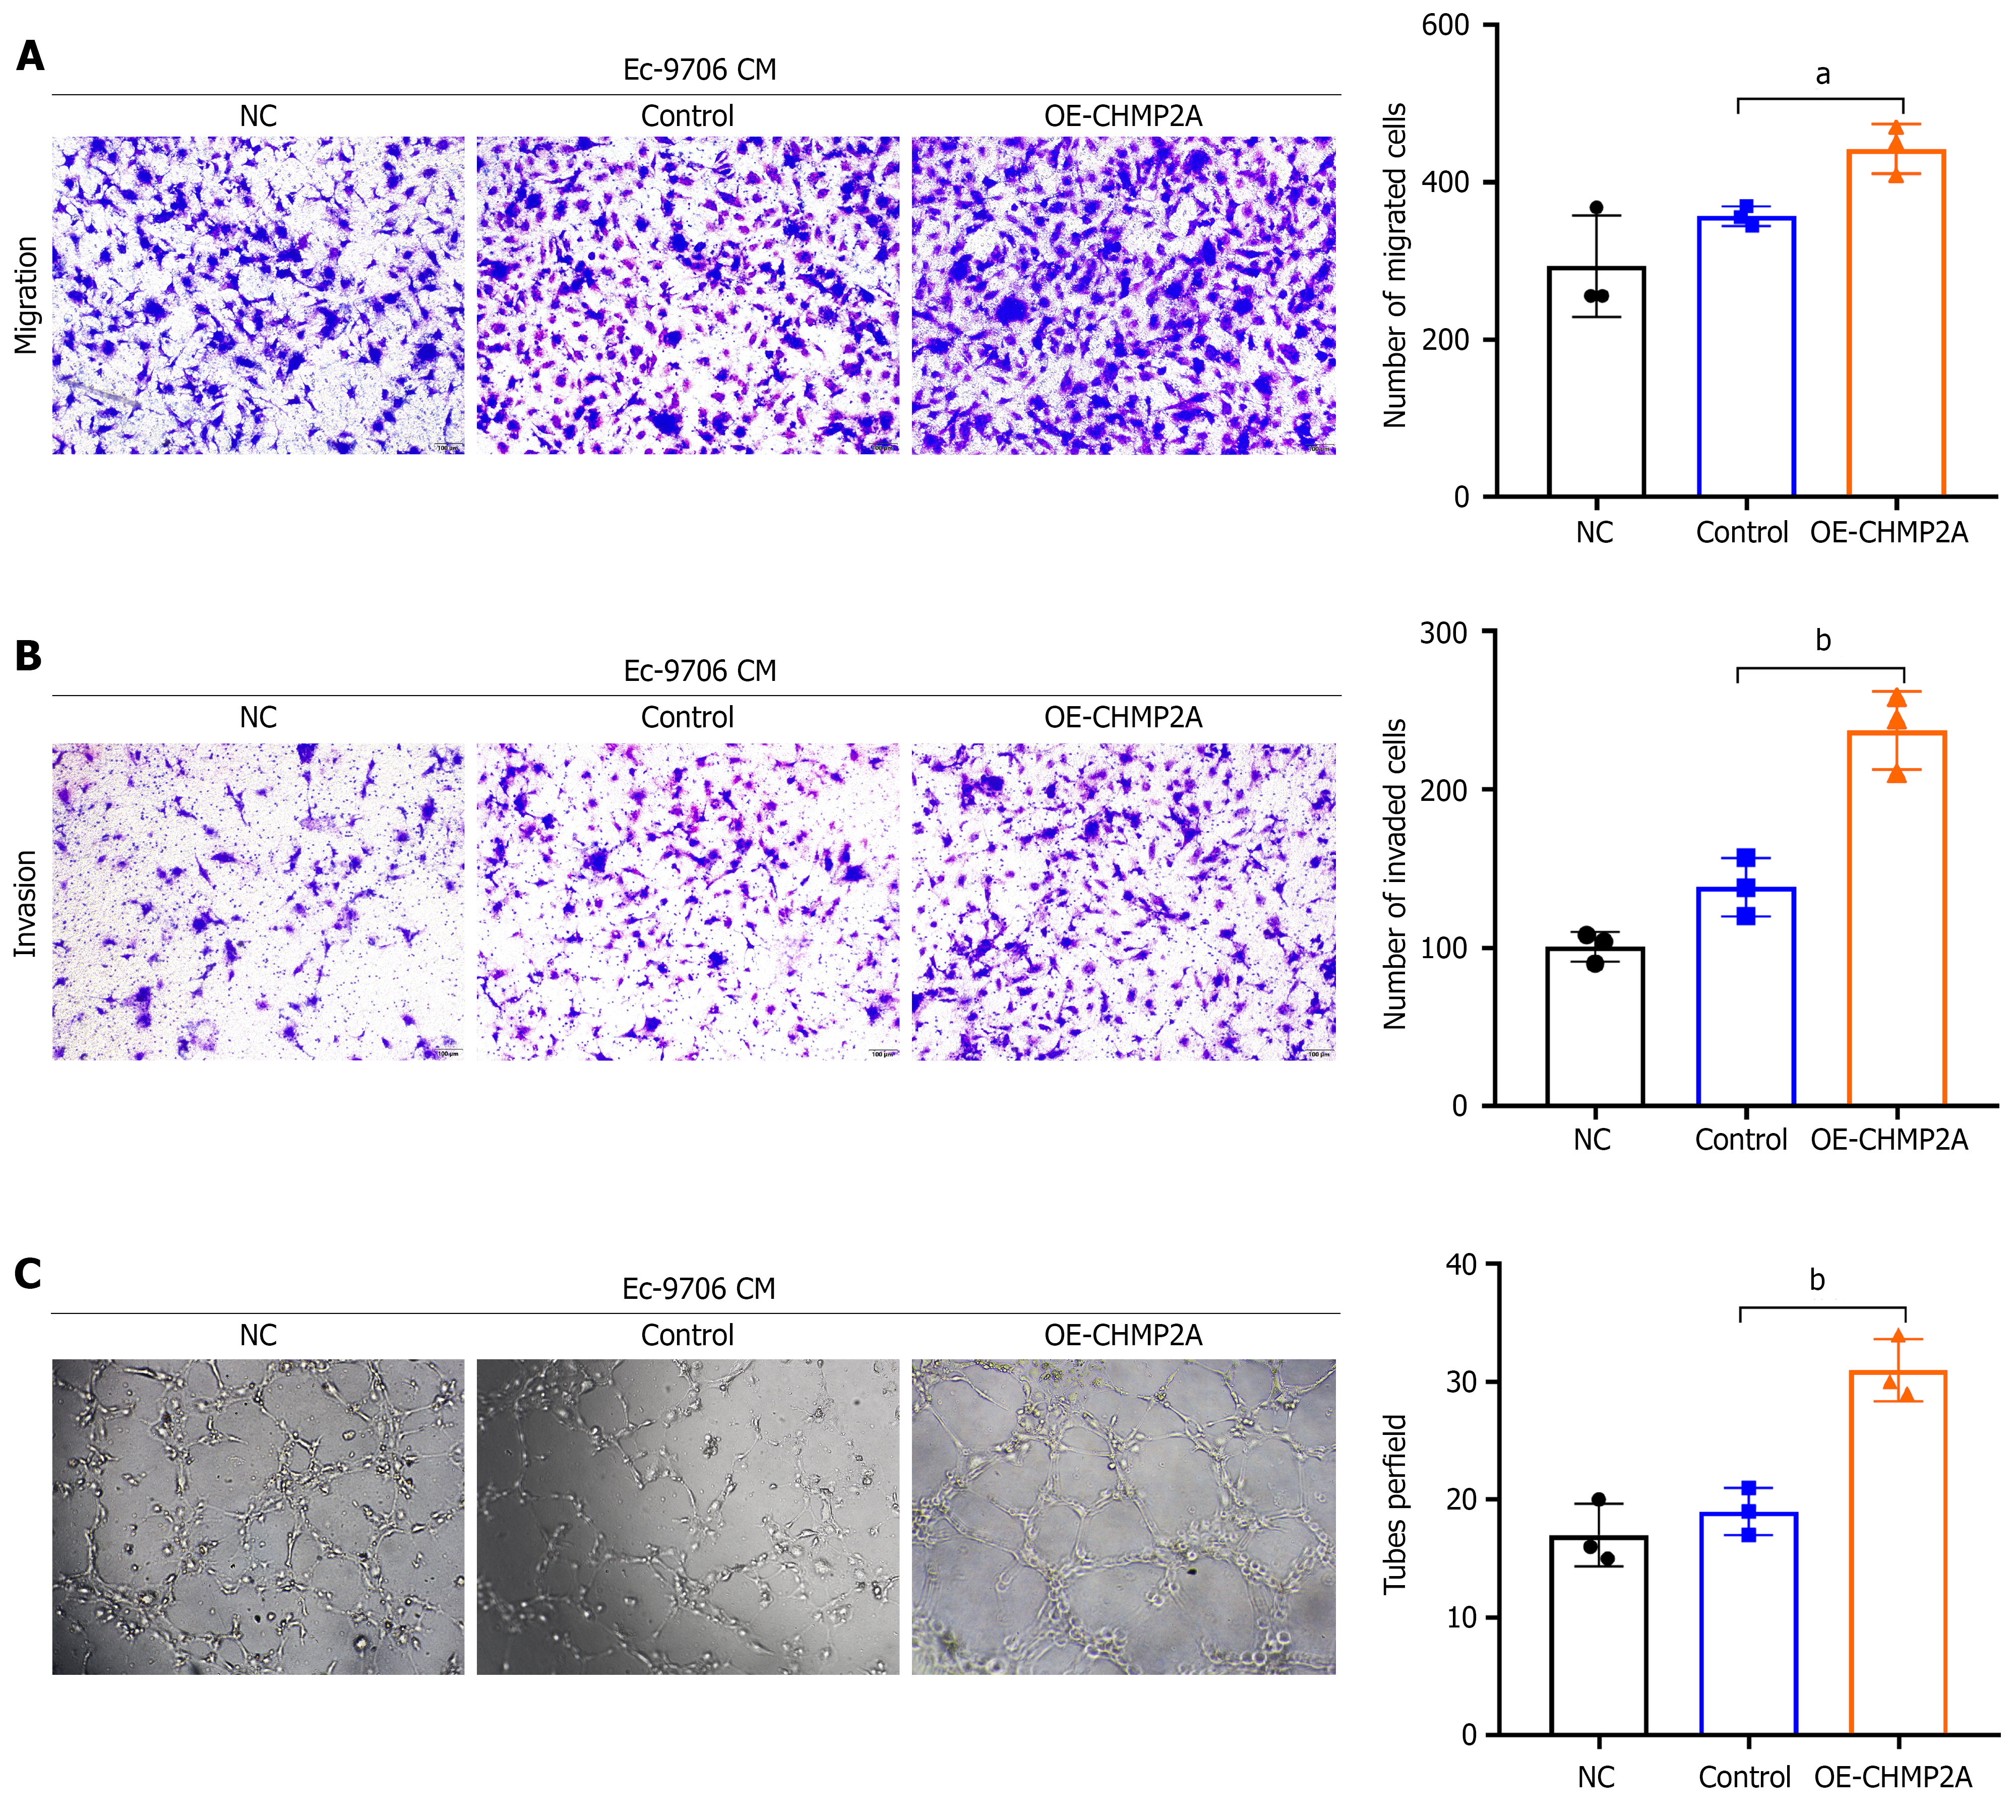
Figure 9 Elevated CHMP2A expression significantly promotes angiogenesis in esophageal squamous cell carcinoma.
A and B: Transwell test evaluating the impact of OE-CHMP2A conditioned medium (CM) on the migratory and invasive capabilities of human umbilical vein endothelial cells (HUVECs; n = 3); C: Tube formation assay detecting the effect of OE-CHMP2A CM on the tube formation of HUVECs (n = 3). aP < 0.05; bP < 0.01. CM: Conditioned medium.
- Citation: Ma LL, Hao MF, Chen MX, Lu YJ, Su JT, Tong S, Wang JW, Li X, Wei LY, Wang WW, Duan XX, Wang JS. CHMP2A as a potential prognostic biomarker for esophageal squamous cell carcinoma promotes tumor angiogenesis and cancer progression. World J Gastrointest Oncol 2026; 18(10): 121843
- URL: https://www.wjgnet.com/1948-5204/full/v18/i10/121843.htm
- DOI: https://dx.doi.org/10.4251/wjgo.121843