Copyright
©The Author(s) 2025.
World J Gastrointest Oncol. Jul 15, 2025; 17(7): 107211
Published online Jul 15, 2025. doi: 10.4251/wjgo.v17.i7.107211
Published online Jul 15, 2025. doi: 10.4251/wjgo.v17.i7.107211
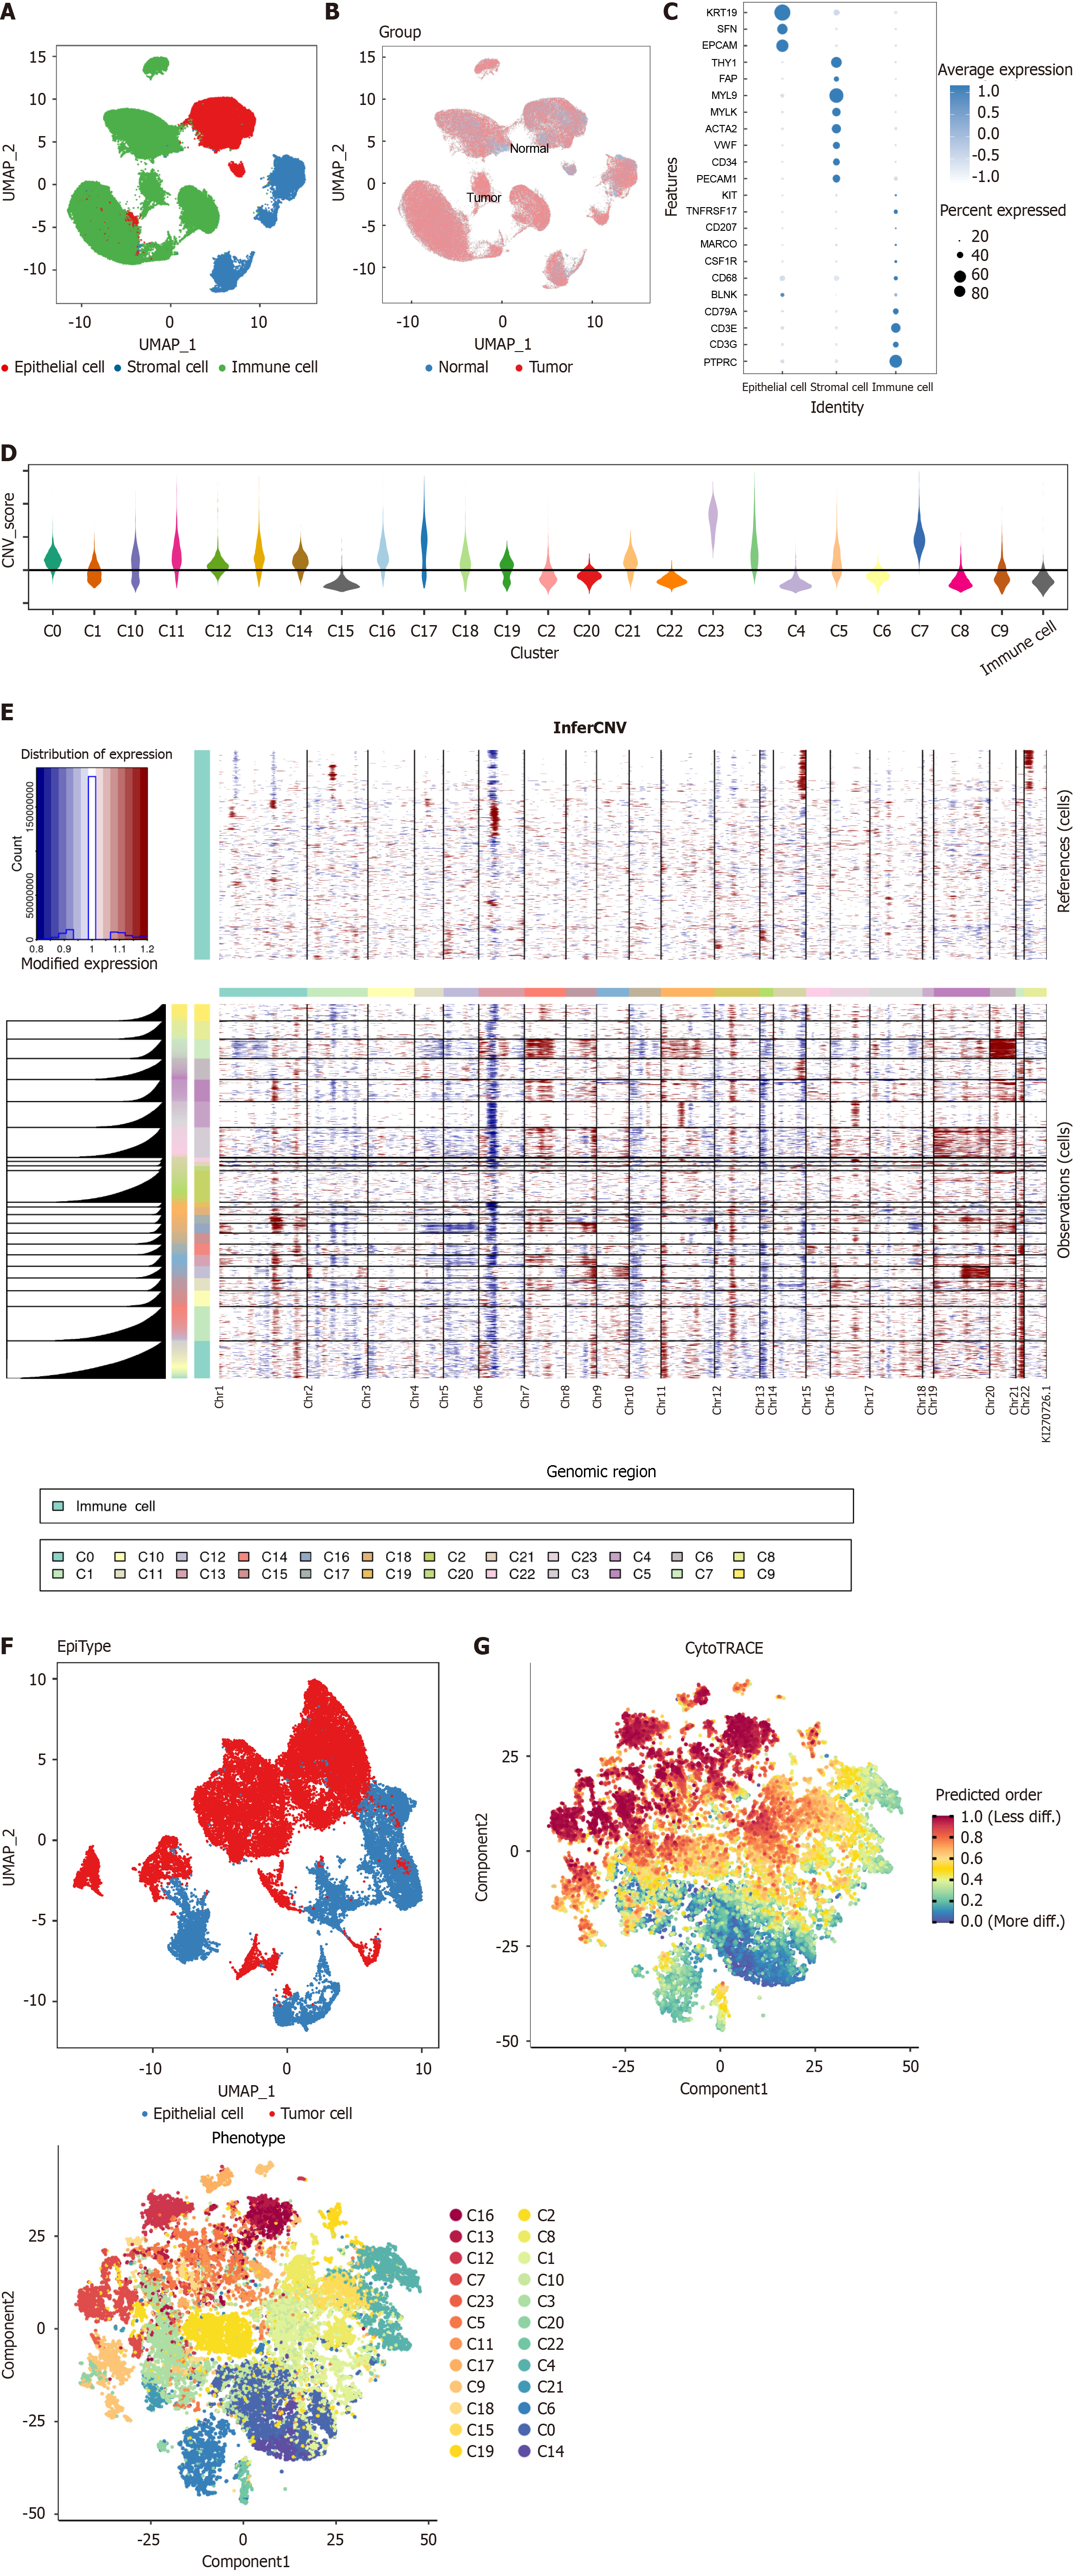
Figure 1 Single-cell analysis of gastric cancer dataset.
A: Uniform manifold approximation and projection (UMAP) visualization of identified cell populations within the gastric cancer (GC) dataset; B: UMAP representation showing the origin of tissues in the GC dataset; C: Dot plot illustrating the expression of marker genes used to identify different cell types; D: Copy number variation (CNV) scores for epithelial cell clusters, as predicted by inferCNV; E: Heatmap depicting CNV across epithelial cells; F: UMAP plot highlighting malignant cells as identified by inferCNV; G: Stemness scores across cells were determined using the Cytotrace algorithm.
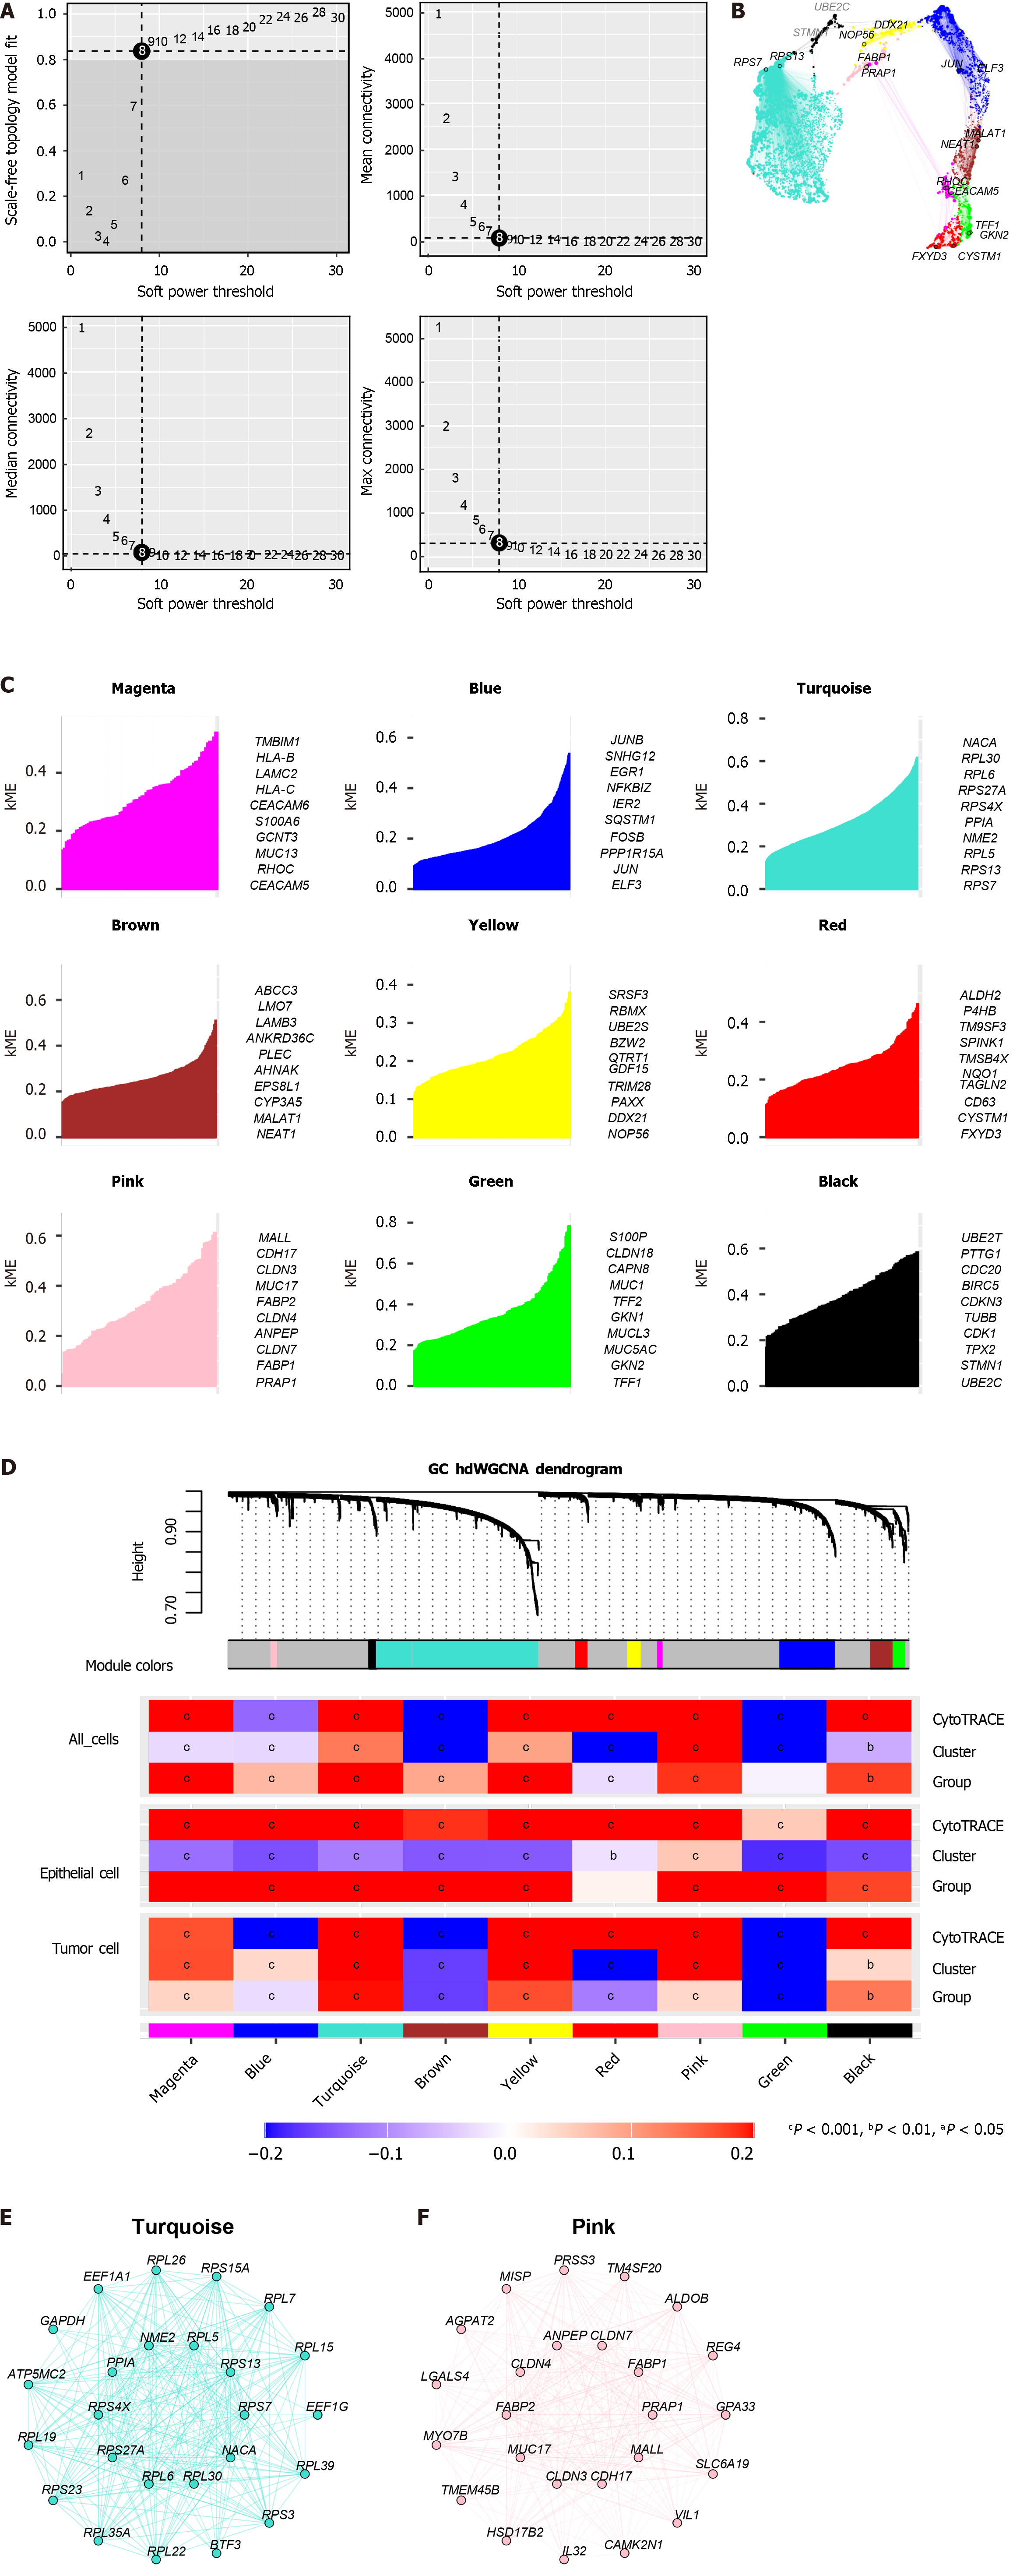
Figure 2 Development of optimal stemness modules via hierarchical weighted gene co-expression network analysis.
A: Selection of the best soft-thresholding power; B: Uniform manifold approximation and projection plot displaying the dimensionality reduction of nine identified modules; C: Representative genes from each module; D: Correlation analysis between stemness scores and modules; E: Gene-gene interaction network within the turquoise module; F: Gene-gene interaction network within the pink module.
Figure 3 Development of the gastric cancer stemness sensitivity model and functional enrichment analysis of Niemann-Pick type C2.
A: Univariate Cox regression analysis of module genes; B: Selection of optimal genes for prognosis prediction using LASSO regression; C: Multivariate Cox regression analysis of selected model genes; D: Comparison of gastric cancer stemness sensitivity (GCSS) scores, survival times, and model gene expression between high and low GCSS groups; E: Uniform manifold approximation and projection (UMAP) visualization of clustered tumor cells from scRNA-seq data; F: UMAP plots showing groups with high and low Niemann-Pick type C2 (NPC2) expression; G-I: Enrichment analyses for the NPC2 high-expression group across Gene Ontology (GO), Kyoto Encyclopedia of Genes and Genomes (KEGG), and other pathway datasets; J: Heatmap of differentially expressed genes between NPC2-high and -low groups from bulk RNA-seq; K and L: Enrichment analysis of differentially expressed genes in GO and KEGG.
Figure 4 Impact of Niemann-Pick type C2 on the biological characteristics of gastric cancer cells.
A: Western Blot analysis demonstrates that siRNA sequence Si-2 substantially reduced Niemann-Pick type C2 (NPC2) protein levels; B: Reduction in cell proliferation observed in AGS and HGC27 cell lines following NPC2 knockdown; C: Decrease in colony formation by AGS and HGC27 cells after NPC2 knockdown, indicating reduced clonogenic potential; D: Transwell invasion assays demonstrating that siNPC2-treated AGS and HGC27 cells exhibited reduction in migrated and invaded cell numbers compared to the NC. Scale bar: 200 μm; E: Spheroidization experiments showing a decrease in spheroid diameter and impaired spheroidization ability in AGS and HGC-27 cells following NPC2 knockdown; F: Reverse transcription-quantitative polymerase chain reaction profiling of stemness markers (SOX2, OCT4, CD133, NANOG) showing significant transcriptional downregulation in NPC2-depleted cells; G: Immunohistochemistry (IHC) analysis of NPC2 expression in gastric cancer (GC) tissues and adjacent non-cancerous tissues. A statistical representation of IHC results, summarizing NPC2 expression across different patient groups; H and I: NPC2-associated drug resistance in GC treatment was analyzed using Beyondcell.
Figure 5 Evaluation and analysis of the gastric cancer stemness sensitivity model.
A and B: Kaplan-Meier (KM) survival and receiver operating characteristic (ROC) curves for prognosis prediction in The Cancer Genome Atlas training set; C and D: KM survival and ROC curves for prognosis prediction in the GSE84437 validation set; E: Differences in the immune microenvironment between high and low gastric cancer stemness sensitivity (GCSS) score groups; F-I: Correlation analysis between GCSS scores and functional pathways, with enrichment shown in GO, HALLMARK, KEGG, and REACTOME databases. aP < 0.05, bP < 0.01, cP < 0.001. TCGA: The Cancer Genome Atlas; GCSS: Gastric cancer stemness sensitivity; KEGG: Encyclopedia of Genes and Genomes.
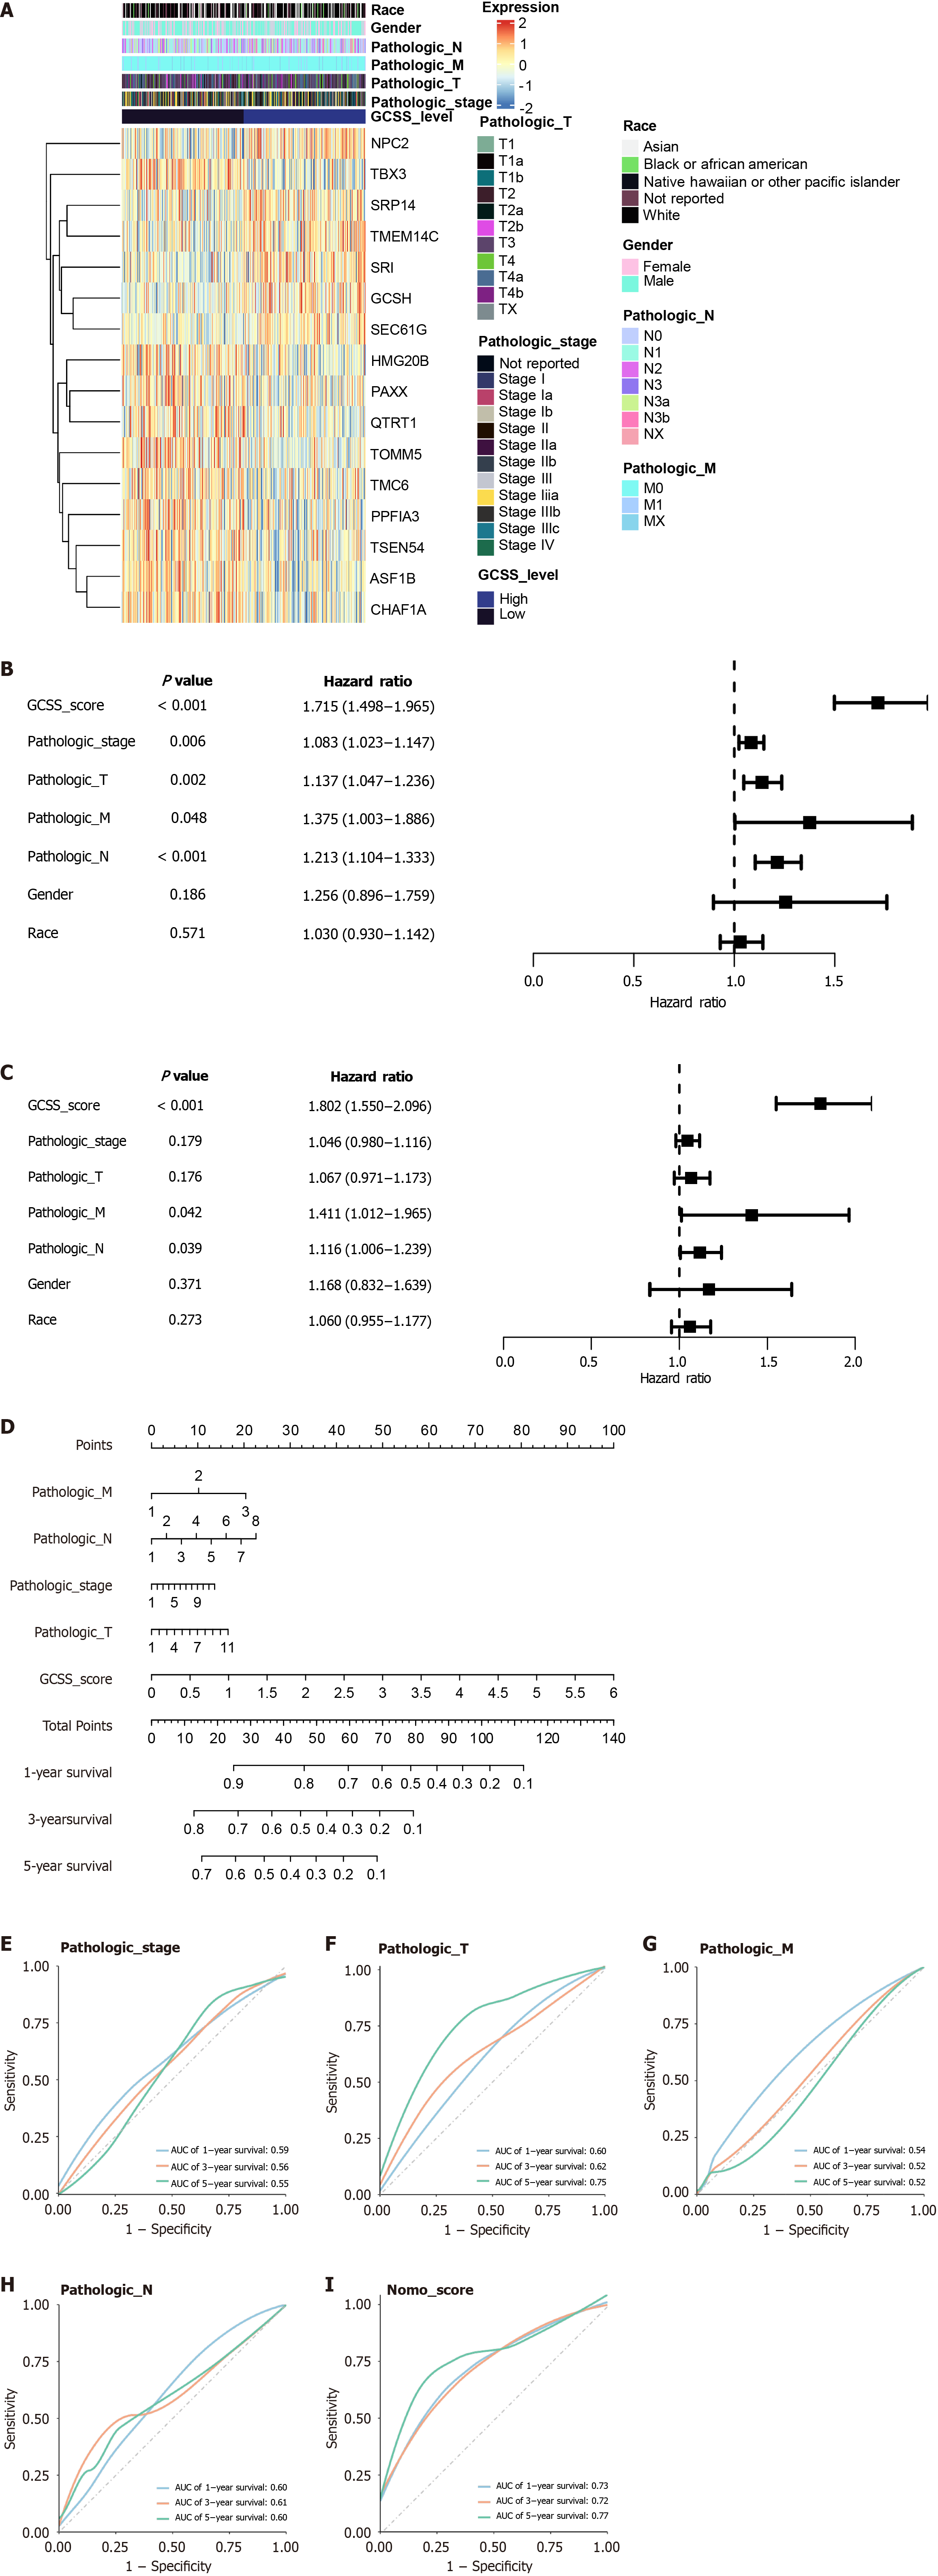
Figure 6 Integration and evaluation of clinical features with the gastric cancer stemness sensitivity model.
A: Heatmap displaying clinical features, GCSS gene expression, and gastric cancer stemness sensitivity (GCSS) levels; B: Forest plot from univariate Cox regression analysis of clinical features, GCSS gene, and GCSS score; C: Forest plot from multivariate Cox regression analysis detailing the impact of clinical features, GCSS gene, and GCSS score; D: Construction of a nomogram incorporating pathological stage, stages T, M, N, and GCSS score for prognosis prediction; E-I: Receiver operating characteristic curves assessing the predictive accuracy of the pathological stage (E), stage T (F), stage M (G), stage N (H), and nomogram score (I).
- Citation: Pu WF, Yang X, Wang XQ, Guo XG, Yang MY. Stemness signatures reflect prognostic disturbances in gastric cancer. World J Gastrointest Oncol 2025; 17(7): 107211
- URL: https://www.wjgnet.com/1948-5204/full/v17/i7/107211.htm
- DOI: https://dx.doi.org/10.4251/wjgo.v17.i7.107211


