Copyright
©The Author(s) 2025.
World J Gastrointest Oncol. Jul 15, 2025; 17(7): 107211
Published online Jul 15, 2025. doi: 10.4251/wjgo.v17.i7.107211
Published online Jul 15, 2025. doi: 10.4251/wjgo.v17.i7.107211
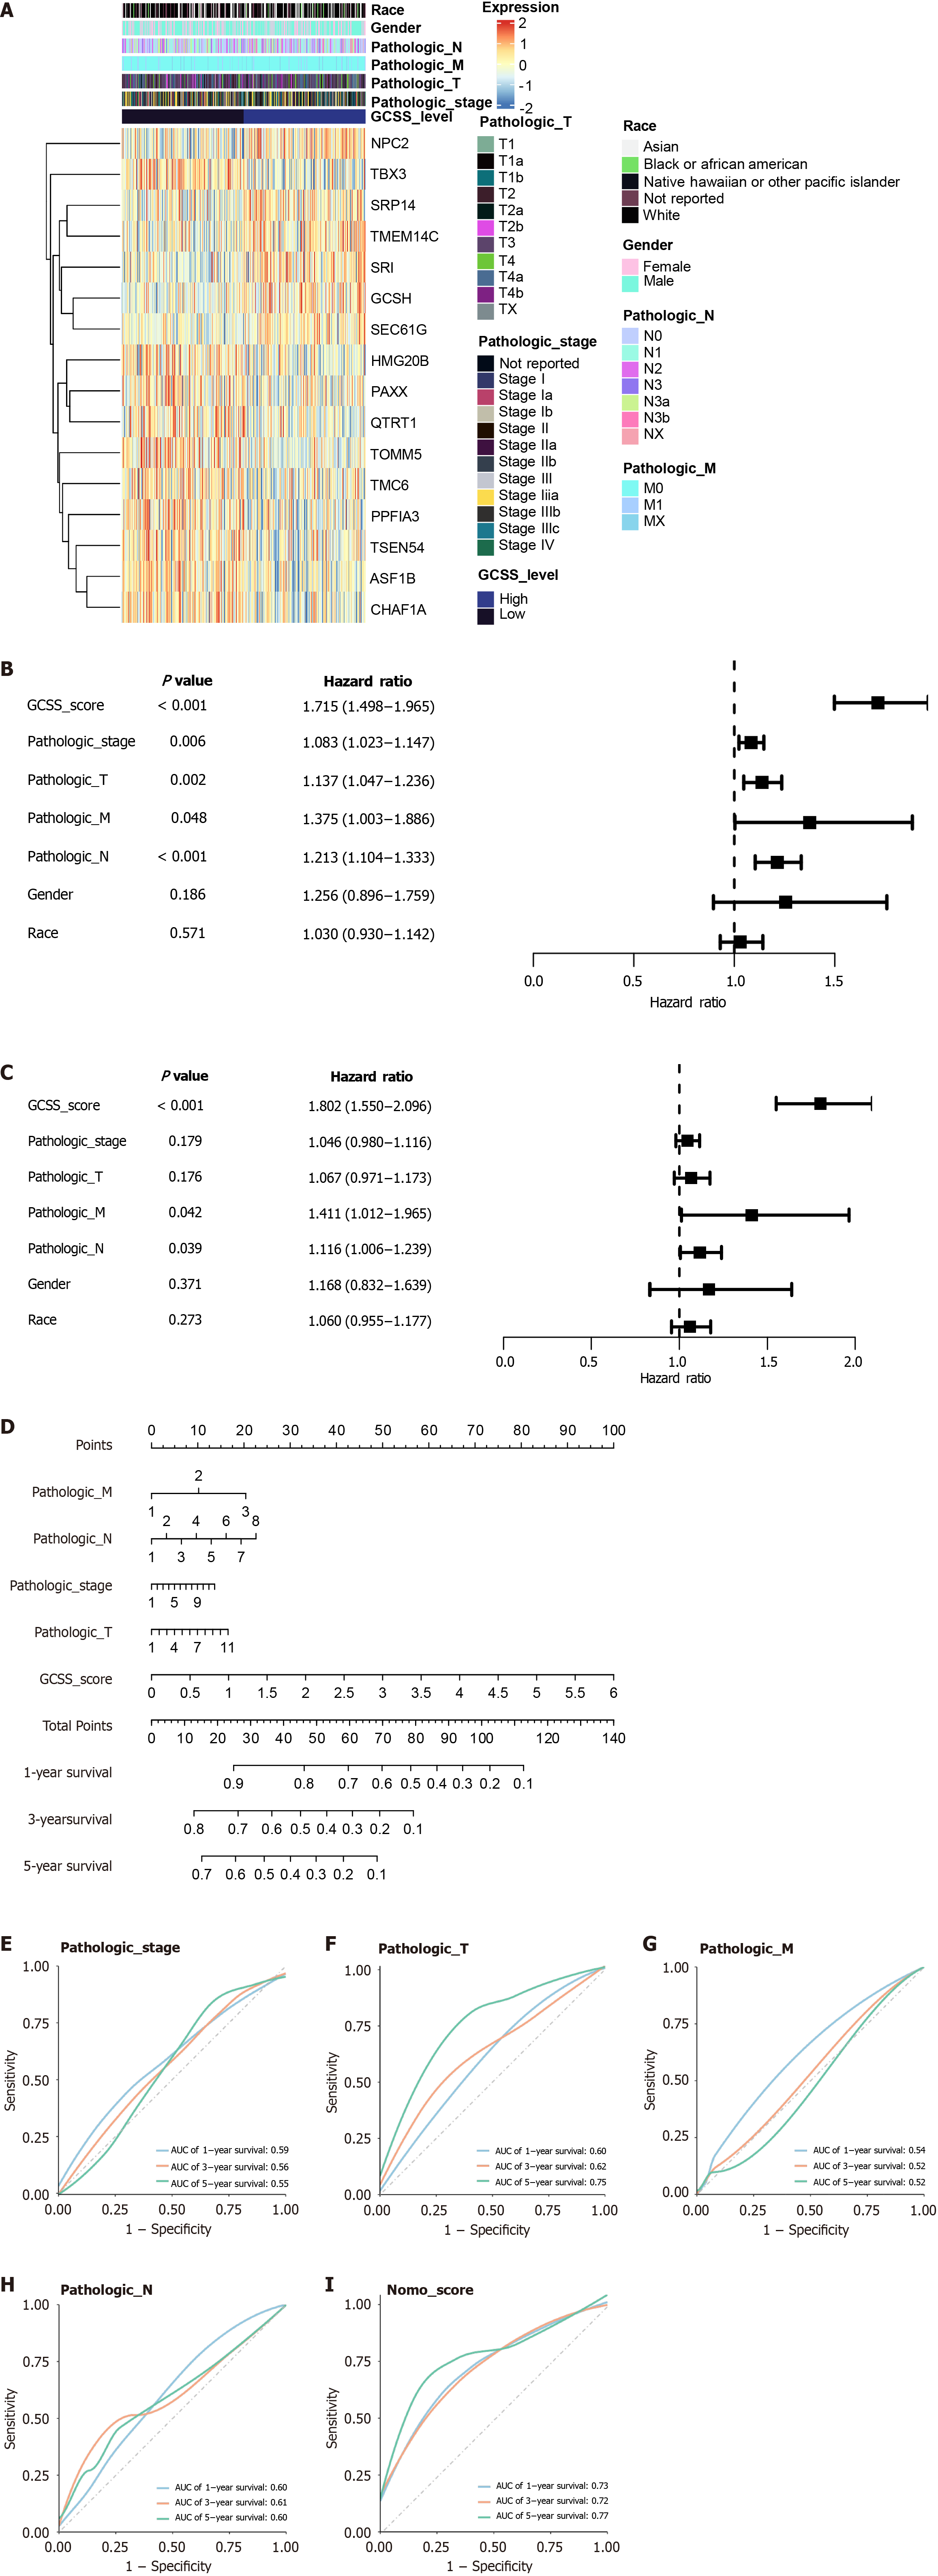
Figure 6 Integration and evaluation of clinical features with the gastric cancer stemness sensitivity model.
A: Heatmap displaying clinical features, GCSS gene expression, and gastric cancer stemness sensitivity (GCSS) levels; B: Forest plot from univariate Cox regression analysis of clinical features, GCSS gene, and GCSS score; C: Forest plot from multivariate Cox regression analysis detailing the impact of clinical features, GCSS gene, and GCSS score; D: Construction of a nomogram incorporating pathological stage, stages T, M, N, and GCSS score for prognosis prediction; E-I: Receiver operating characteristic curves assessing the predictive accuracy of the pathological stage (E), stage T (F), stage M (G), stage N (H), and nomogram score (I).
- Citation: Pu WF, Yang X, Wang XQ, Guo XG, Yang MY. Stemness signatures reflect prognostic disturbances in gastric cancer. World J Gastrointest Oncol 2025; 17(7): 107211
- URL: https://www.wjgnet.com/1948-5204/full/v17/i7/107211.htm
- DOI: https://dx.doi.org/10.4251/wjgo.v17.i7.107211


