Copyright
©The Author(s) 2025.
World J Gastrointest Oncol. Jul 15, 2025; 17(7): 107211
Published online Jul 15, 2025. doi: 10.4251/wjgo.v17.i7.107211
Published online Jul 15, 2025. doi: 10.4251/wjgo.v17.i7.107211
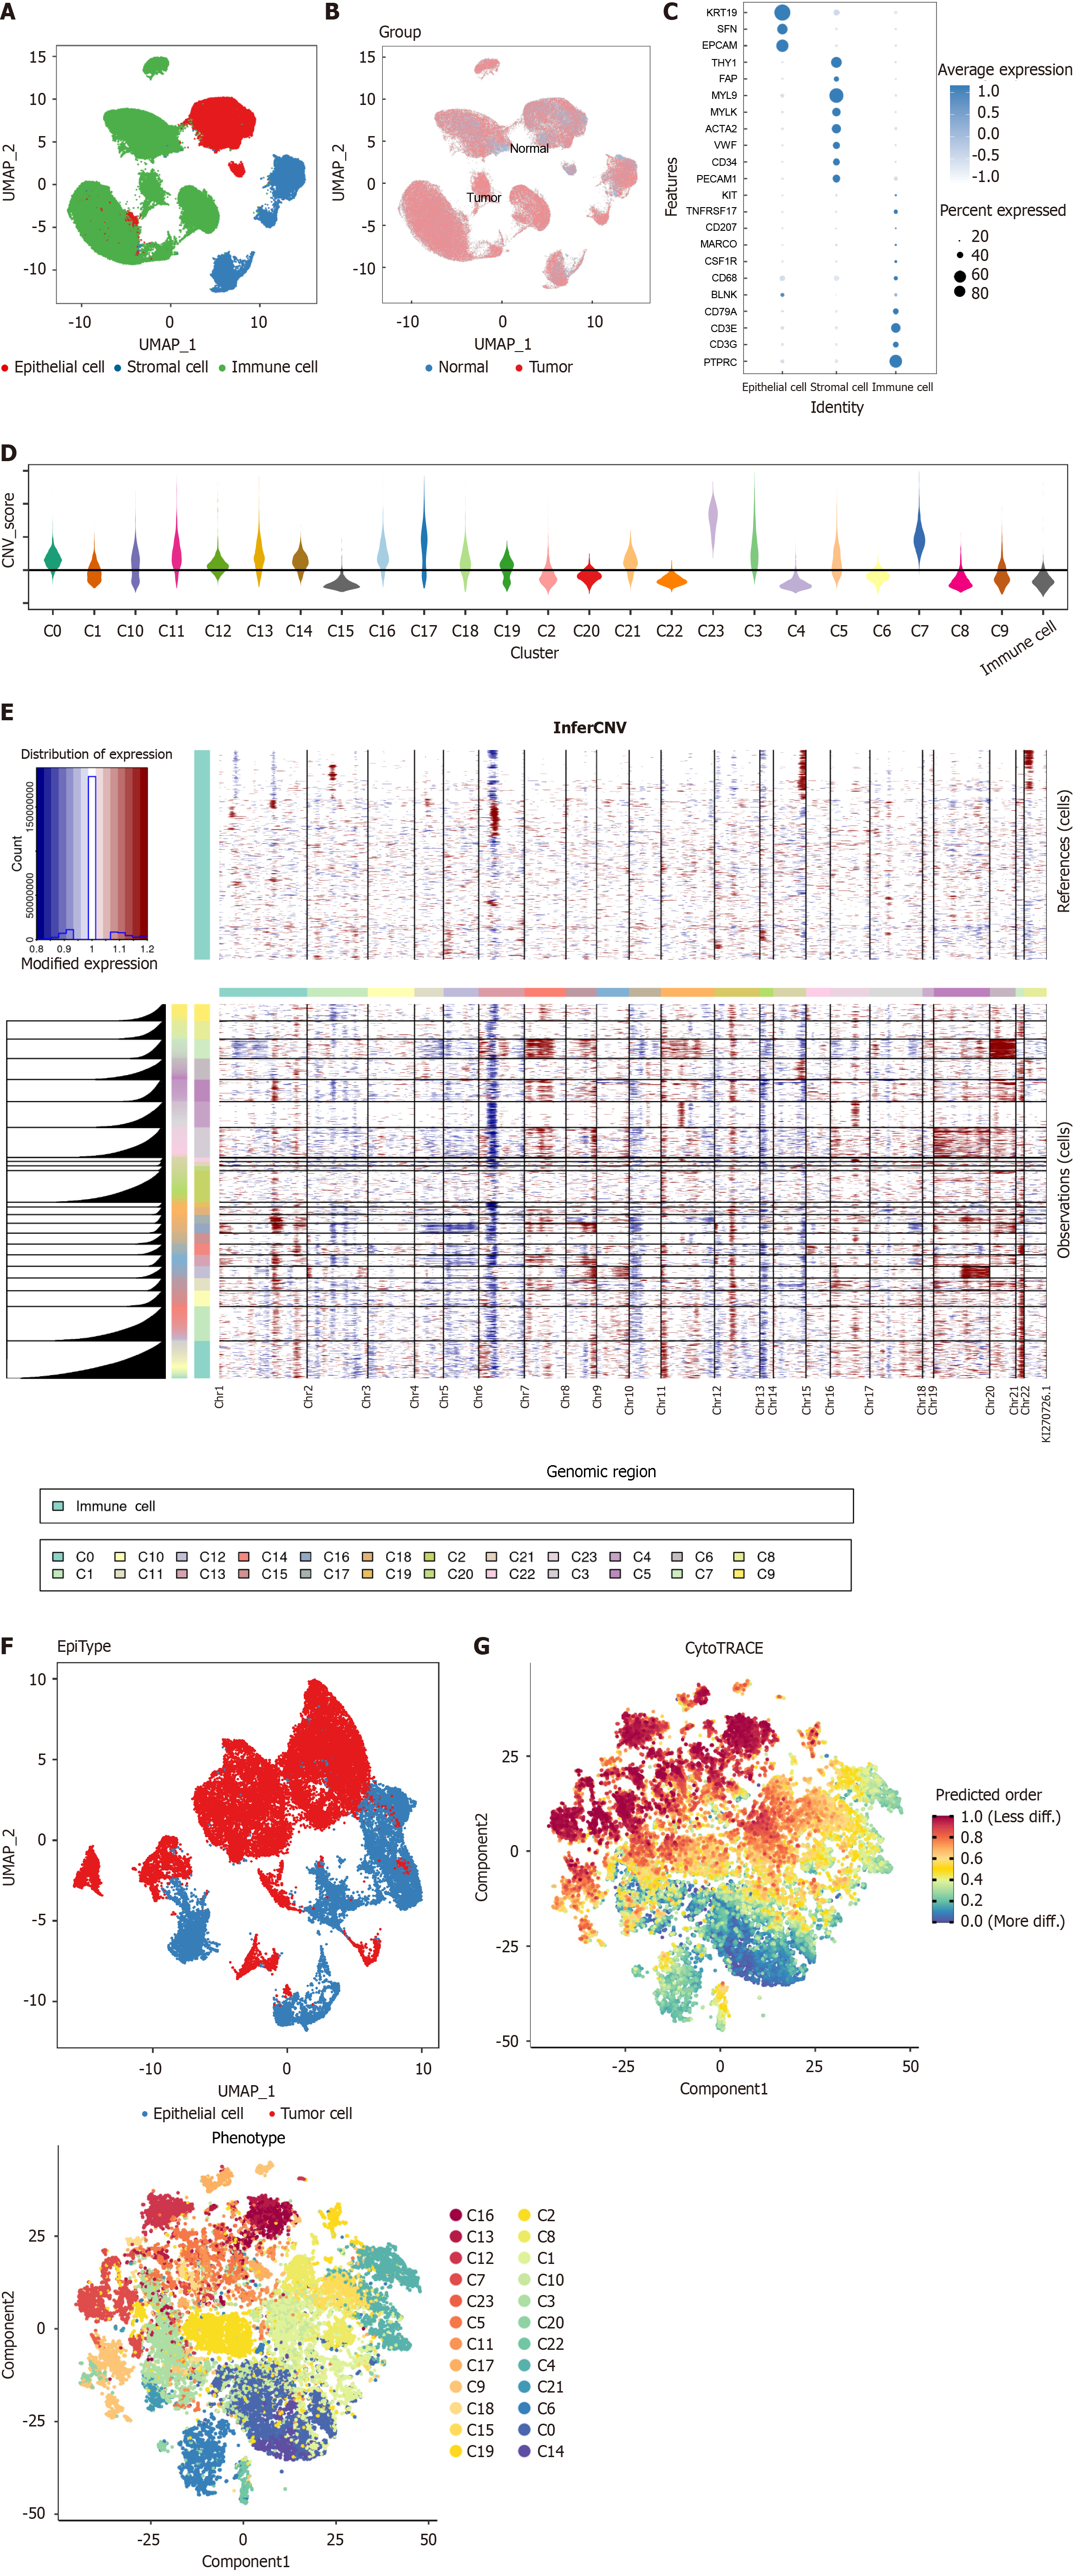
Figure 1 Single-cell analysis of gastric cancer dataset.
A: Uniform manifold approximation and projection (UMAP) visualization of identified cell populations within the gastric cancer (GC) dataset; B: UMAP representation showing the origin of tissues in the GC dataset; C: Dot plot illustrating the expression of marker genes used to identify different cell types; D: Copy number variation (CNV) scores for epithelial cell clusters, as predicted by inferCNV; E: Heatmap depicting CNV across epithelial cells; F: UMAP plot highlighting malignant cells as identified by inferCNV; G: Stemness scores across cells were determined using the Cytotrace algorithm.
- Citation: Pu WF, Yang X, Wang XQ, Guo XG, Yang MY. Stemness signatures reflect prognostic disturbances in gastric cancer. World J Gastrointest Oncol 2025; 17(7): 107211
- URL: https://www.wjgnet.com/1948-5204/full/v17/i7/107211.htm
- DOI: https://dx.doi.org/10.4251/wjgo.v17.i7.107211


