Copyright
©The Author(s) 2025.
World J Gastrointest Oncol. May 15, 2025; 17(5): 105311
Published online May 15, 2025. doi: 10.4251/wjgo.v17.i5.105311
Published online May 15, 2025. doi: 10.4251/wjgo.v17.i5.105311
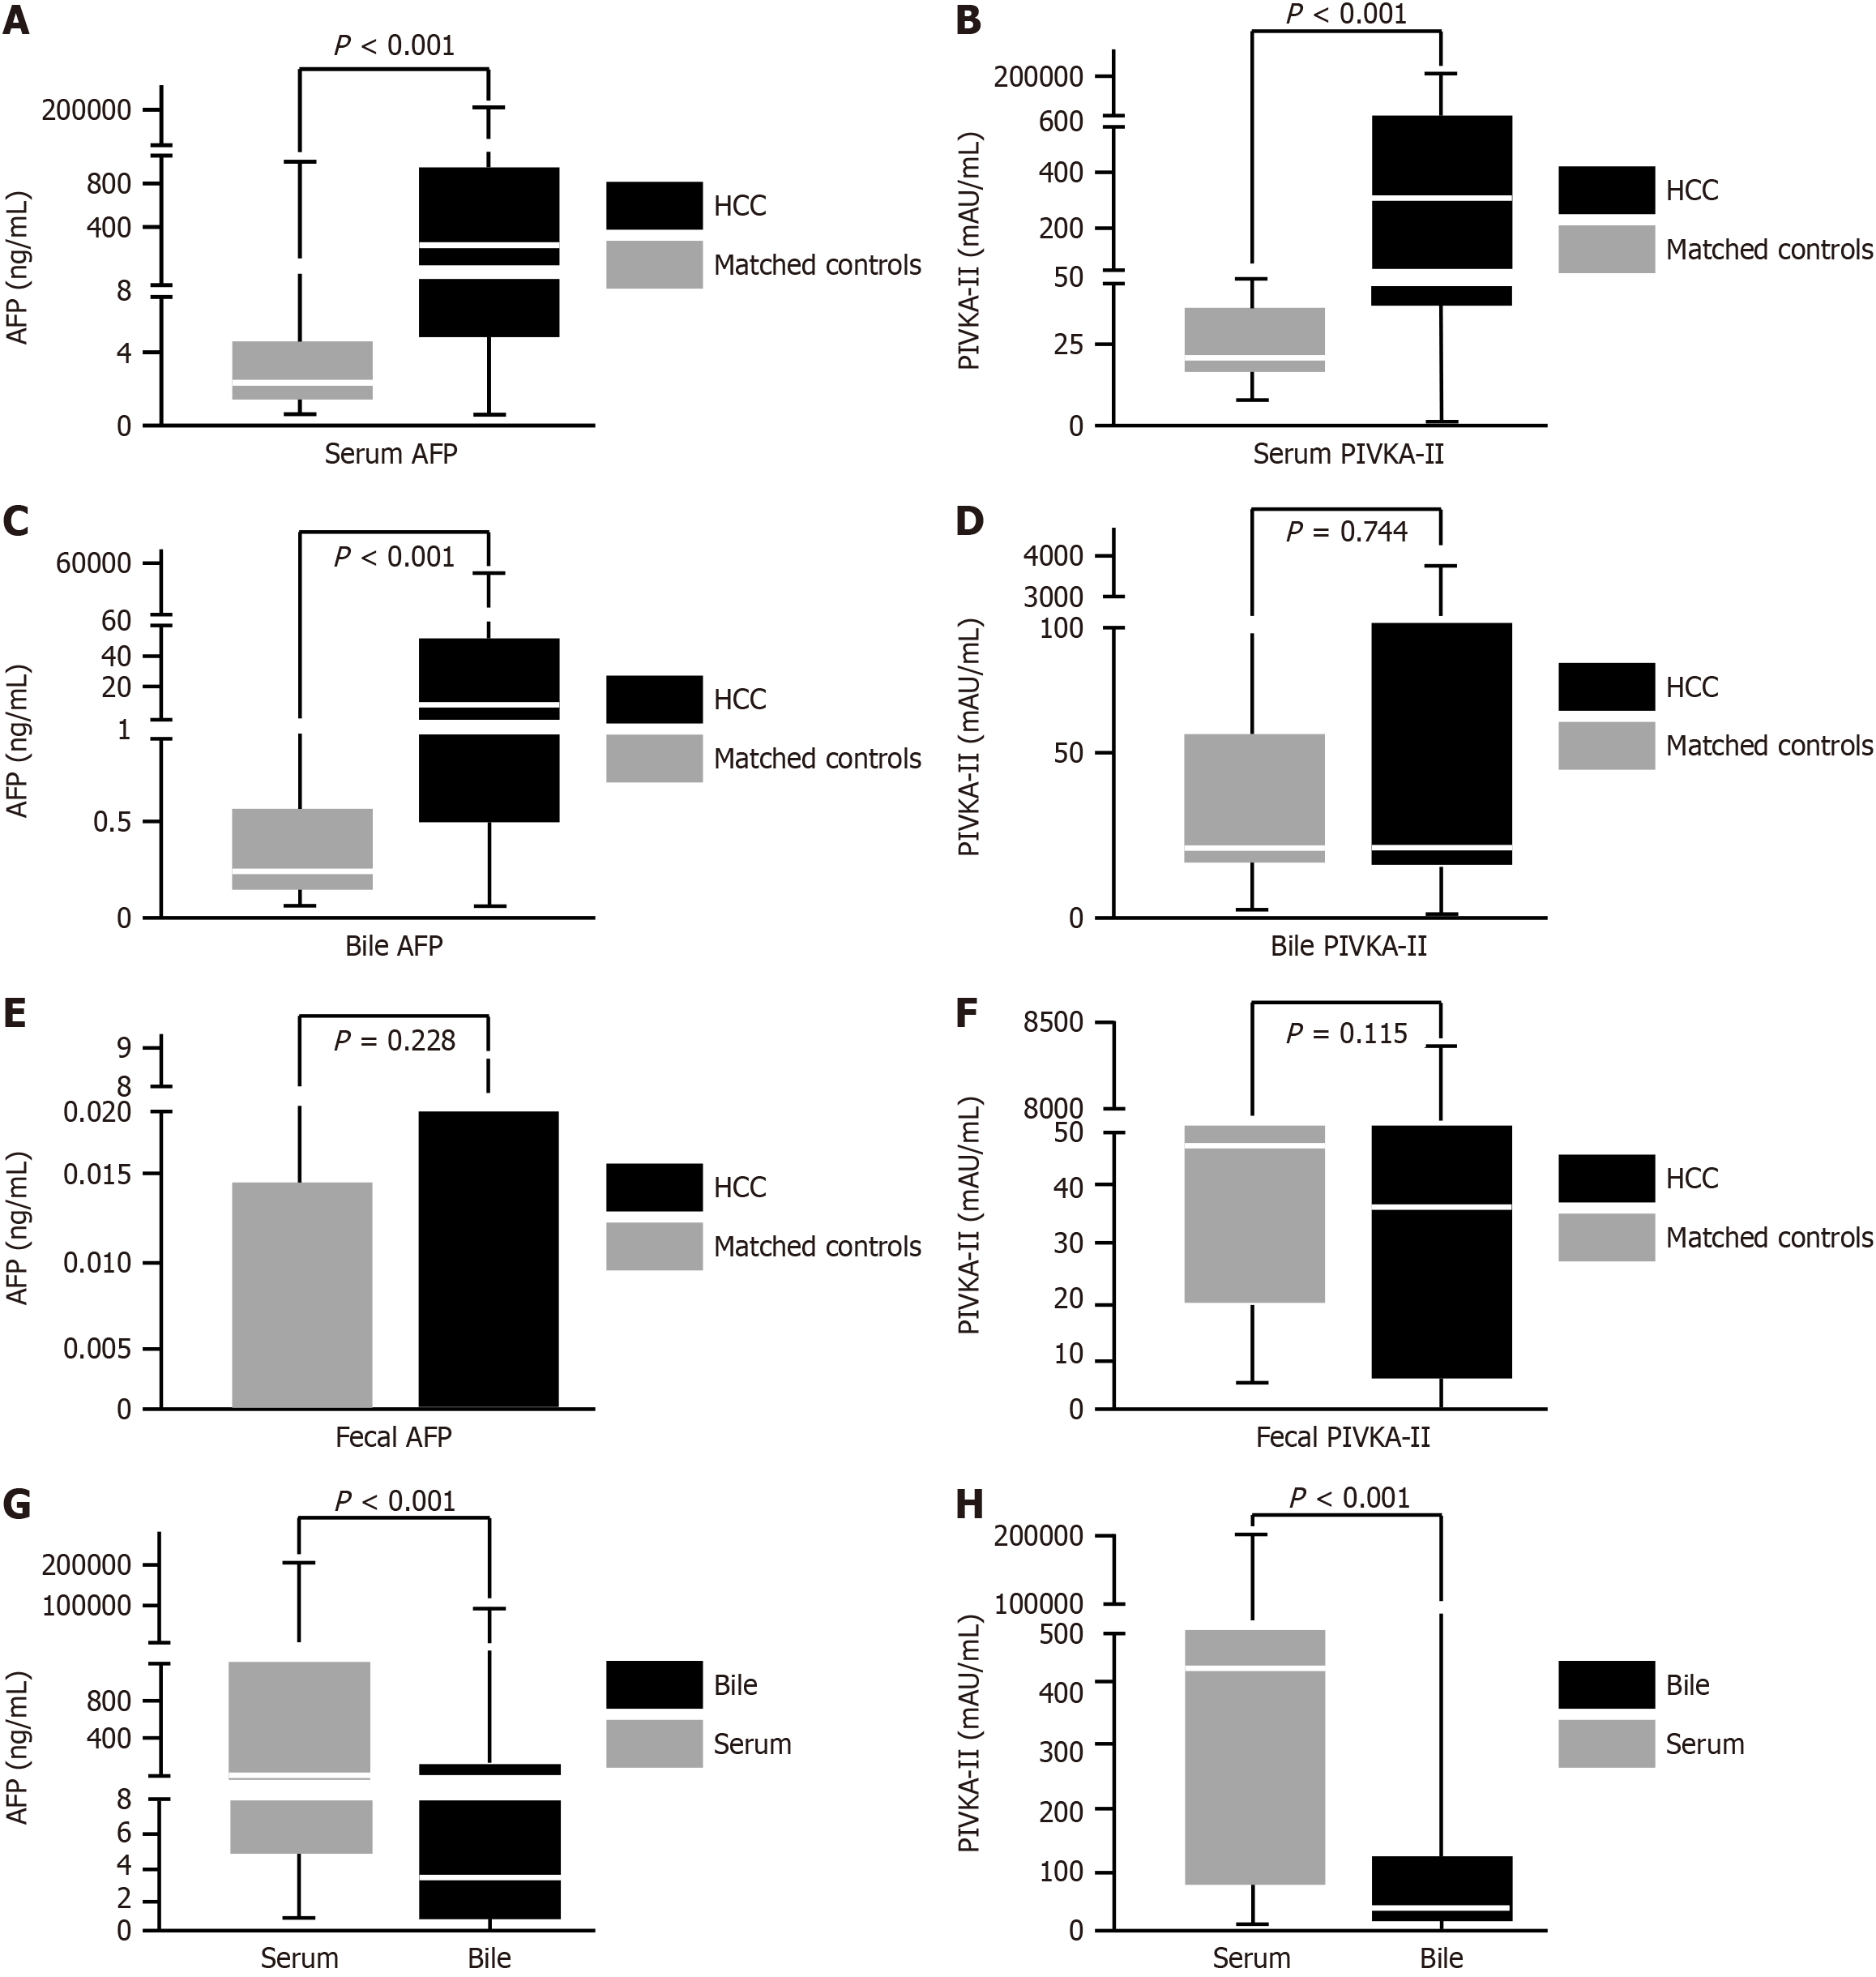
Figure 1 Differences in tumor marker levels among sample types.
A-F: Differences in tumor markers in blood, bile, and feces of patients with hepatocellular carcinoma (HCC) and non-HCC; G and H: Comparative analysis of alpha-fetoprotein (AFP) and prothrombin induced by vitamin K absence-II (PIVKA-II) levels in blood and bile among patients with HCC.
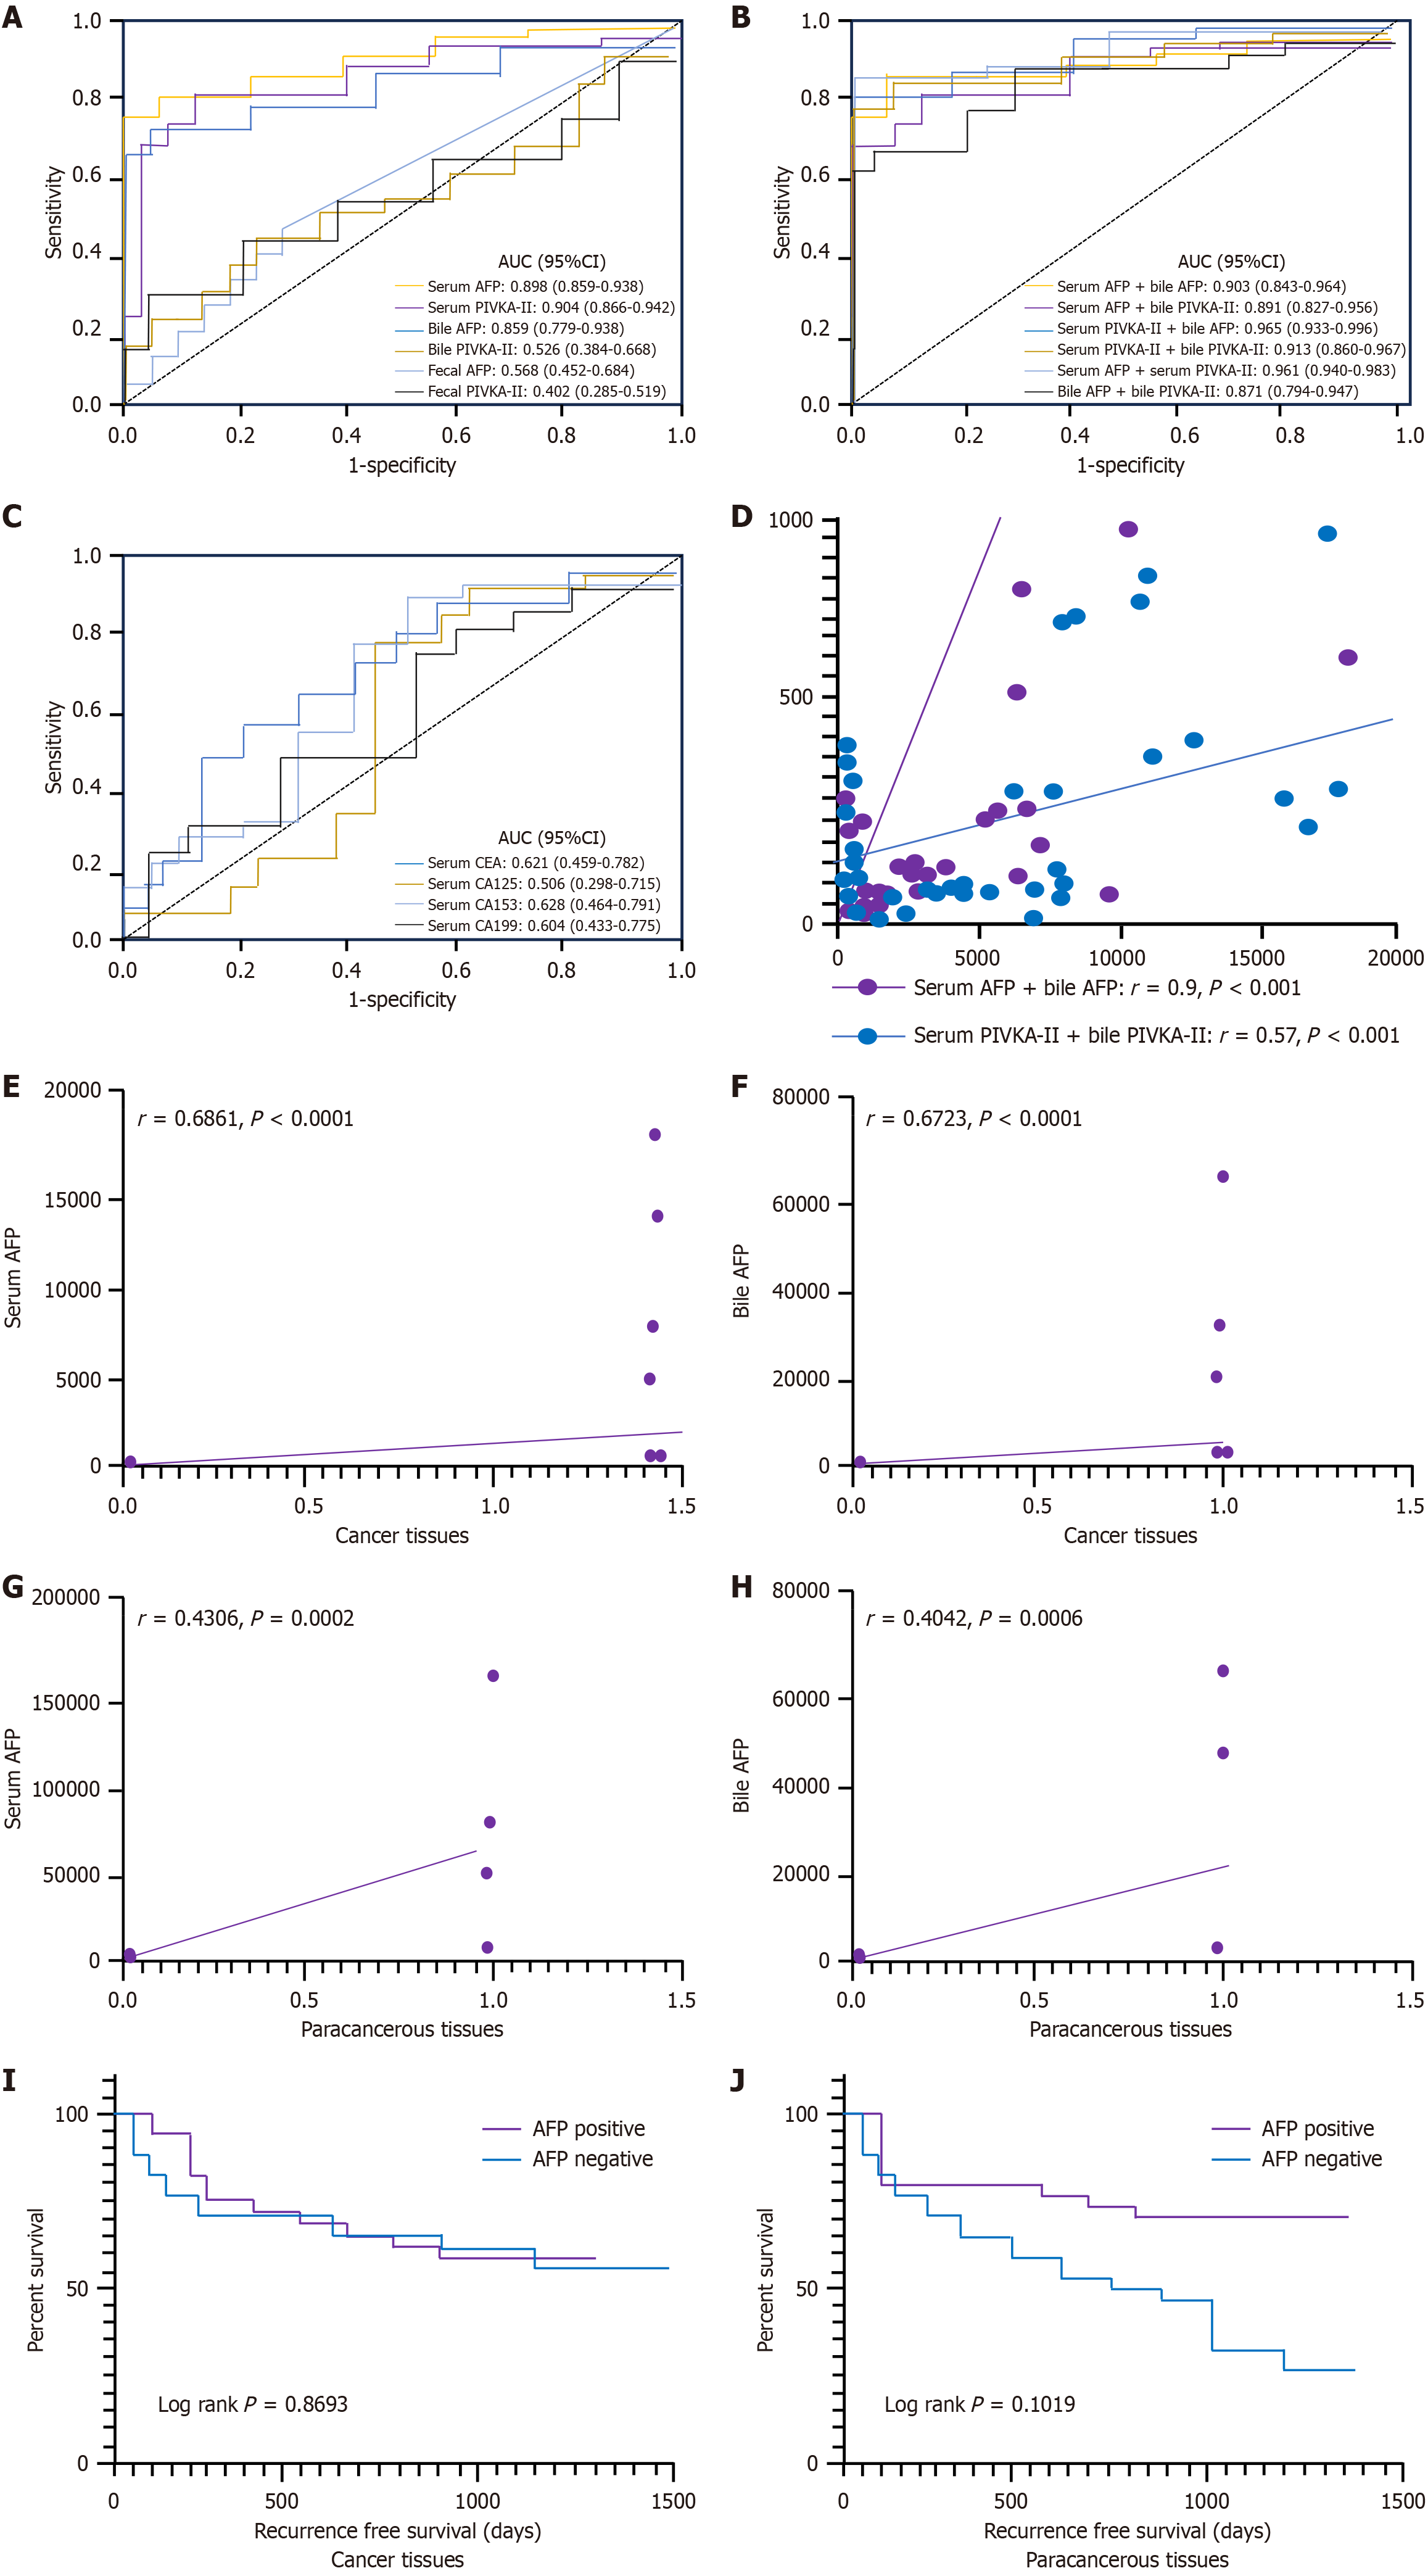
Figure 2 Diagnostic efficacy, correlation coefficients of tumor markers, immunohistochemical analysis, and recurrence-free survival analysis.
A: Receiver operating characteristic (ROC) curve for hepatocellular carcinoma (HCC) diagnosis using alpha-fetoprotein (AFP) or prothrombin induced by vitamin K absence-II (PIVKA-II) in serum, bile, and feces; B: ROC curve for HCC diagnosis using the combination of AFP and PIVKA-II in serum and bile; C: ROC curve for the HCC diagnosis using carcinoembryonic antigen (CEA), carbohydrate antigen 125 (CA125), CA153, and CA19-9 in serum; D: Correlation coefficient between serum AFP, PIVKA-II, and bile AFP; E: Correlation analysis of AFP expression in tumor tissues and serum AFP levels; F: Correlation analysis between AFP expression in tumor tissues and bile AFP levels; G: Correlation analysis between AFP expression in paracancerous tissue and serum AFP levels; H: Correlation analysis between AFP expression in paracancerous tissue and bile AFP levels; I: Recurrence-free survival analysis using AFP immunohistochemistry in tumor tissue for serum in patients with AFP-positive HCC; J: Recurrence-free survival analysis using AFP immunohistochemistry in paracancerous tissue for serum in patients with AFP-positive HCC. AUC: Area under the curve; CI: Confidence interval.
Figure 3 Immunohistochemical analysis of alpha-fetoprotein in hepatocellular carcinoma and the structural relationship between alpha-fetoprotein and the spatial distribution of bile ducts.
A: Alpha-fetoprotein (AFP) immunohistochemistry in tumor tissue; B: AFP immunohistochemistry in paraneoplastic tissue; C: Negative AFP immunohistochemistry result in tumor tissue, with scattered enhancement in some areas; D: AFP immunohistochemistry results; E: Cytokeratin 7 immunohistochemistry results. A-C from left to right: 100 ×, 200 ×, 400 × magnifications; D and E from left to right: 100 ×, 100 ×, 200 × magnifications.
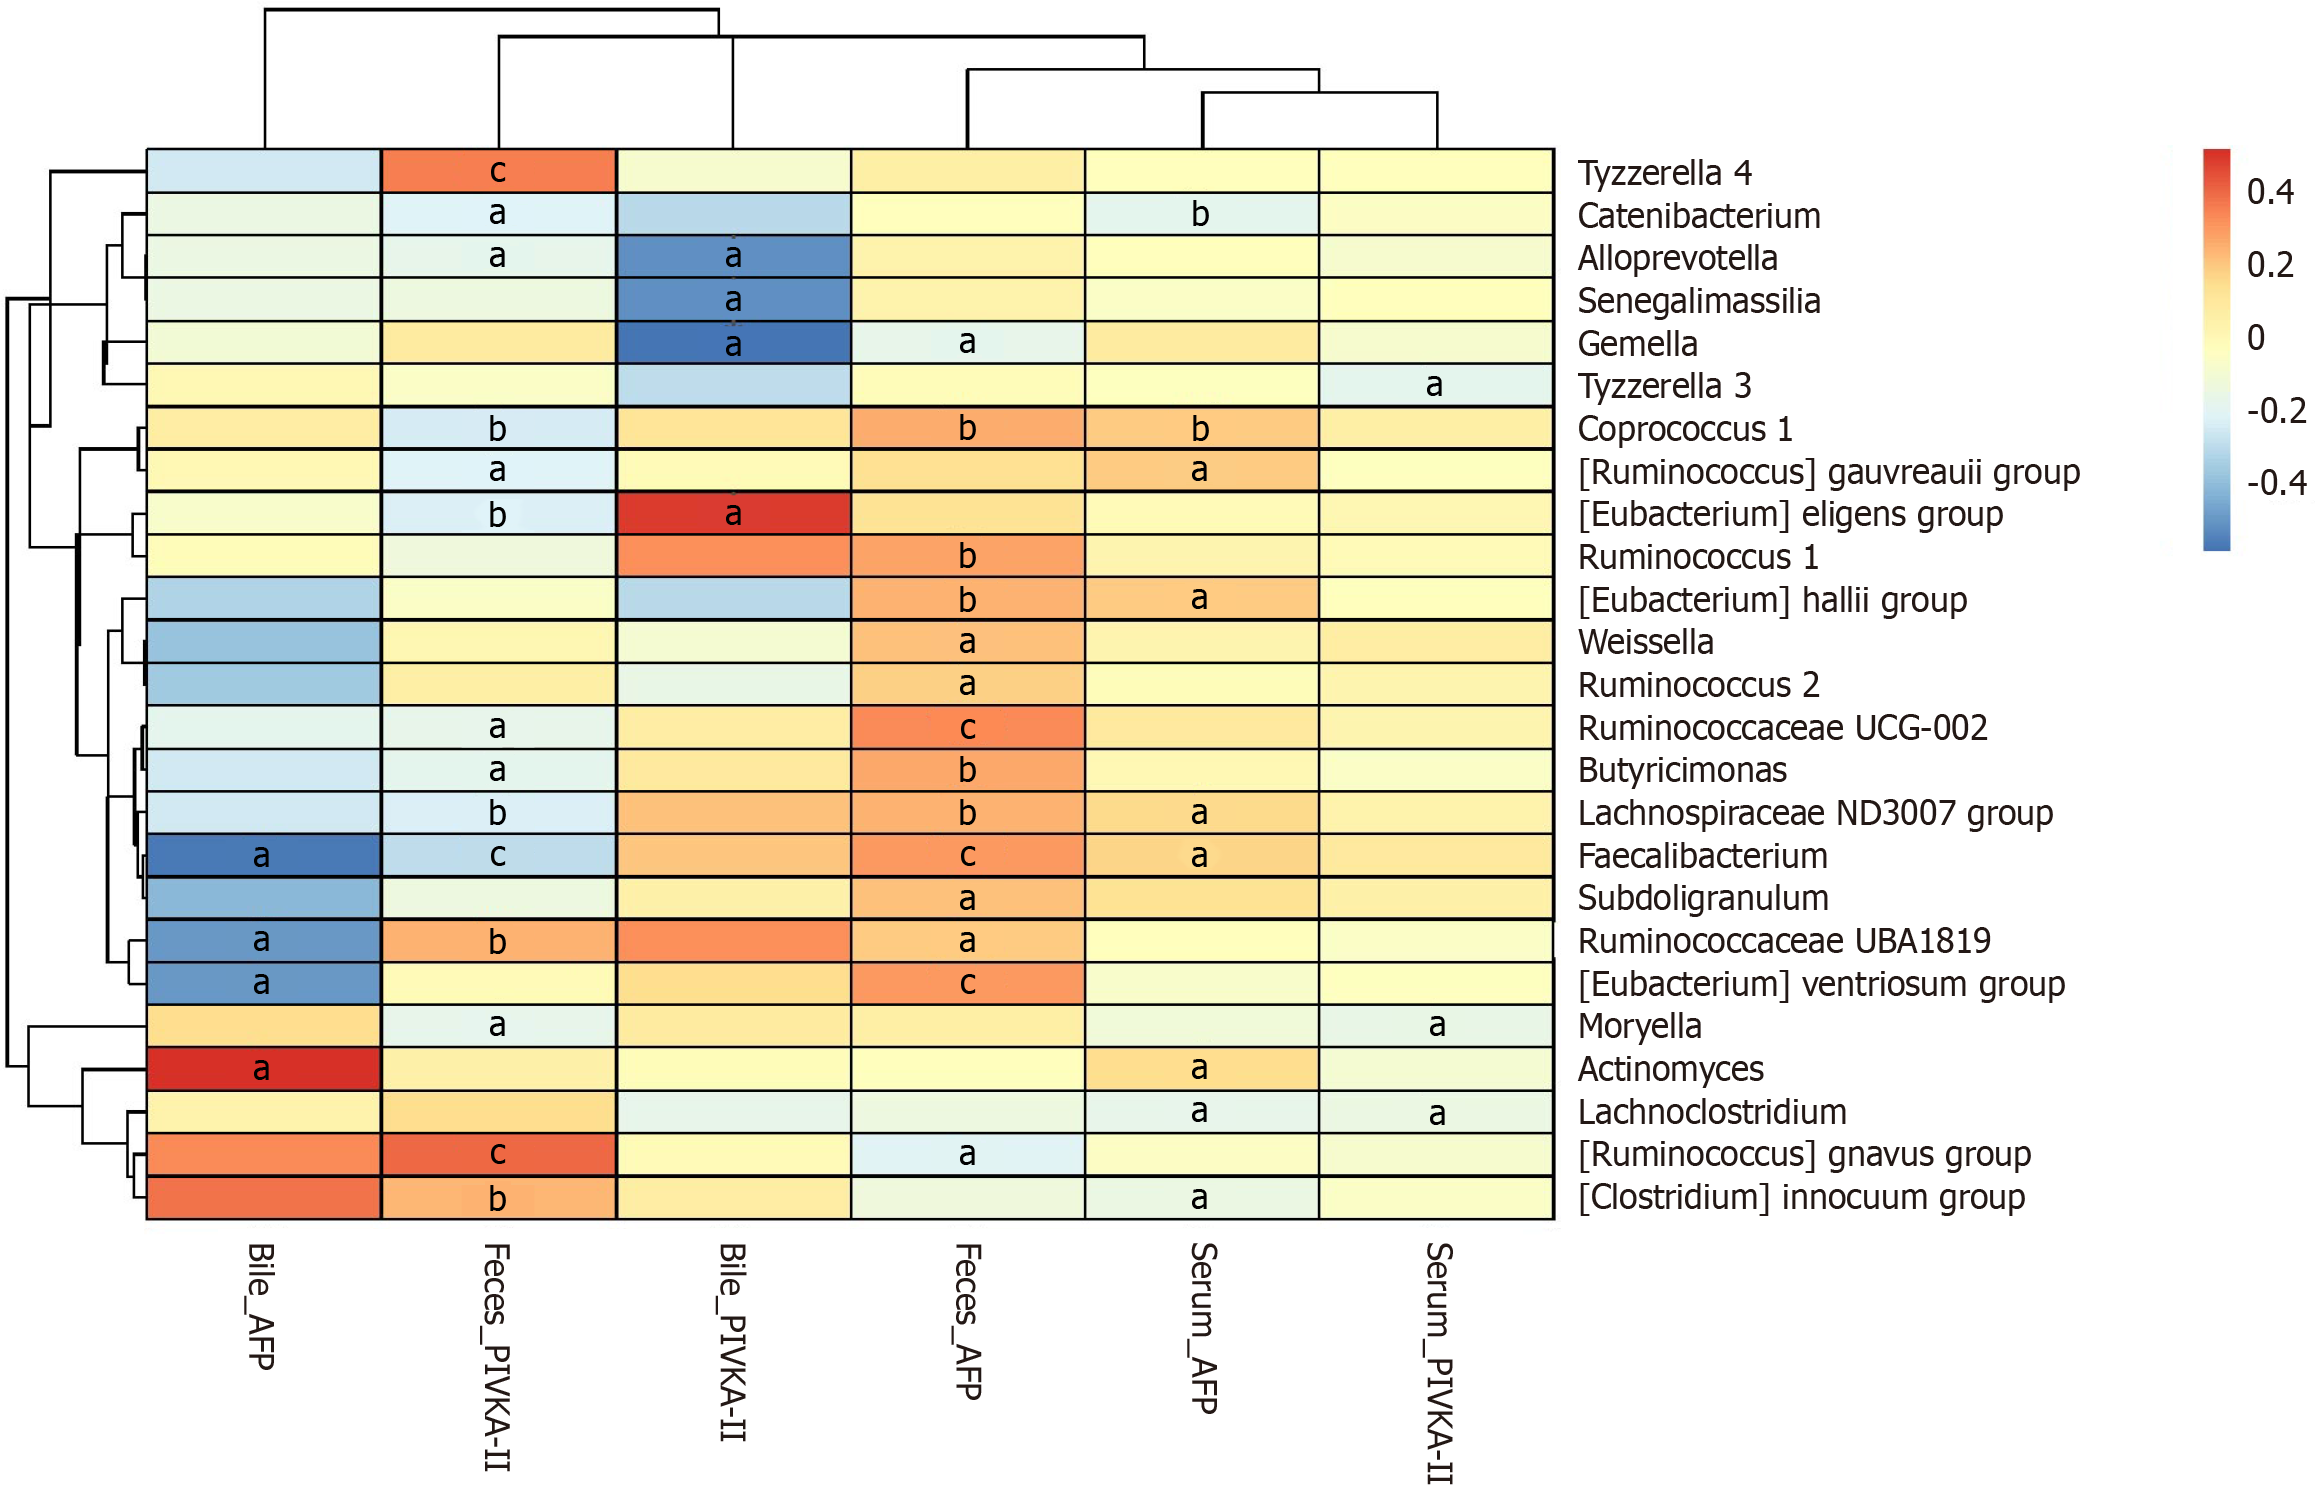
Figure 4 Correlation analysis of gut microbiota and tumor markers.
aP < 0.05. bP < 0.01. cP < 0.001. AFP: Alpha-fetoprotein; PIVKA-II: Prothrombin induced by vitamin K absence-II.
- Citation: Chen ZJ, Wang XK, Han CY, He YF, Liang TY, Mo ST, Zhu GZ, Yang CK, Ye XP, Lv ZL, Pang SF, Chen XD, Wang P, Peng T. Diagnostic value of alpha-fetoprotein and prothrombin induced by vitamin K absence-II in serum, bile, and feces in hepatocellular carcinoma. World J Gastrointest Oncol 2025; 17(5): 105311
- URL: https://www.wjgnet.com/1948-5204/full/v17/i5/105311.htm
- DOI: https://dx.doi.org/10.4251/wjgo.v17.i5.105311


