Copyright
©The Author(s) 2025.
World J Hepatol. Jun 27, 2025; 17(6): 107329
Published online Jun 27, 2025. doi: 10.4254/wjh.v17.i6.107329
Published online Jun 27, 2025. doi: 10.4254/wjh.v17.i6.107329
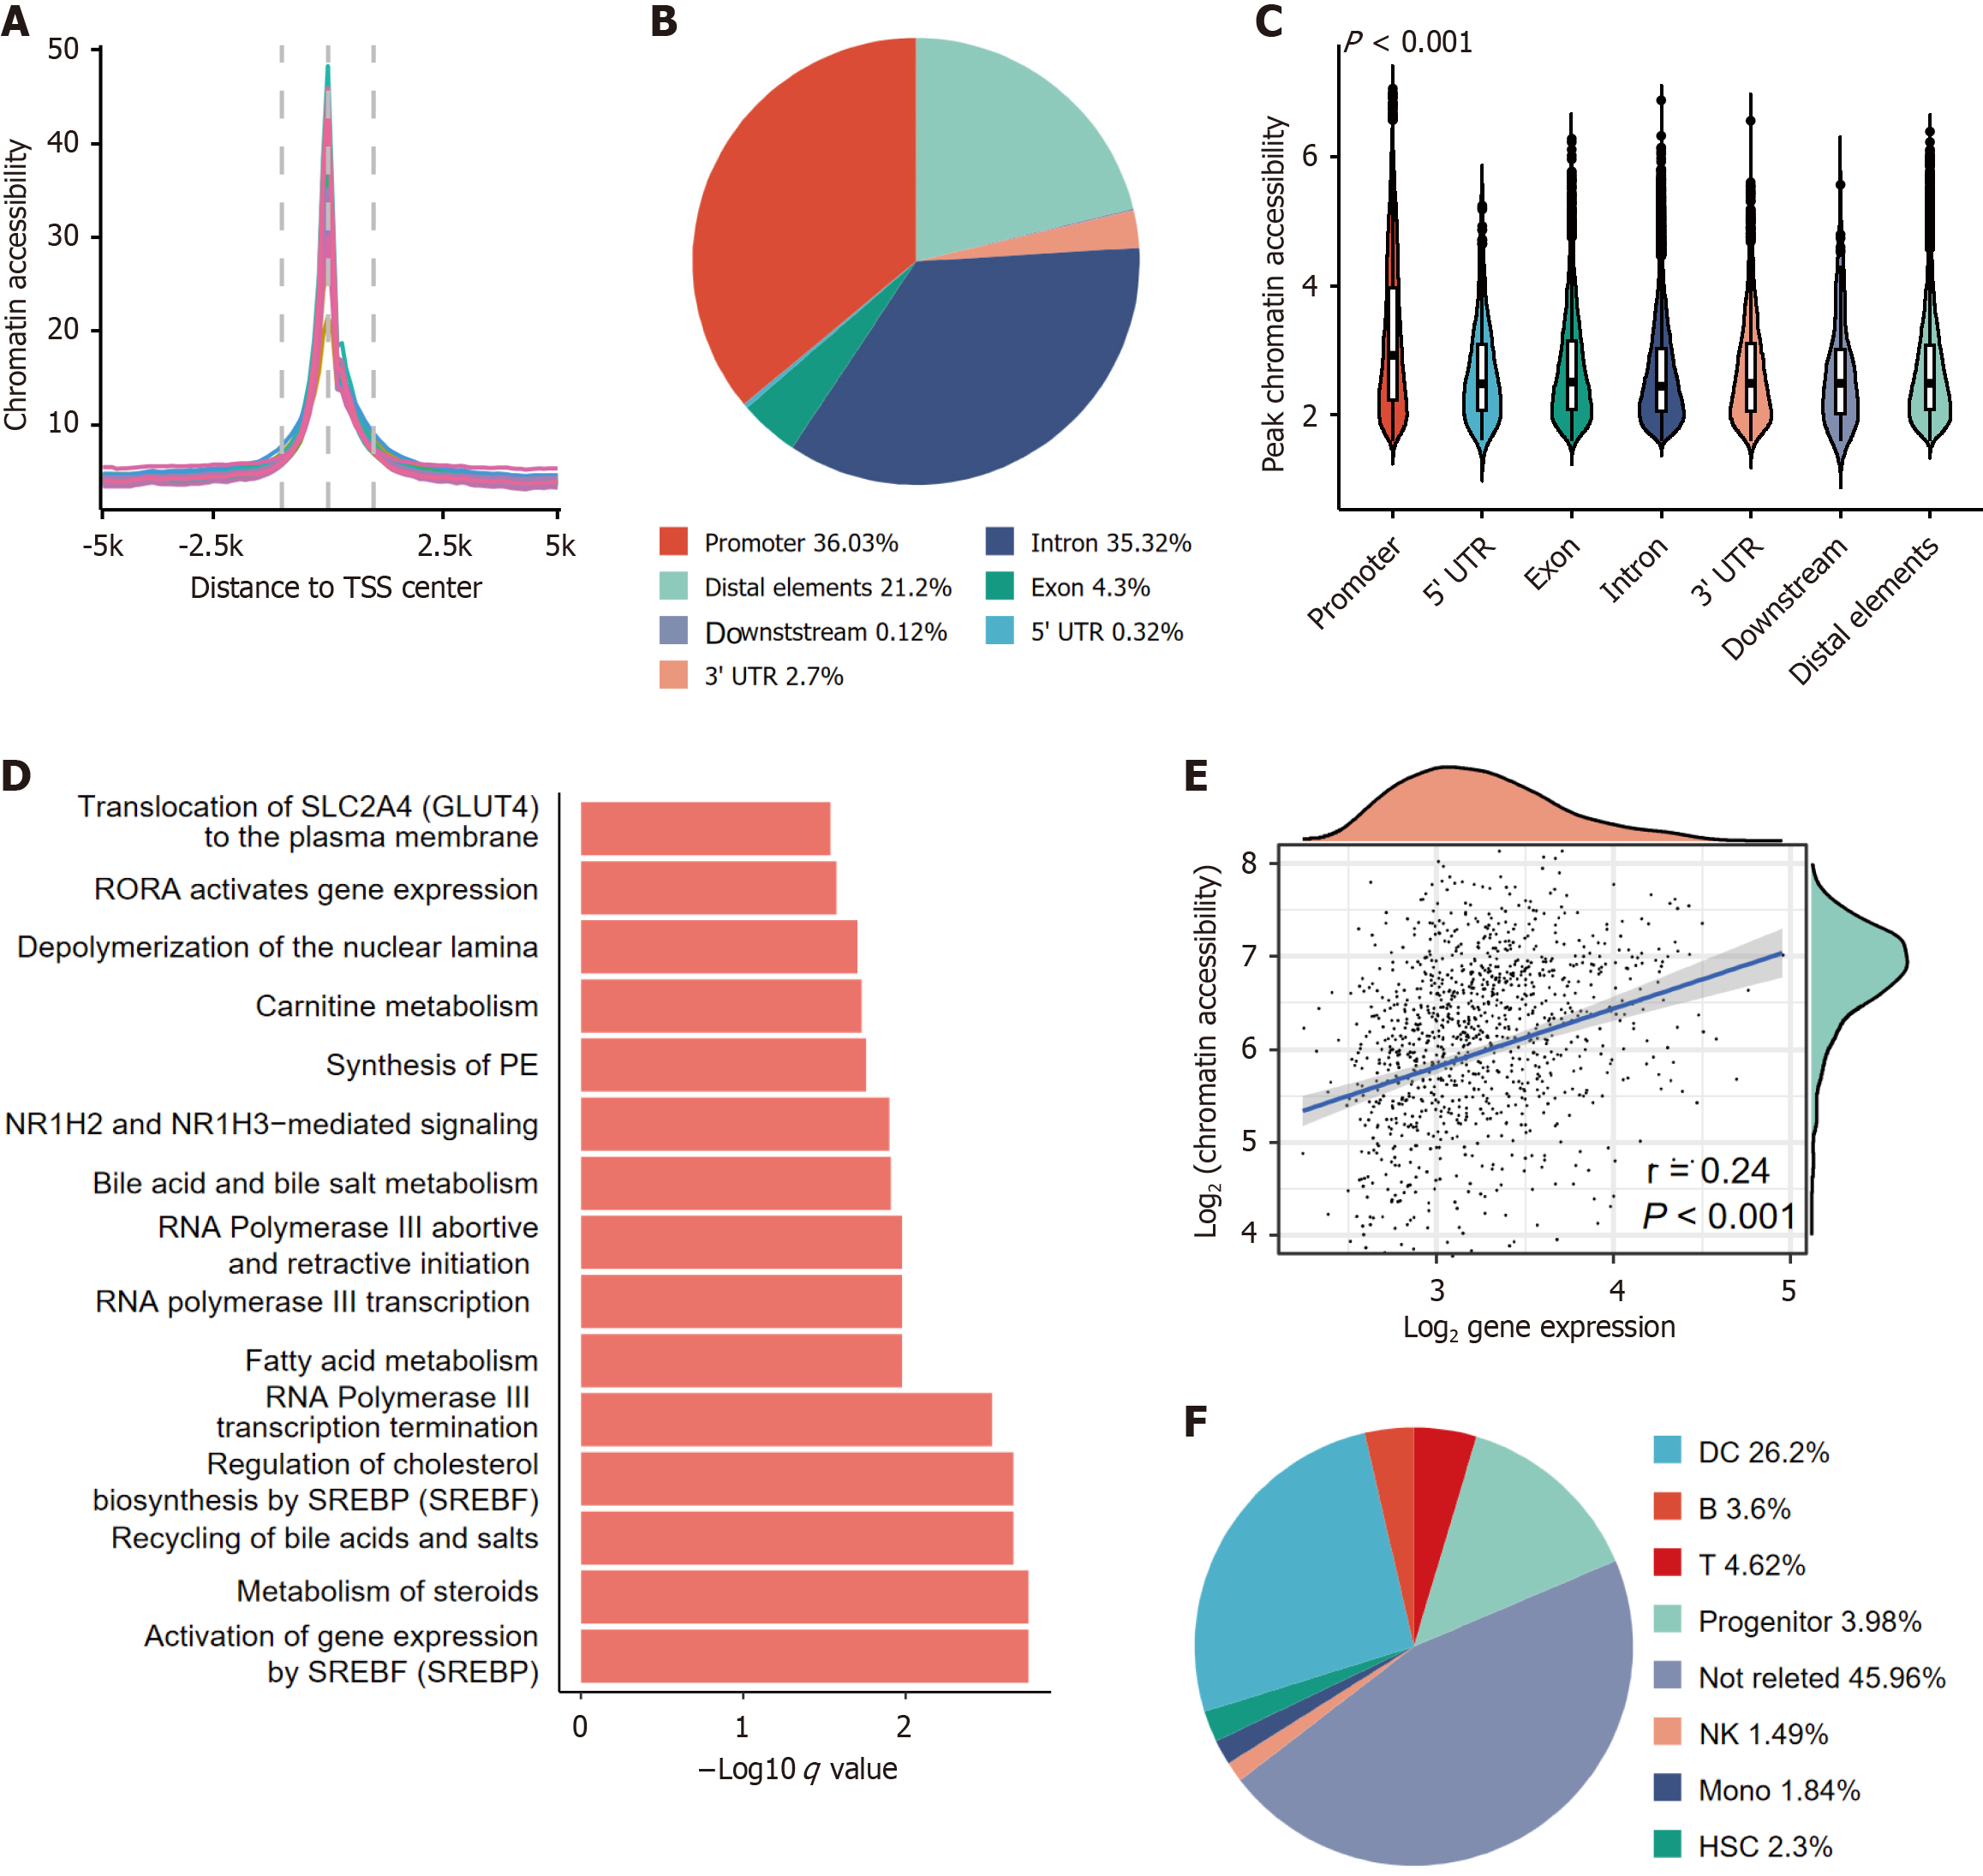
Figure 1 Bulk the assay for transposase-accessible chromatin with sequencing dataset identifies chromatin accessibility dynamics and tumor-associated pathways in hepatocellular carcinoma.
A: Transcription start site enrichment profiles (± 5 kb from transcription start site) validating sequencing quality across hepatocellular carcinoma (HCC) and paired normal samples; B: Genomic distribution (proportions of promoter, intronic, and distal regions) of chromatin accessibility peaks unique to HCC; C: Chromatin accessibility scores across genomic compartments. Promoter regions show the highest accessibility (Wilcoxon test, P < 0.001); D: Top enriched REACTOM pathways for genes with recurrent promoter-accessible peaks (adjusted P < 0.05); E: Weak but significant correlation between promoter accessibility and corresponding gene expression (Pearson r = 0.24, P < 0.001); F: Immune infiltration-associated chromatin features across HCC-specific peaks. Criteria for immune-associated peaks: Enhanced accessibility in immune cells; correlation with cytolytic activity. TSS: Transcription start site; UTR: Untranslated region; PE: Phosphatidyl ethanolamine; DC: Dendritic cells; NK: Natural killer cells; HSC: Hematopoietic stem cells.
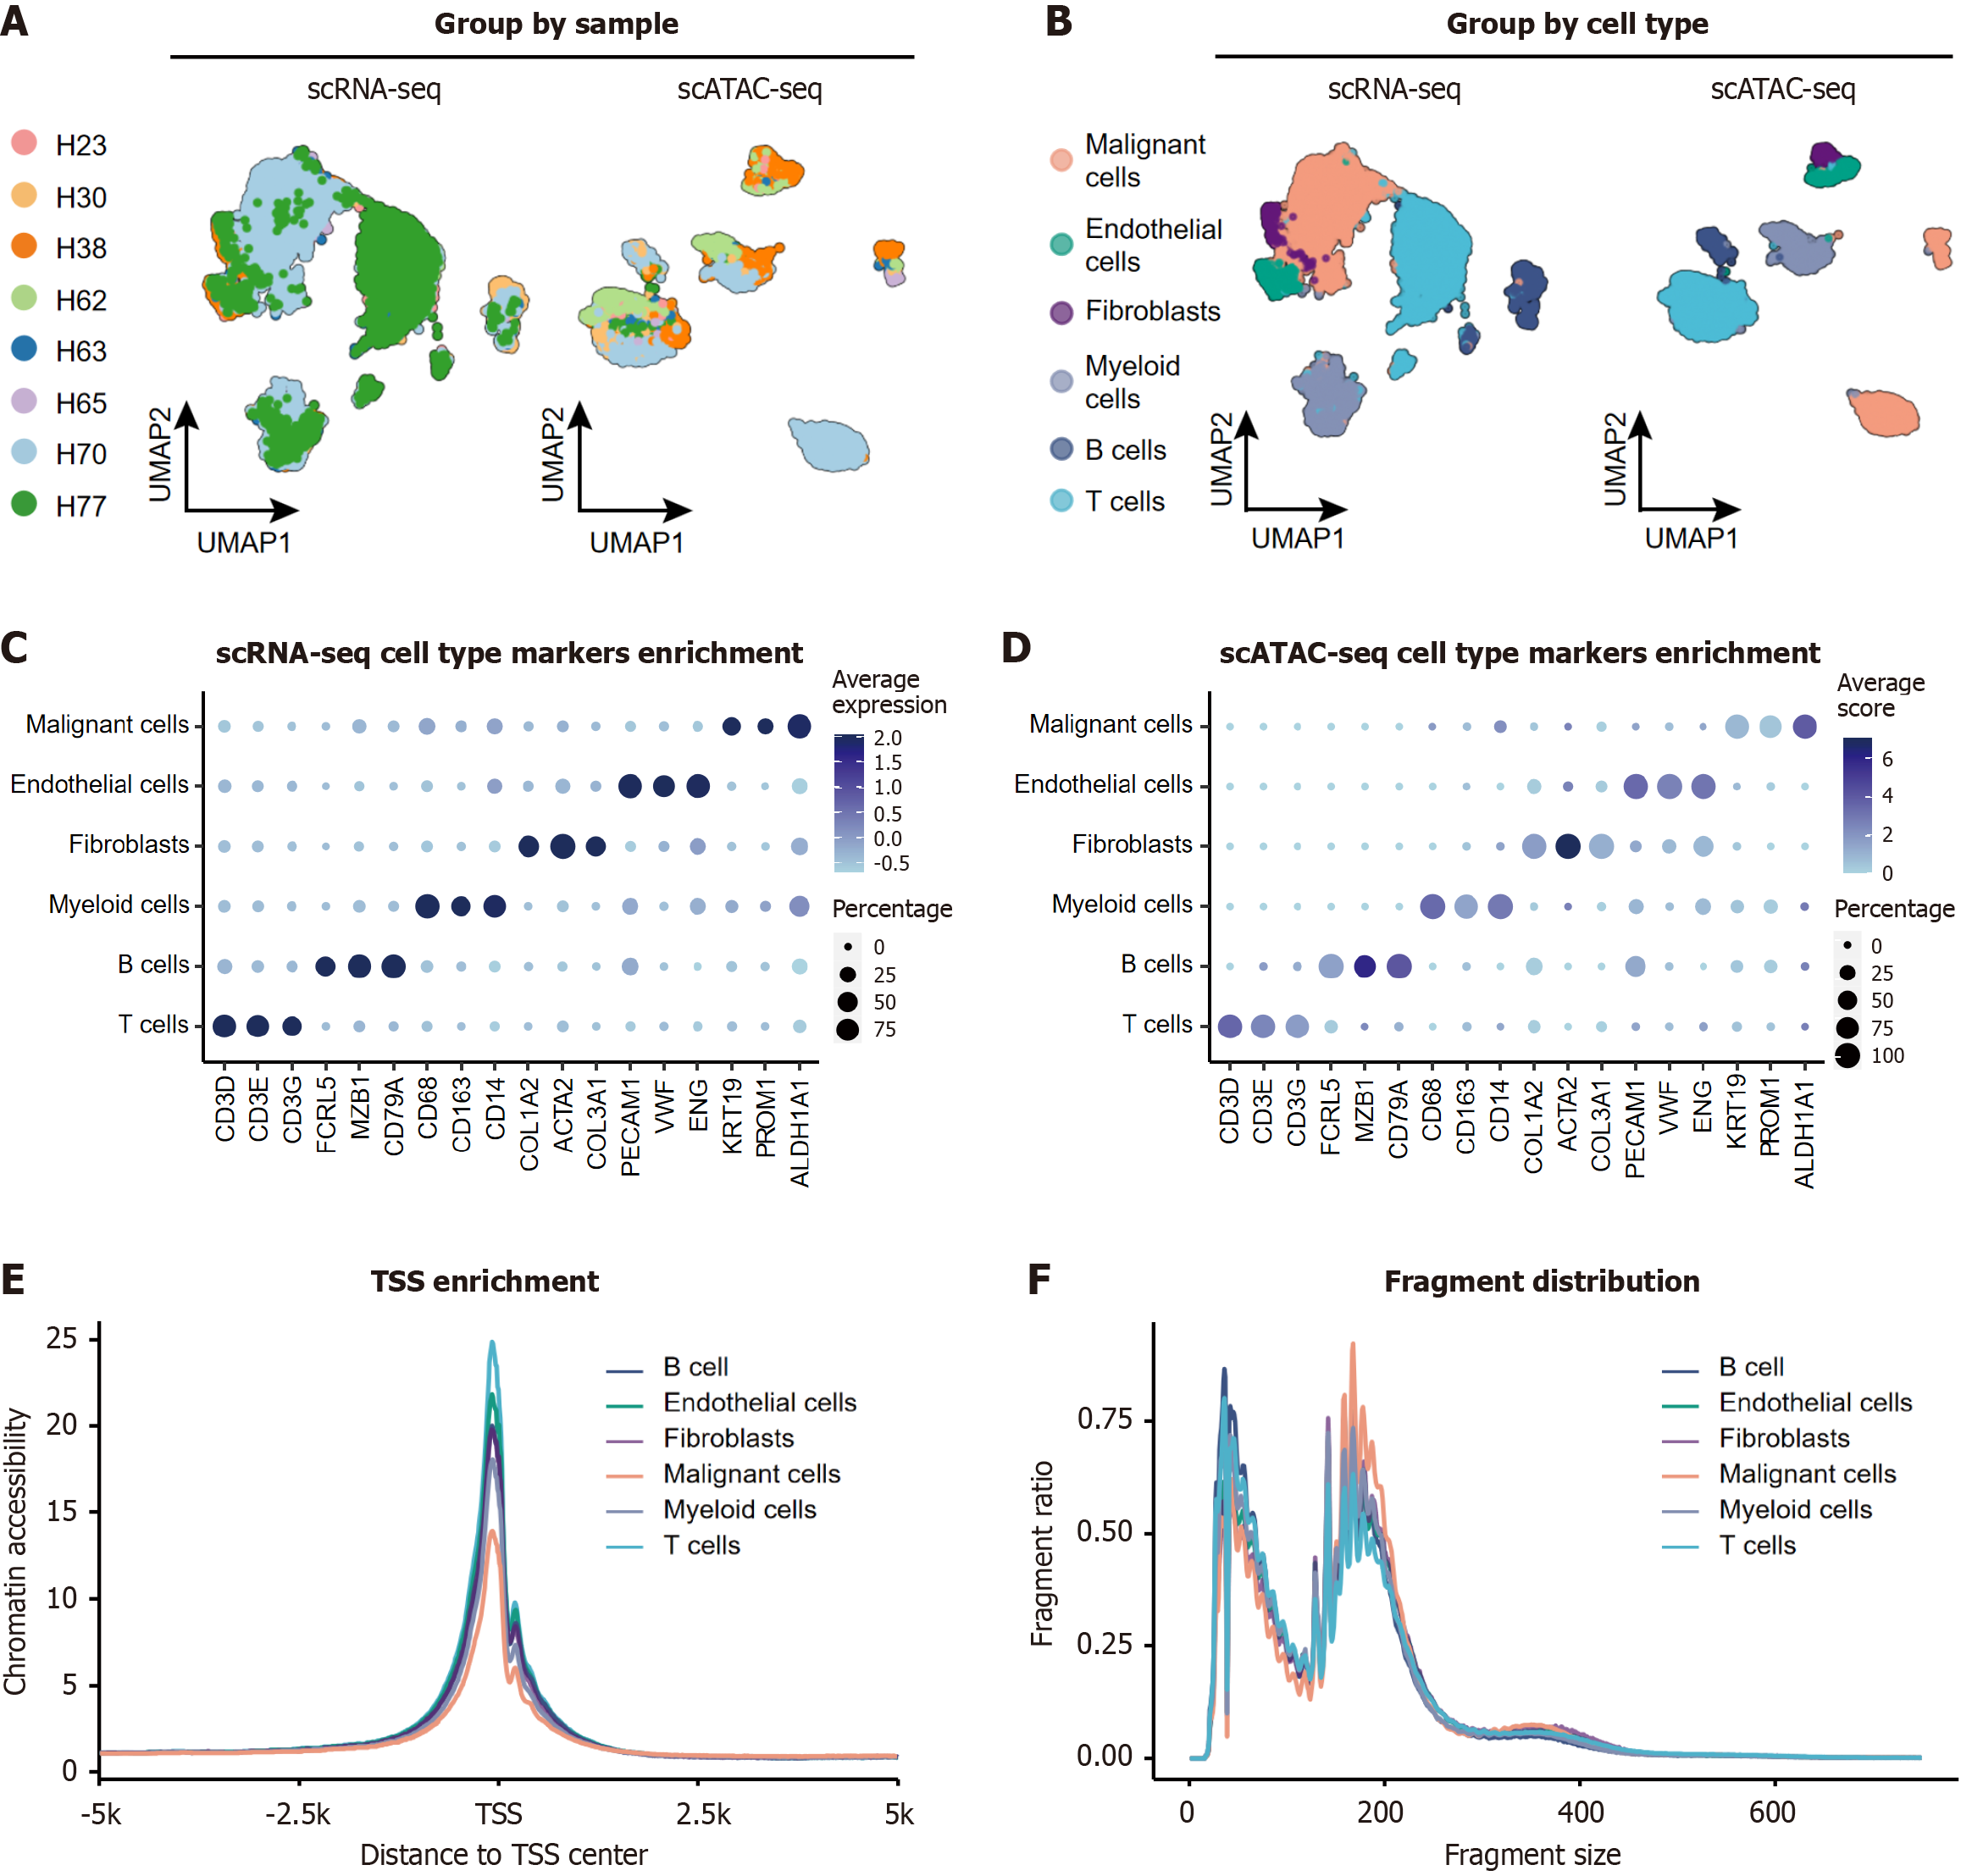
Figure 2 Integrated single-cell multi-omics characterization of hepatocellular carcinoma tumor from the same patients.
A: Uniform manifold approximation and projection plot of 15660 single-cell RNA-sequencing (scRNA-seq) cells (left) and UMAP plot of 10201 single-cell assay for transposase-accessible chromatin with sequencing (scATAC-seq) cells (right) color-coded by patient origin; B: UMAP plot of 15660 scRNA-seq cells (left) and UMAP plot of 10201 scATAC-seq cells (right) color-coded by annotated cell types; C: Dot plot showing canonical marker gene expression (rows) across cell types (columns) in scRNA-seq. Dot size: Fraction of expressing cells; color: Mean normalized expression; D: Dot plot showing chromatin accessibility of marker gene promoters (rows) across cell types (columns) scATAC-seq. Dot size: Fraction of expressing cells; color: Mean normalized expression; E: Transcription start site enrichment profiles stratified by major cell types. Malignant hepatocytes exhibit reduced transcription start site signal compared to non-malignant cells; F: Fragment size distributions across cell types. Malignant cells display longer nucleosome-free fragments. UMAP: Uniform manifold approximation and projection; scRNA-seq: Single-cell RNA-sequencing; ATAC-seq: Assay for transposase-accessible chromatin using sequencing; scATAC-seq: Single-cell assay for transposase-accessible chromatin with sequencing; TSS: Transcription start site.
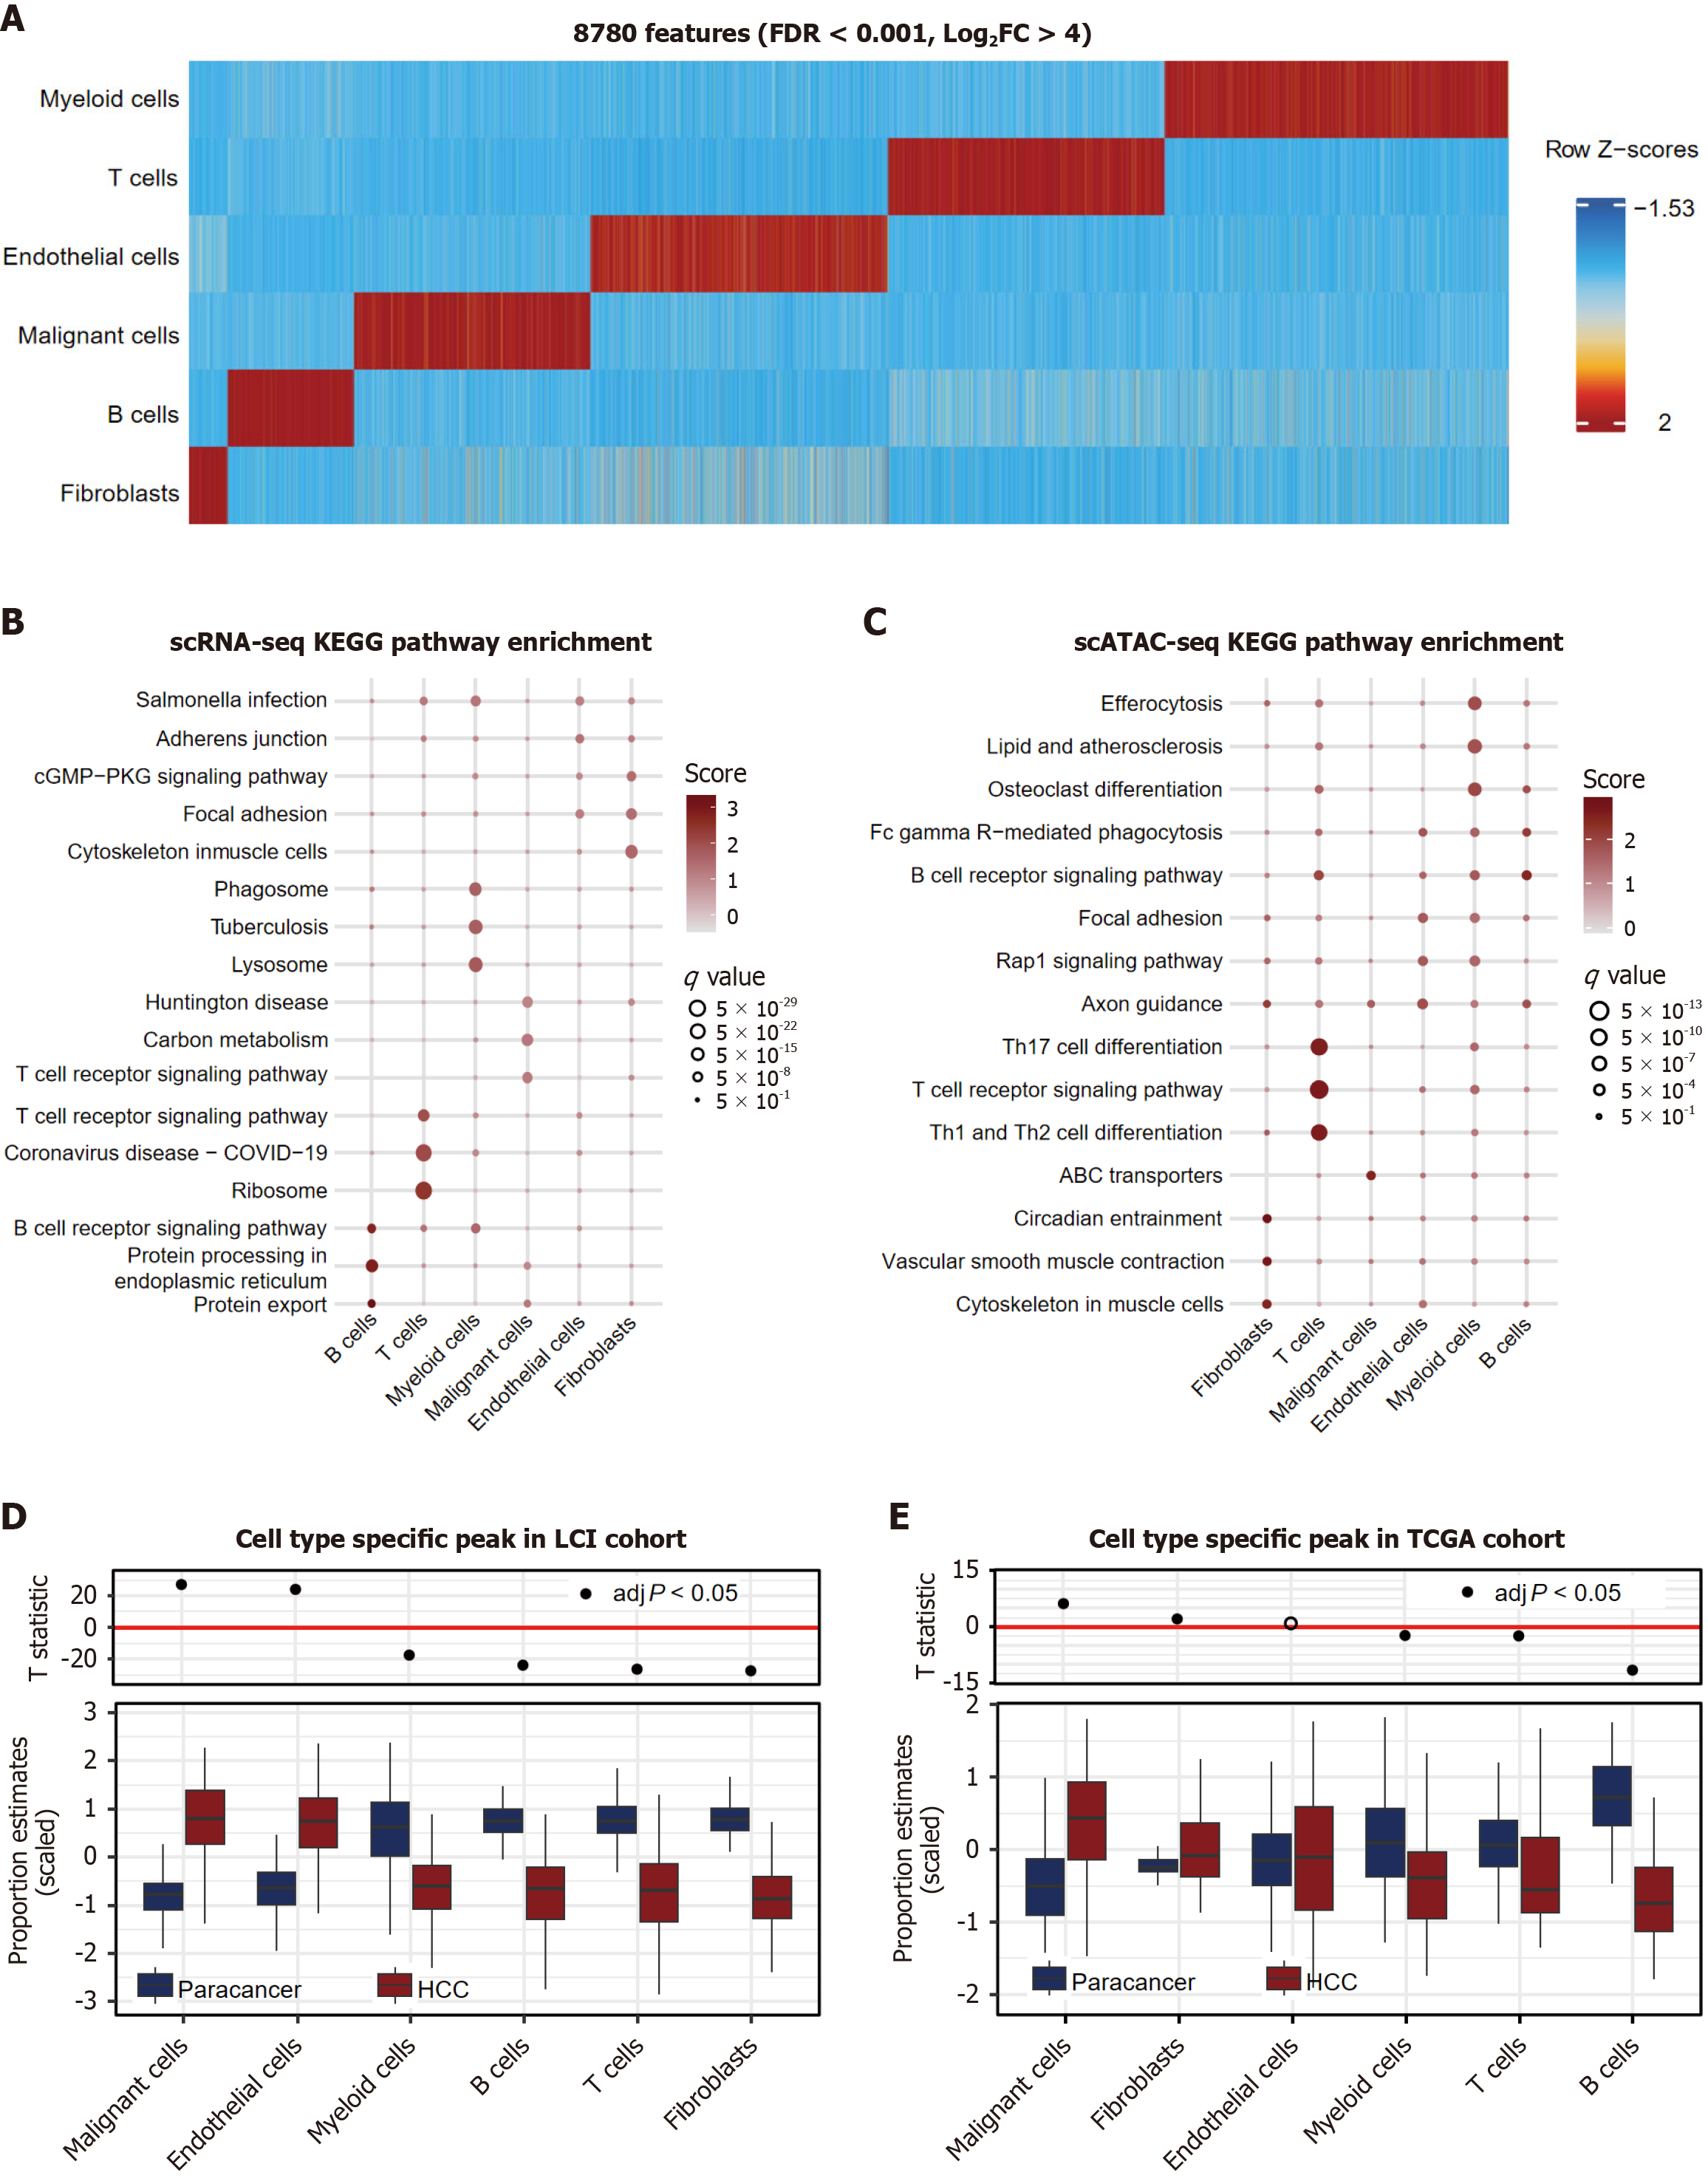
Figure 3 Cell type-specific chromatin accessibility underlies functional diversity in hepatocellular carcinoma.
A: Heatmap of 8780 cell type-specific accessible regions (columns) across cell types (rows). Z-score indicates accessibility deviation from mean; B: Pathway analysis of the single-cell RNA-sequencing marker for each cell type using the Kyoto Encyclopedia of Genes and Genomes pathway database. The score indicated normalized enrichment scores and q value denote Benjamini-Hochberg-adjusted P values; C: Pathway analysis of the single-cell assay for transposase-accessible chromatin with sequencing (scATAC-seq) marker peak enriched genes for each cell type using the Kyoto Encyclopedia of Genes and Genomes pathway database. The score indicated normalized enrichment scores and q value denote Benjamini-Hochberg-adjusted P values; D: Expression of scATAC-seq marker peak enriched genes in Liver Cancer Institute cohort grouped by cell peak. The upper panel shows the T-statistic from a paired t-test between tumor and adjacent non-tumor samples; E: Expression of scATAC-seq marker peak enriched genes in The Cancer Genome Atlas cohort grouped by cell peak. The upper panel shows the T-statistic from a paired t-test between tumor and adjacent non-tumor samples. FDR: False discovery rate; FC: Fold change; scRNA-seq: Single-cell RNA sequencing; ATAC-seq: Assay for transposase-accessible chromatin using sequencing; scATAC-seq: Single-cell assay for transposase-accessible chromatin with sequencing; KEGG: Kyoto Encyclopedia of Genes and Genomes; LCI: Liver Cancer Institute; TCGA: The Cancer Genome Atlas.
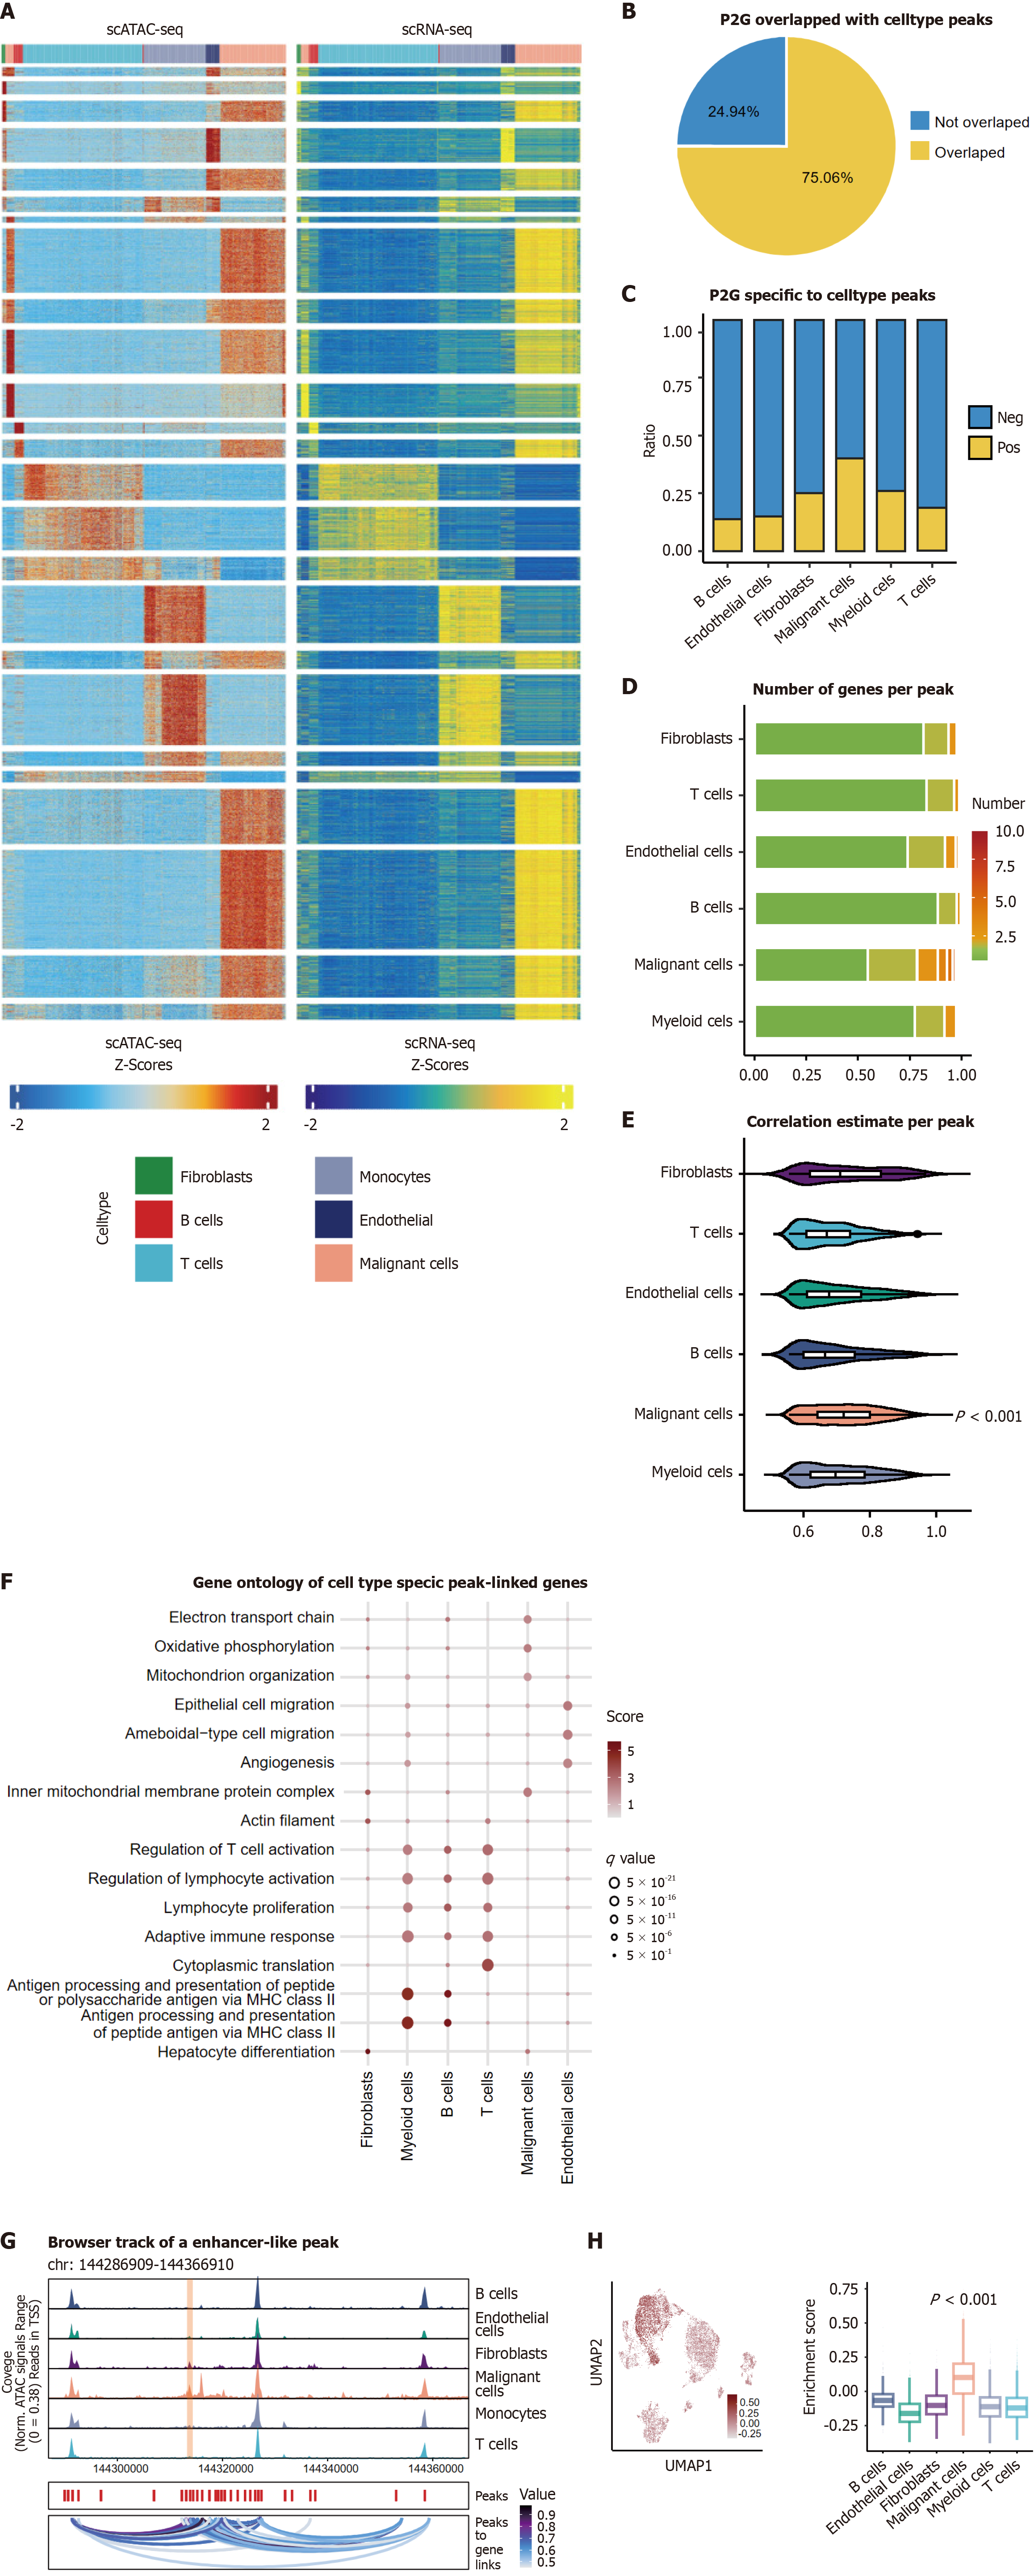
Figure 4 Malignant cells harbored multiple enhancer-like peaks driving oncogenic transcription.
A: Row scaled heatmaps of statistically significant peak-to-gene (P2G) links. Each row represents expression of a gene (left) correlated to chromatin accessibility of a peak (right); B: Overlap between P2G links and cell type-specific accessible regions; C: Stacked bar plot showing P2G uniquely related to specific marker across cell type. Malignant cells exhibit the highest regulatory complexity; D: Stacked bar plot showing number of genes per peak linked to across cell type. Malignant peaks target more genes (P < 0.001); E: Correlation coefficients (Pearson r) of P2G links across cell types. Malignant cells display stronger correlations (P < 0.001); F: Gene ontology enrichment analysis of the P2G enriched genes for each cell type. The score indicated normalized enrichment scores and q value denote benjamini-hochberg-adjusted P values; G: Browser track showing the accessibility profile at the strongest peak locus across all cell types (chr8 144286909-144366910). Peak was further highlighted by light red shallows; H: Uniform manifold approximation and projection plots of 15660 single-cell RNA-sequencing cells color-coded expression of the strongest peak hub. scRNA-seq: Single-cell RNA-sequencing; ATAC-seq: Assay for transposase-accessible chromatin using sequencing; scATAC-seq: Single-cell assay for transposase-accessible chromatin with sequencing; P2G: Peak-to-gene; UMAP: Uniform manifold approximation and projection;
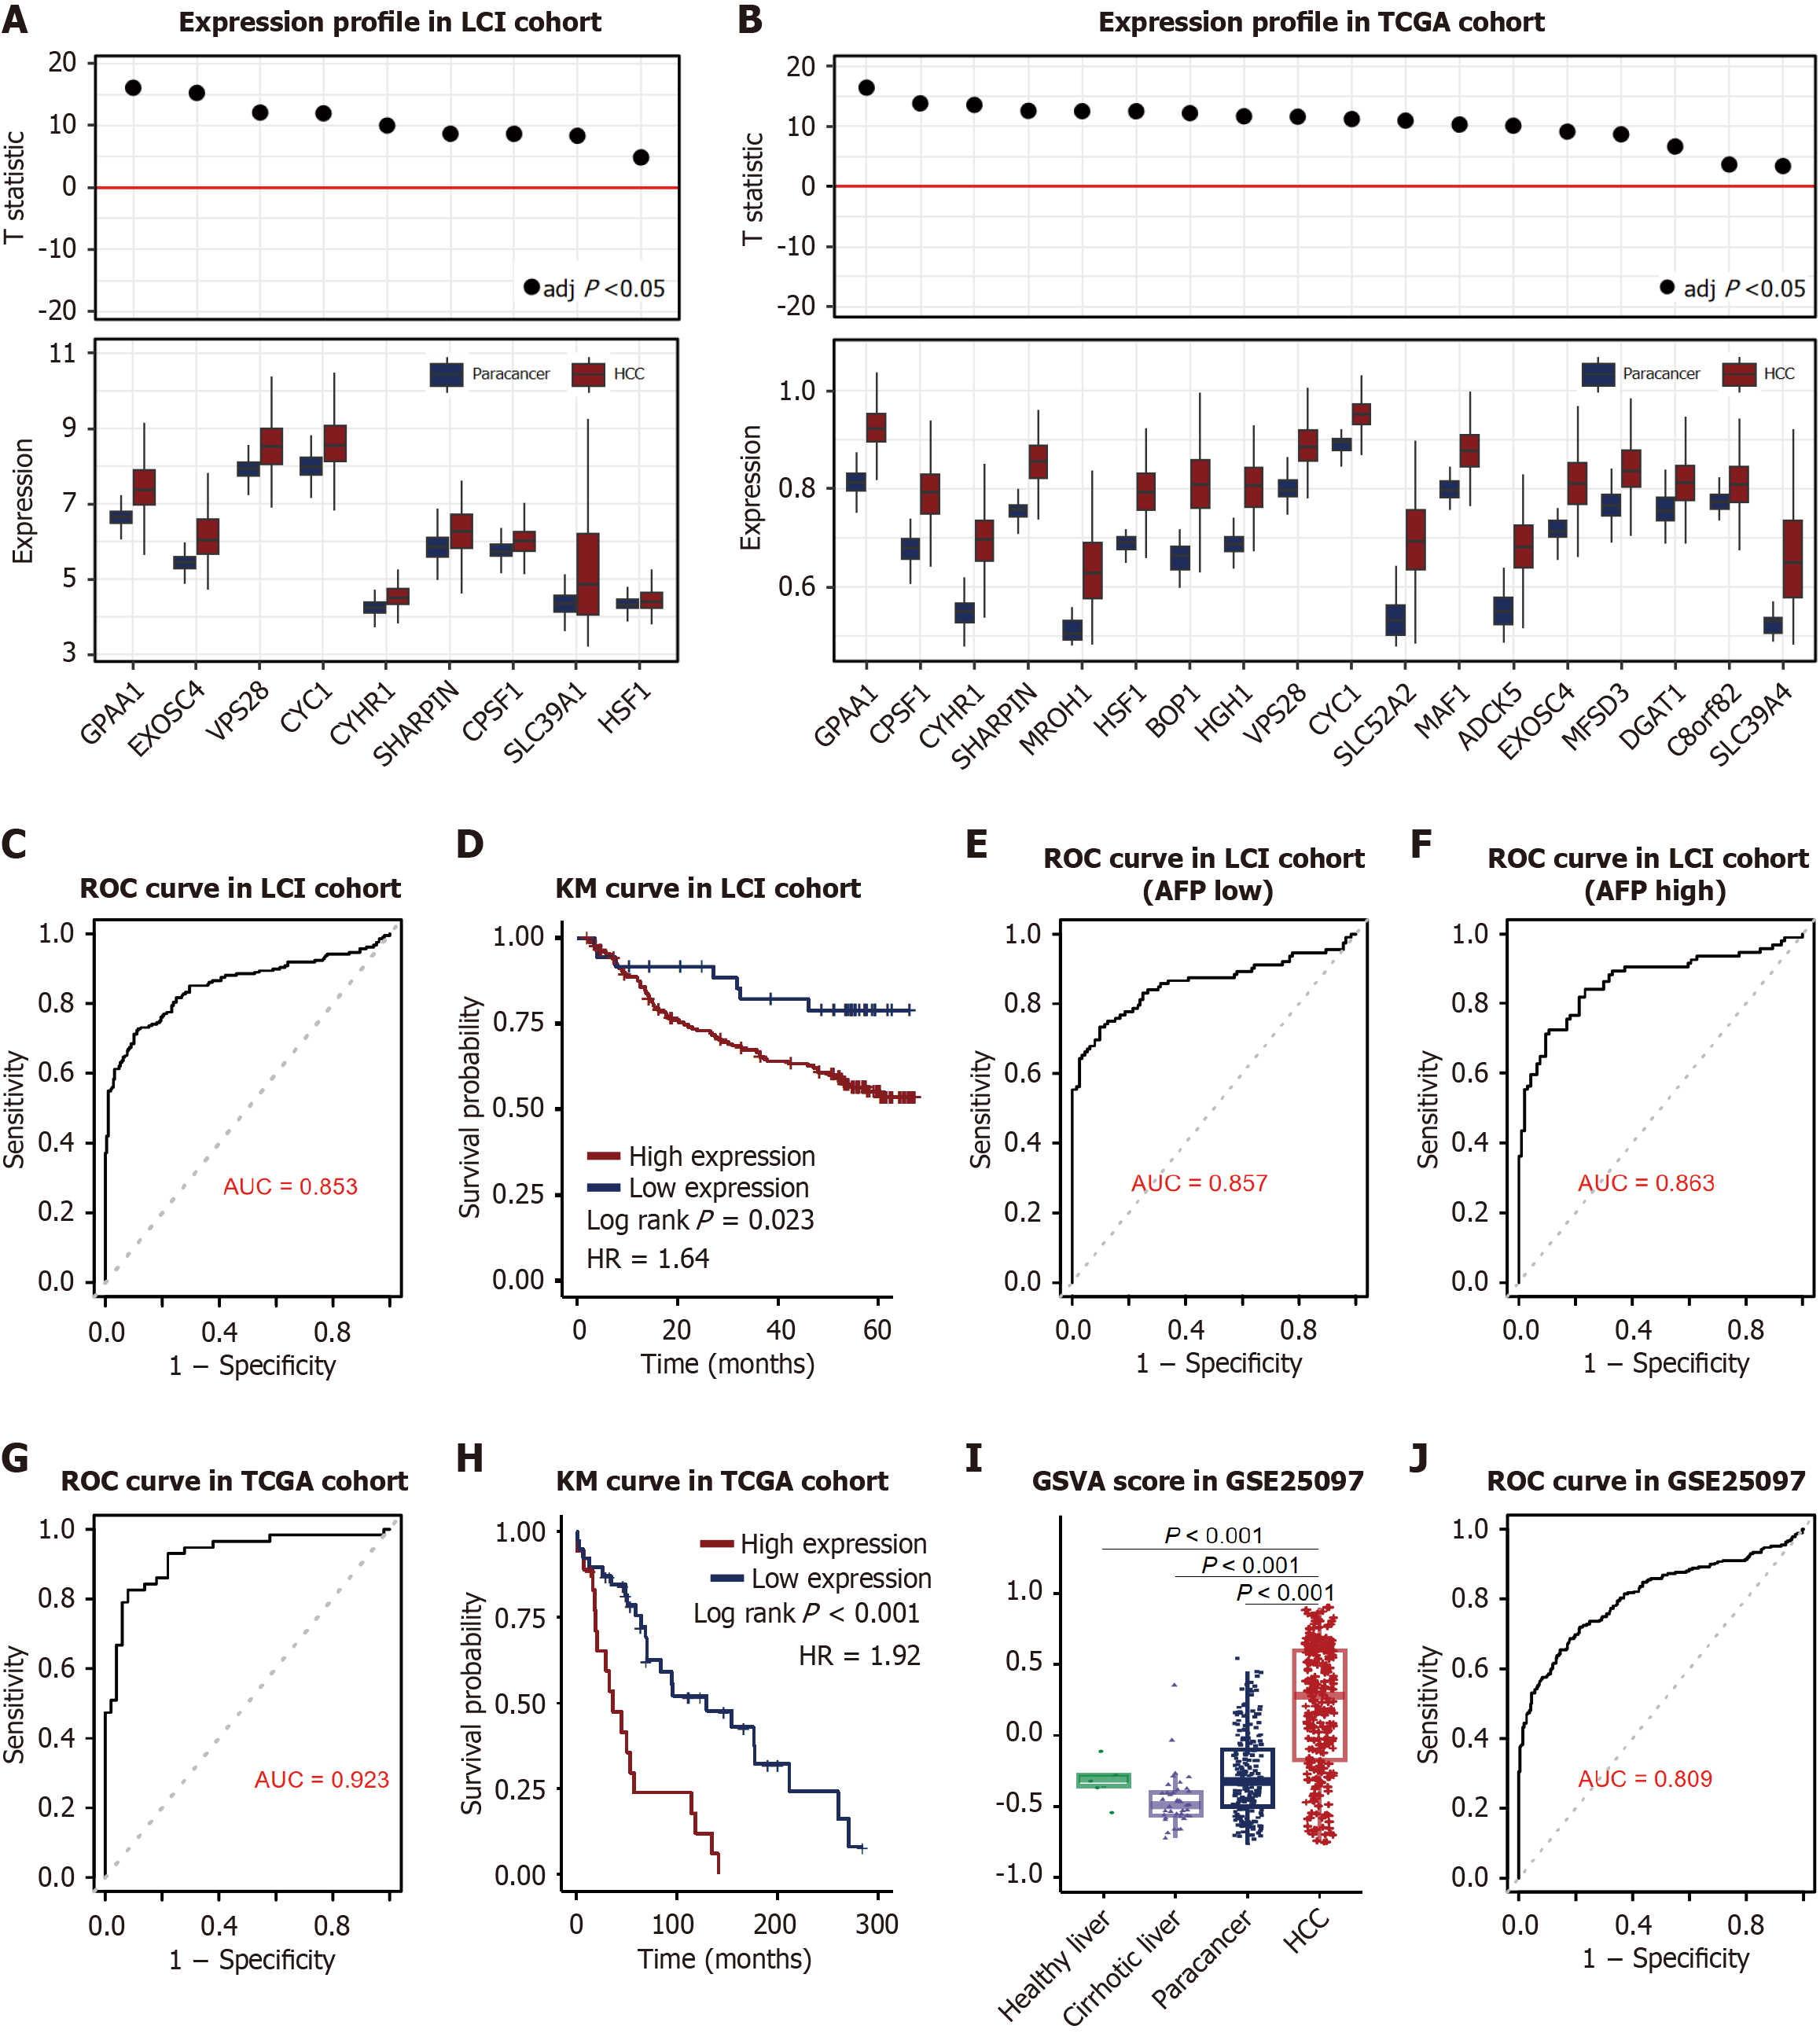
Figure 5 Enhancer-like chromatin peaks exhibited diagnostic and prognostic potential in hepatocellular carcinoma.
A: Overexpression of enhancer-hub genes in tumors vs adjacent normal tissues in Liver Cancer Institute cohort (n = 209). The upper panels showed the T-statistic from a paired t-test between tumor and non-tumor adjacent non-tumor tissues (NATs); B: Overexpression of enhancer-hub genes in tumors vs adjacent normal tissues in The Cancer Genome Atlascohort (n = 59). The upper panels showed the T-statistic from a paired t-test between tumor and NATs; C: Receiver operating characteristic (ROC) curve analysis of hub genes for diagnosing hepatocellular carcinoma in the LCI cohort (n = 209, area under the curve (AUC) = 0.853, 95% confidence interval (CI): 0.813-0.889); D: Kaplan-Meier survival analysis of hub genes in the LCI cohort (n = 209). High hub gene expression correlates with poor overall survival (P = 0.0233, hazard ratio = 1.64, 95%CI: 0.993-2.70); E: ROC curve analysis of hub genes for diagnosing hepatocellular carcinoma in the LCI cohort in low alpha fetoprotein subgroup (AFP < 300 ng/mL, n = 59, AUC = 0.857, 95%CI: 0.813-0.89); F: ROC curve analysis of hub genes for diagnosing hepatocellular carcinoma in the LCI cohort in high AFP subgroup (AFP ≥ 300 ng/mL, n = 50, AUC = 0.857, 95%CI: 0.813-0.89); G: ROC curve analysis of hub genes for diagnosing hepatocellular carcinoma in the TCGA cohort (n = 59, AUC = 0.923, 95%CI: 0.865-0.968); H: Kaplan-Meier survival analysis of hub genes in the TCGA cohort (n = 59). High hub gene expression correlates with poor overall survival (P < 0.001, hazard ratio = 1.92, 95%CI: 1.02-3.63); I: Gene set variation analysis score of 18 gene in GSE25097 cohort. Expression in hepatocellular carcinoma (n = 268) was higher than in NATs (n = 243), cirrhotic tissues (n = 40), and healthy liver samples (n = 6), P value was adjusted with the Benjamini-Hochberg method; J: ROC curve analysis of hub genes for diagnosing hepatocellular carcinoma in GSE25097 (n = 557, AUC = 0.809, 95%CI: 0.882-0.844). LCI: Liver Cancer Institute; TCGA: The Cancer Genome Atlas; ROC: Receiver operating characteristic; KM: Kaplan-Meier; AFP: Alpha fetoprotein; GSVA: Gene set variation analysis.
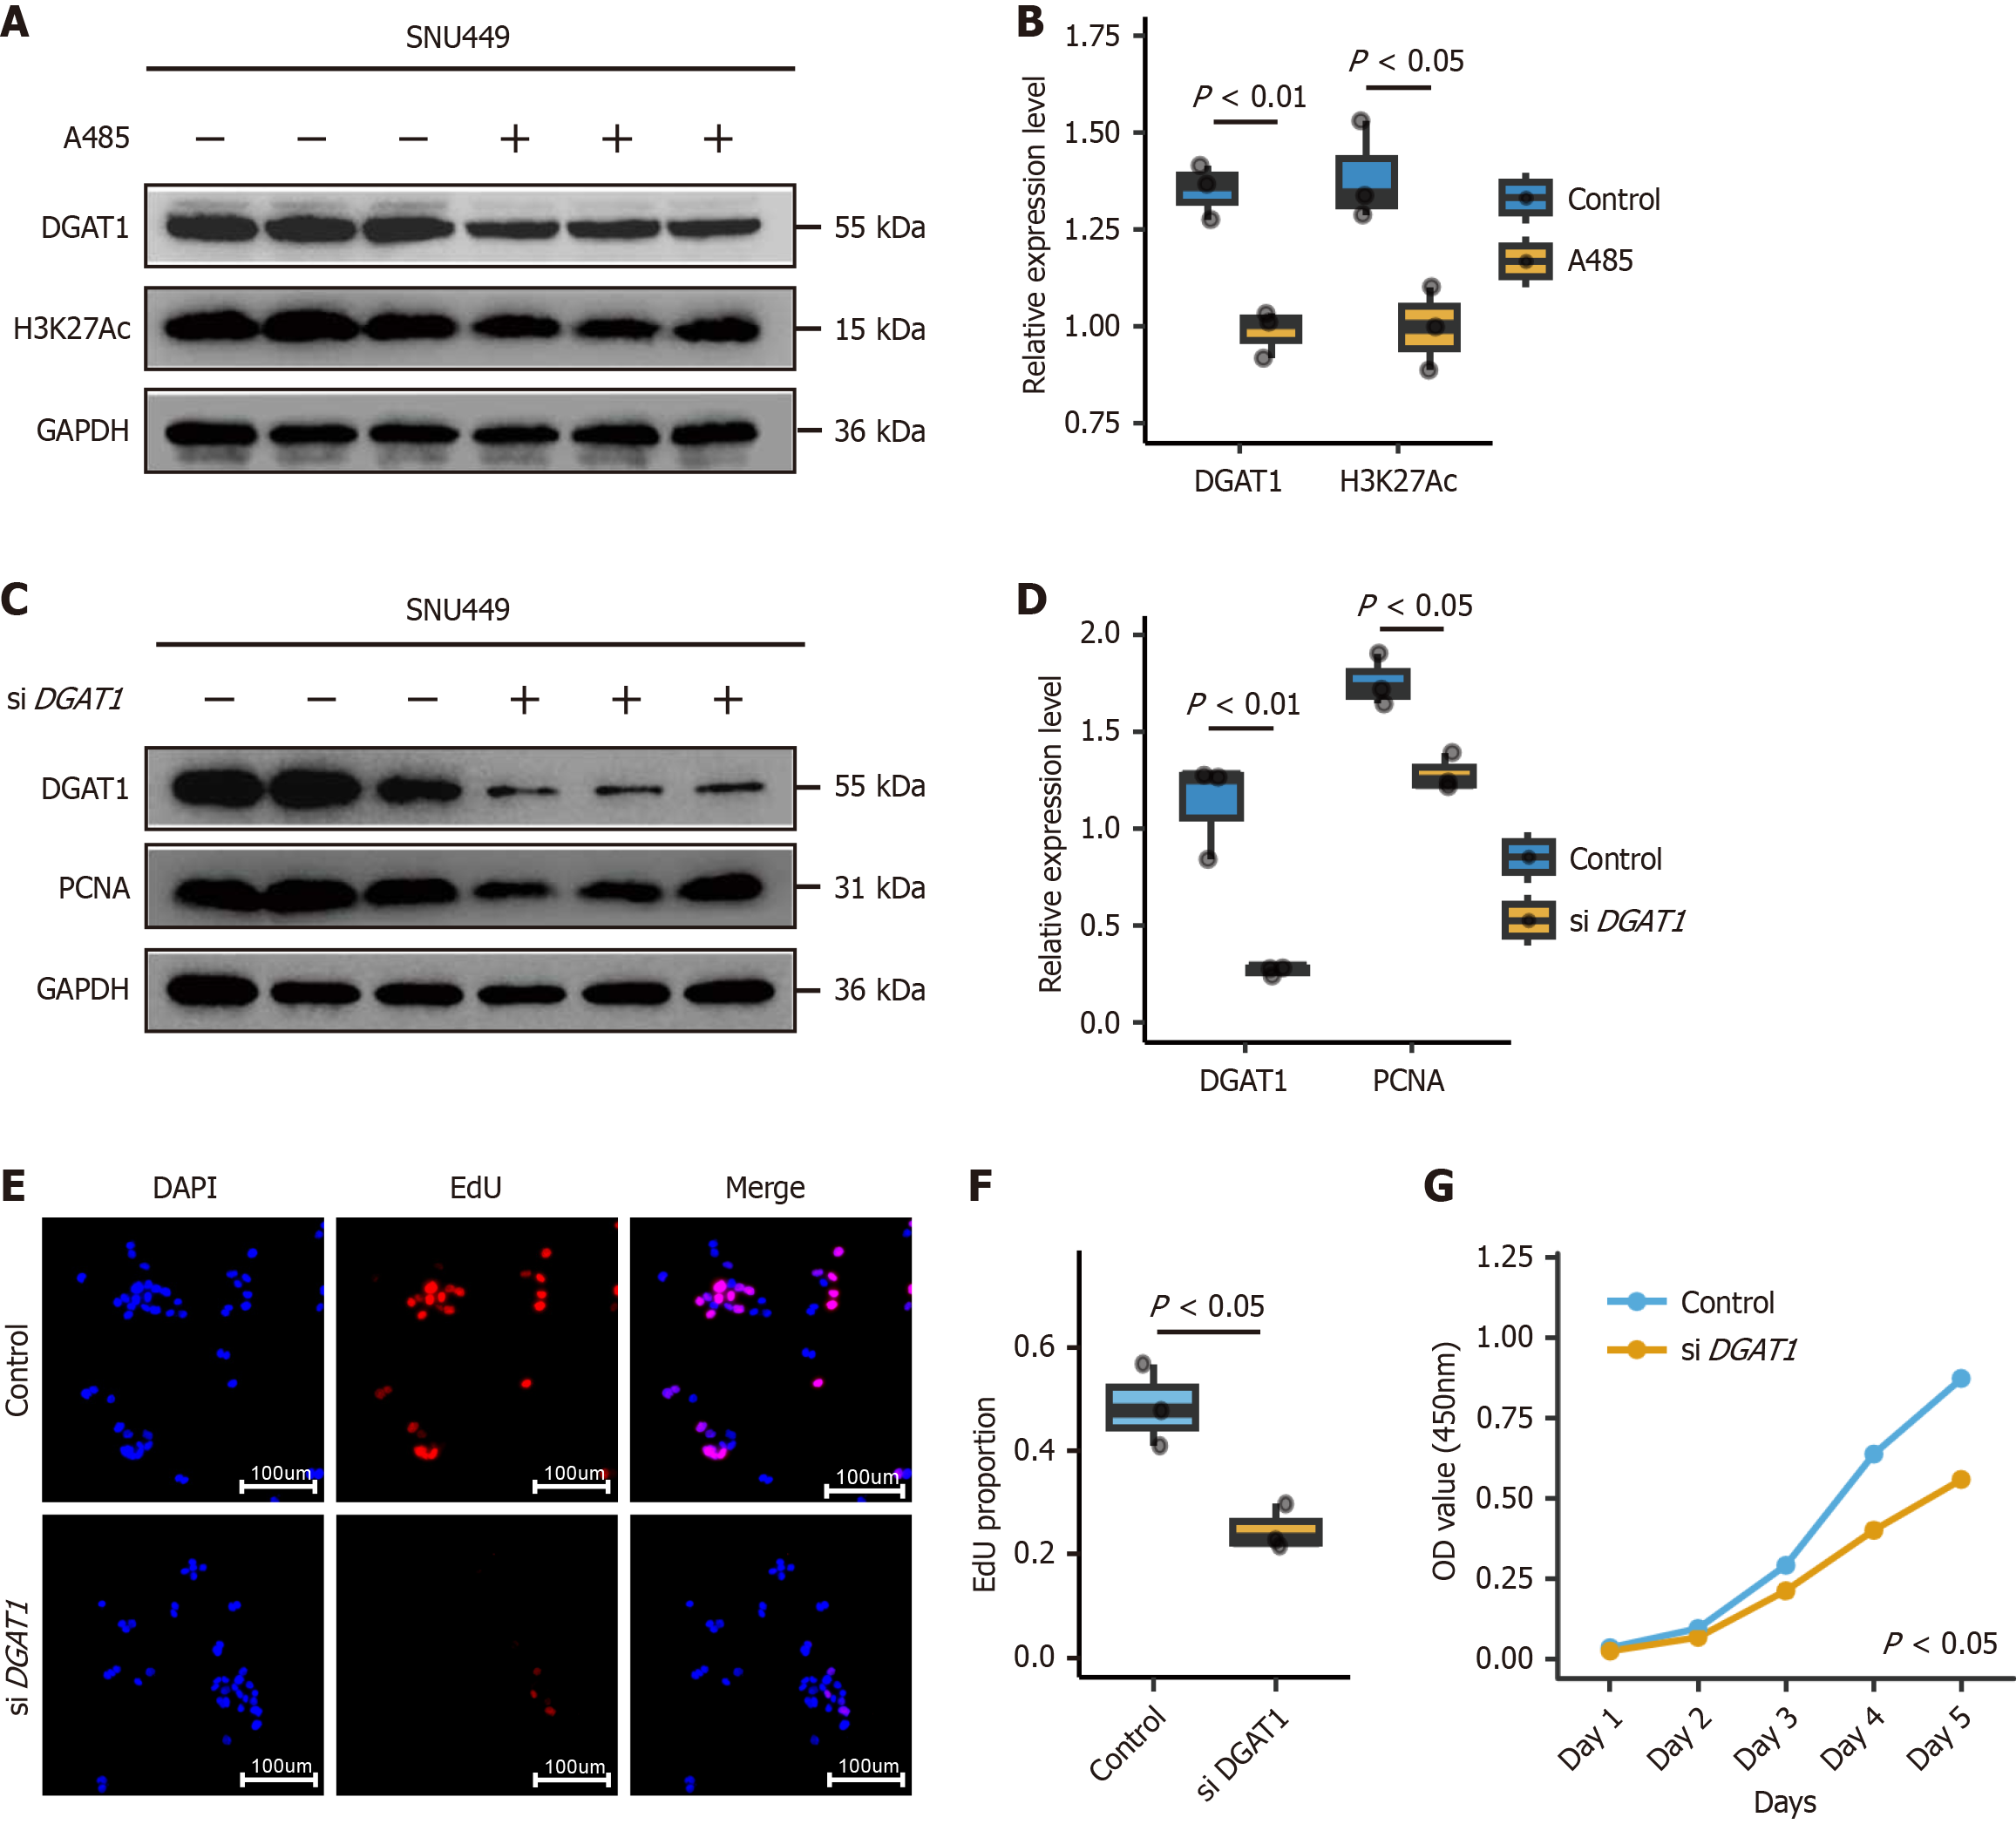
Figure 6 DGRT1 regulated by chromatin accessibility promoted cell proliferation.
A: Western blot analysis of DGAT1 and histone 3 lysine 27 acetylation expression in SNU449 cells treated with 1 μmol/L A485 (CREB-binding protein/P300 inhibitor) for 48 hours. Glyceraldehyde-3-phosphate dehydrogenase served as a loading control; B: Quantification of DGAT1 and H3K27Ac protein levels normalized to GAPDH (n = 3); C: Western blot of DGAT1 and proliferation marker in SNU449 cells transfected with DGAT1-targeting small interfering RNA. Small interfering RNA with non-targeting gene was used as control; D: Quantification of DGAT1 and proliferation marker levels normalized to GAPDH (n = 3); E: Representative images of 5-ethynyl-2’-deoxyuridine assay showing proliferating cells (EdU-positive, red) in DGAT1-knockdown SNU449 cells. Nuclei were stained with 4’, 6-diamidino-2-phenylindole, dihydrochloride (blue); F: Quantitative analysis of EdU-positive cells (n = 3), P value < 0.05; G: Cell counting kit-8 assay demonstrating reduced cell viability in DGAT1-knockdown SNU449 cells over 96 hours (n = 3), P value < 0.05. EdU: 5-ethynyl-2’-deoxyuridine; DAPI: 4’, 6-diamidino-2-phenylindole, dihydrochloride; DGAT1: Diacylglycerol acyltransferase-1; siDGAT1: Small interfering RNA targeting DGAT1; H3K27Ac: Histone 3 lysine 27 acetylation; GAPDH: Glyceraldehyde-3-phosphate dehydrogenase; PCNA: Proliferating cell nuclear antigen.
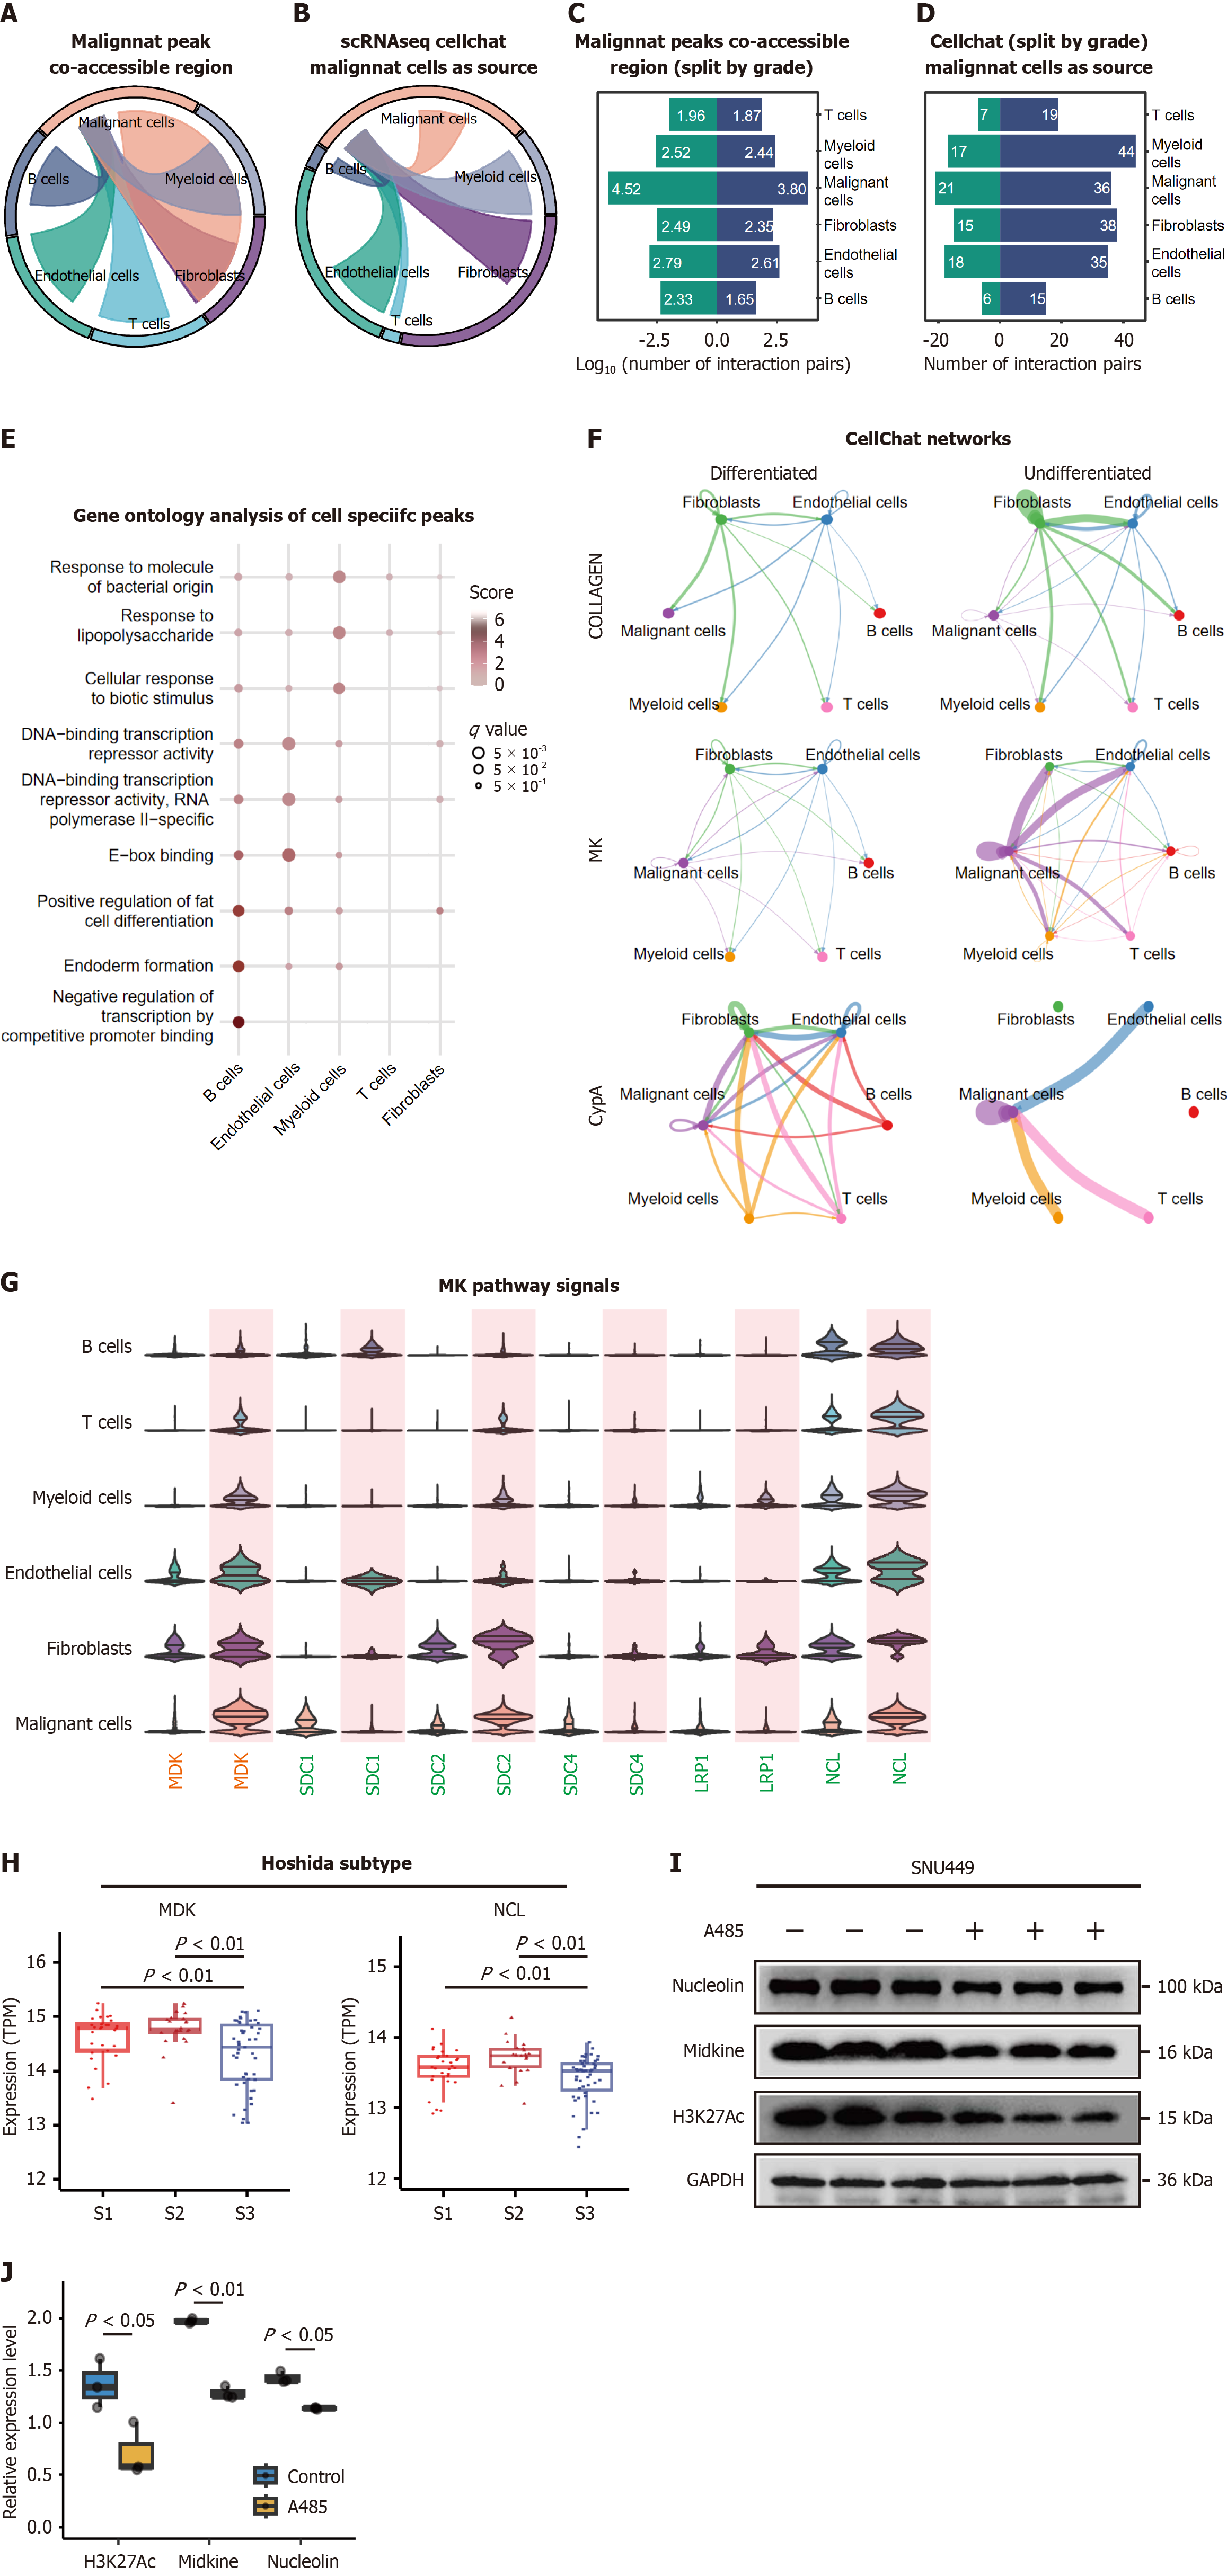
Figure 7 Epigenetic coordination between malignant and stromal cells.
A: Co-accessible chromatin peaks between tumor and non-tumor cells (log10 transformed counts); B: Ligand-receptor interactions initiated by malignant cells in tumor microenvironments, quantified via CellChat; C: A bar plot showing the log10 of co-accessible peaks number among tumor cells and non-tumor cells across differentiated tumors and nondifferentiated tumors; D: A bar plot showing the number of ligand-receptor interactions when setting malignant cells as source among tumor cells and non-tumor cells across differentiated tumors and nondifferentiated tumors; E: Gene ontology enrichment for genes linked to malignant co-accessible regions. The score indicated normalized enrichment scores and q value denote Benjamini-Hochberg-adjusted P values; F: A circle network plot showing communication networks of the three common signaling pathways, Collagen, midkine (MDK) and peptidylprolyl isomerase A across differentiated tumors and nondifferentiated tumors. Line width indicates interaction strength; G: Expression of MDK pathway ligands (MDK, orange) and receptors (green) across differentiation states. Undifferentiated tumors exhibit upregulated MDK; H: MDK and nucleolin expression was lowest in well-differentiated samples grouped by Hoshida subtypes; I: Western blot of MDK, NCL and H3K27Ac expression in SNU449 cells transfected with 1 μmol/L A485 (CREB-binding protein/P300 inhibitor) for 48 hours. glyceraldehyde-3-phosphate dehydrogenaseserved as a loading control; J: Quantification of MDK, NCL and H3K27Ac levels normalized to glyceraldehyde-3-phosphate dehydrogenase (n = 3). scRNA-seq: Single-cell RNA-sequencing; MK: Midkine related pathway; CypA: Peptidylprolyl isomerase A; MDK: Midkine; SDC: Syndecan; LRP: LDL Receptor Related Protein; NCL: Nucleolin; H3K27Ac: Histone 3 lysine 27 acetylation; CBP: CREB-binding protein; GAPDH: Glyceraldehyde-3-phosphate dehydrogenase.
- Citation: Xi XL, Yang YD, Liu HL, Jiang J, Wu B. Chromatin accessibility module identified by single-cell sequencing underlies the diagnosis and prognosis of hepatocellular carcinoma. World J Hepatol 2025; 17(6): 107329
- URL: https://www.wjgnet.com/1948-5182/full/v17/i6/107329.htm
- DOI: https://dx.doi.org/10.4254/wjh.v17.i6.107329


