Copyright
©The Author(s) 2025.
World J Hepatol. Jun 27, 2025; 17(6): 107329
Published online Jun 27, 2025. doi: 10.4254/wjh.v17.i6.107329
Published online Jun 27, 2025. doi: 10.4254/wjh.v17.i6.107329
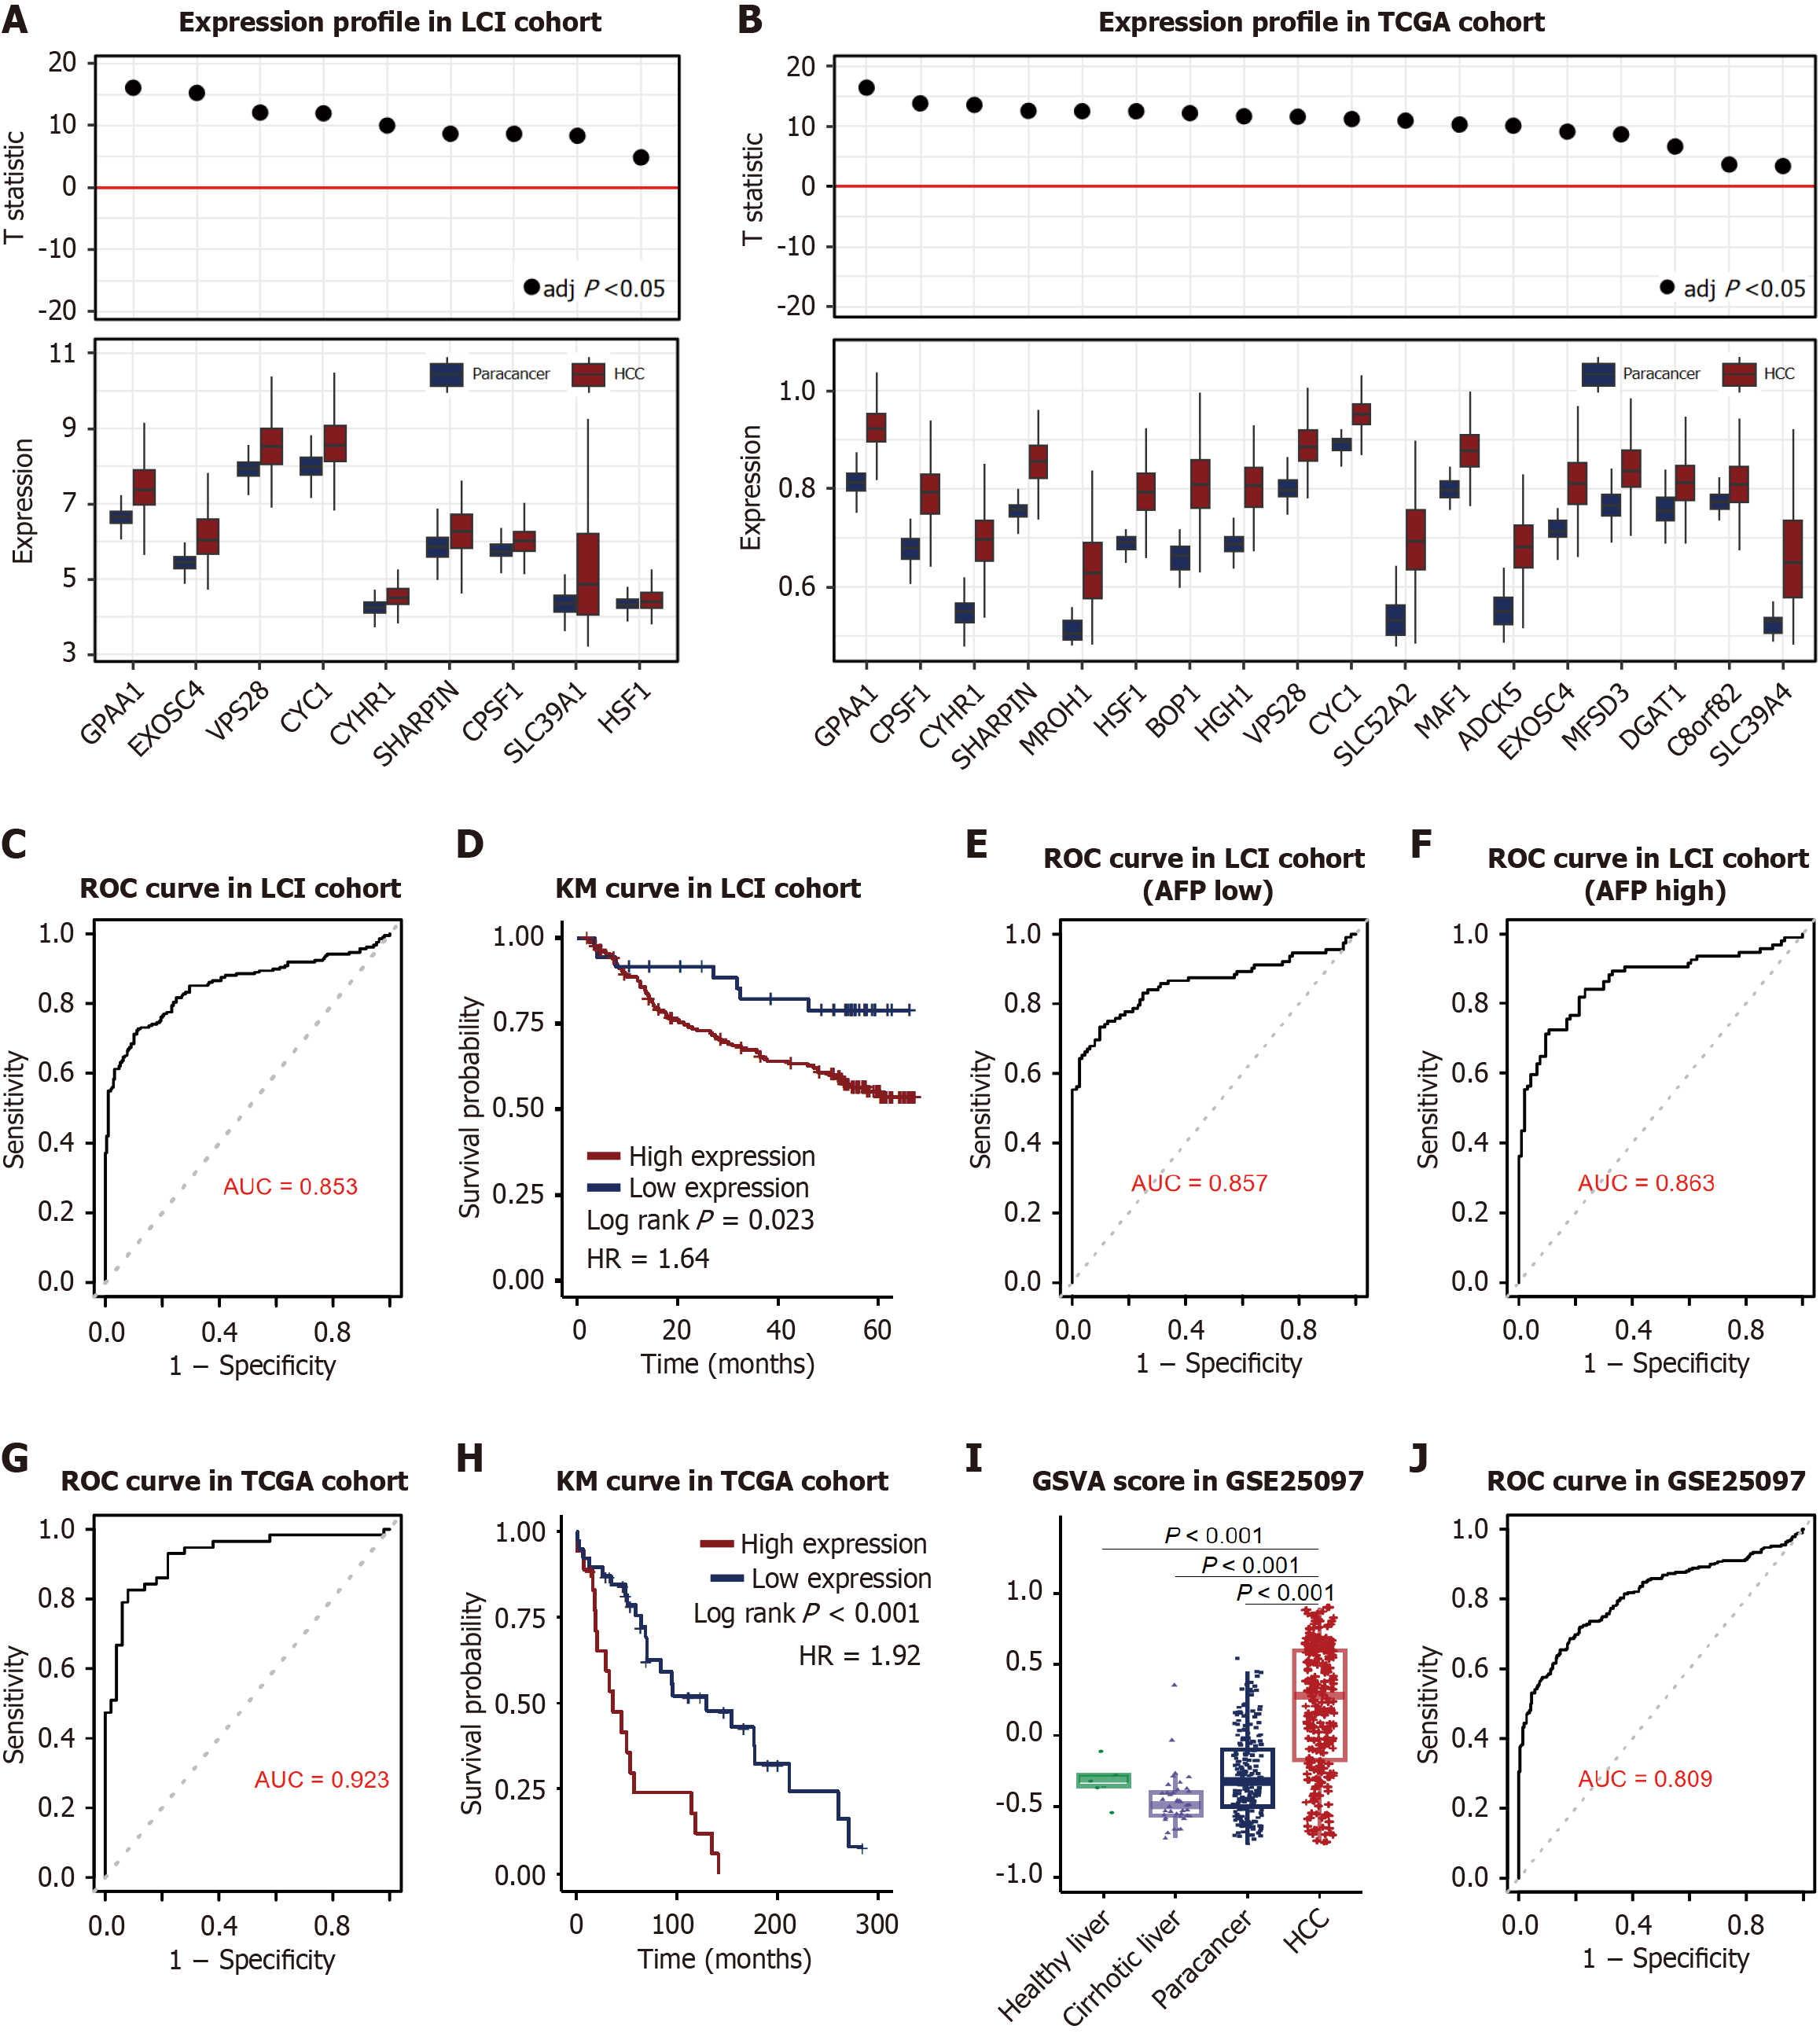
Figure 5 Enhancer-like chromatin peaks exhibited diagnostic and prognostic potential in hepatocellular carcinoma.
A: Overexpression of enhancer-hub genes in tumors vs adjacent normal tissues in Liver Cancer Institute cohort (n = 209). The upper panels showed the T-statistic from a paired t-test between tumor and non-tumor adjacent non-tumor tissues (NATs); B: Overexpression of enhancer-hub genes in tumors vs adjacent normal tissues in The Cancer Genome Atlascohort (n = 59). The upper panels showed the T-statistic from a paired t-test between tumor and NATs; C: Receiver operating characteristic (ROC) curve analysis of hub genes for diagnosing hepatocellular carcinoma in the LCI cohort (n = 209, area under the curve (AUC) = 0.853, 95% confidence interval (CI): 0.813-0.889); D: Kaplan-Meier survival analysis of hub genes in the LCI cohort (n = 209). High hub gene expression correlates with poor overall survival (P = 0.0233, hazard ratio = 1.64, 95%CI: 0.993-2.70); E: ROC curve analysis of hub genes for diagnosing hepatocellular carcinoma in the LCI cohort in low alpha fetoprotein subgroup (AFP < 300 ng/mL, n = 59, AUC = 0.857, 95%CI: 0.813-0.89); F: ROC curve analysis of hub genes for diagnosing hepatocellular carcinoma in the LCI cohort in high AFP subgroup (AFP ≥ 300 ng/mL, n = 50, AUC = 0.857, 95%CI: 0.813-0.89); G: ROC curve analysis of hub genes for diagnosing hepatocellular carcinoma in the TCGA cohort (n = 59, AUC = 0.923, 95%CI: 0.865-0.968); H: Kaplan-Meier survival analysis of hub genes in the TCGA cohort (n = 59). High hub gene expression correlates with poor overall survival (P < 0.001, hazard ratio = 1.92, 95%CI: 1.02-3.63); I: Gene set variation analysis score of 18 gene in GSE25097 cohort. Expression in hepatocellular carcinoma (n = 268) was higher than in NATs (n = 243), cirrhotic tissues (n = 40), and healthy liver samples (n = 6), P value was adjusted with the Benjamini-Hochberg method; J: ROC curve analysis of hub genes for diagnosing hepatocellular carcinoma in GSE25097 (n = 557, AUC = 0.809, 95%CI: 0.882-0.844). LCI: Liver Cancer Institute; TCGA: The Cancer Genome Atlas; ROC: Receiver operating characteristic; KM: Kaplan-Meier; AFP: Alpha fetoprotein; GSVA: Gene set variation analysis.
- Citation: Xi XL, Yang YD, Liu HL, Jiang J, Wu B. Chromatin accessibility module identified by single-cell sequencing underlies the diagnosis and prognosis of hepatocellular carcinoma. World J Hepatol 2025; 17(6): 107329
- URL: https://www.wjgnet.com/1948-5182/full/v17/i6/107329.htm
- DOI: https://dx.doi.org/10.4254/wjh.v17.i6.107329


