
















Copyright: ©Author(s) 2026.
World J Stem Cells. Sep 26, 2026; 18(9): 124197
Published online Sep 26, 2026. doi: 10.4252/wjsc.124197
Published online Sep 26, 2026. doi: 10.4252/wjsc.124197
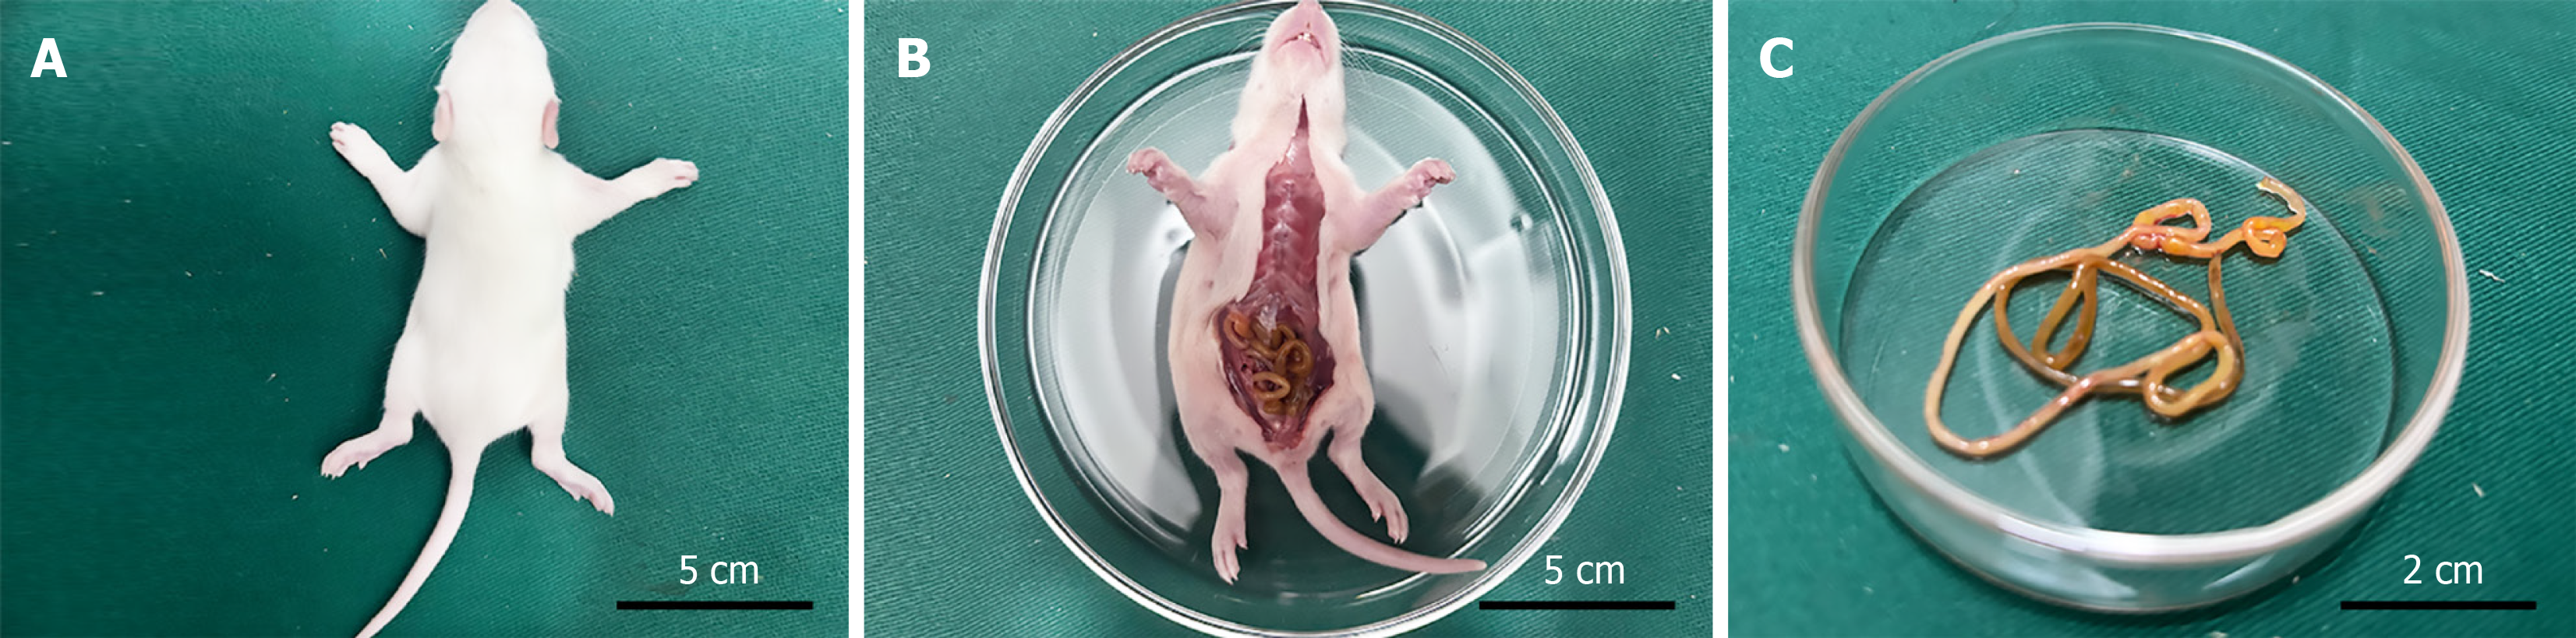
Figure 1 Rat intestinal tissue dissection.
A: Whole-body image of an SD rat. Scale bar: 5 cm; B: Abdominal cavity opened in the supine position, with the intestine and surrounding structures exposed. Scale bar: 5 cm; C: Close-up view of the jejunum. Scale bar: 2 cm.
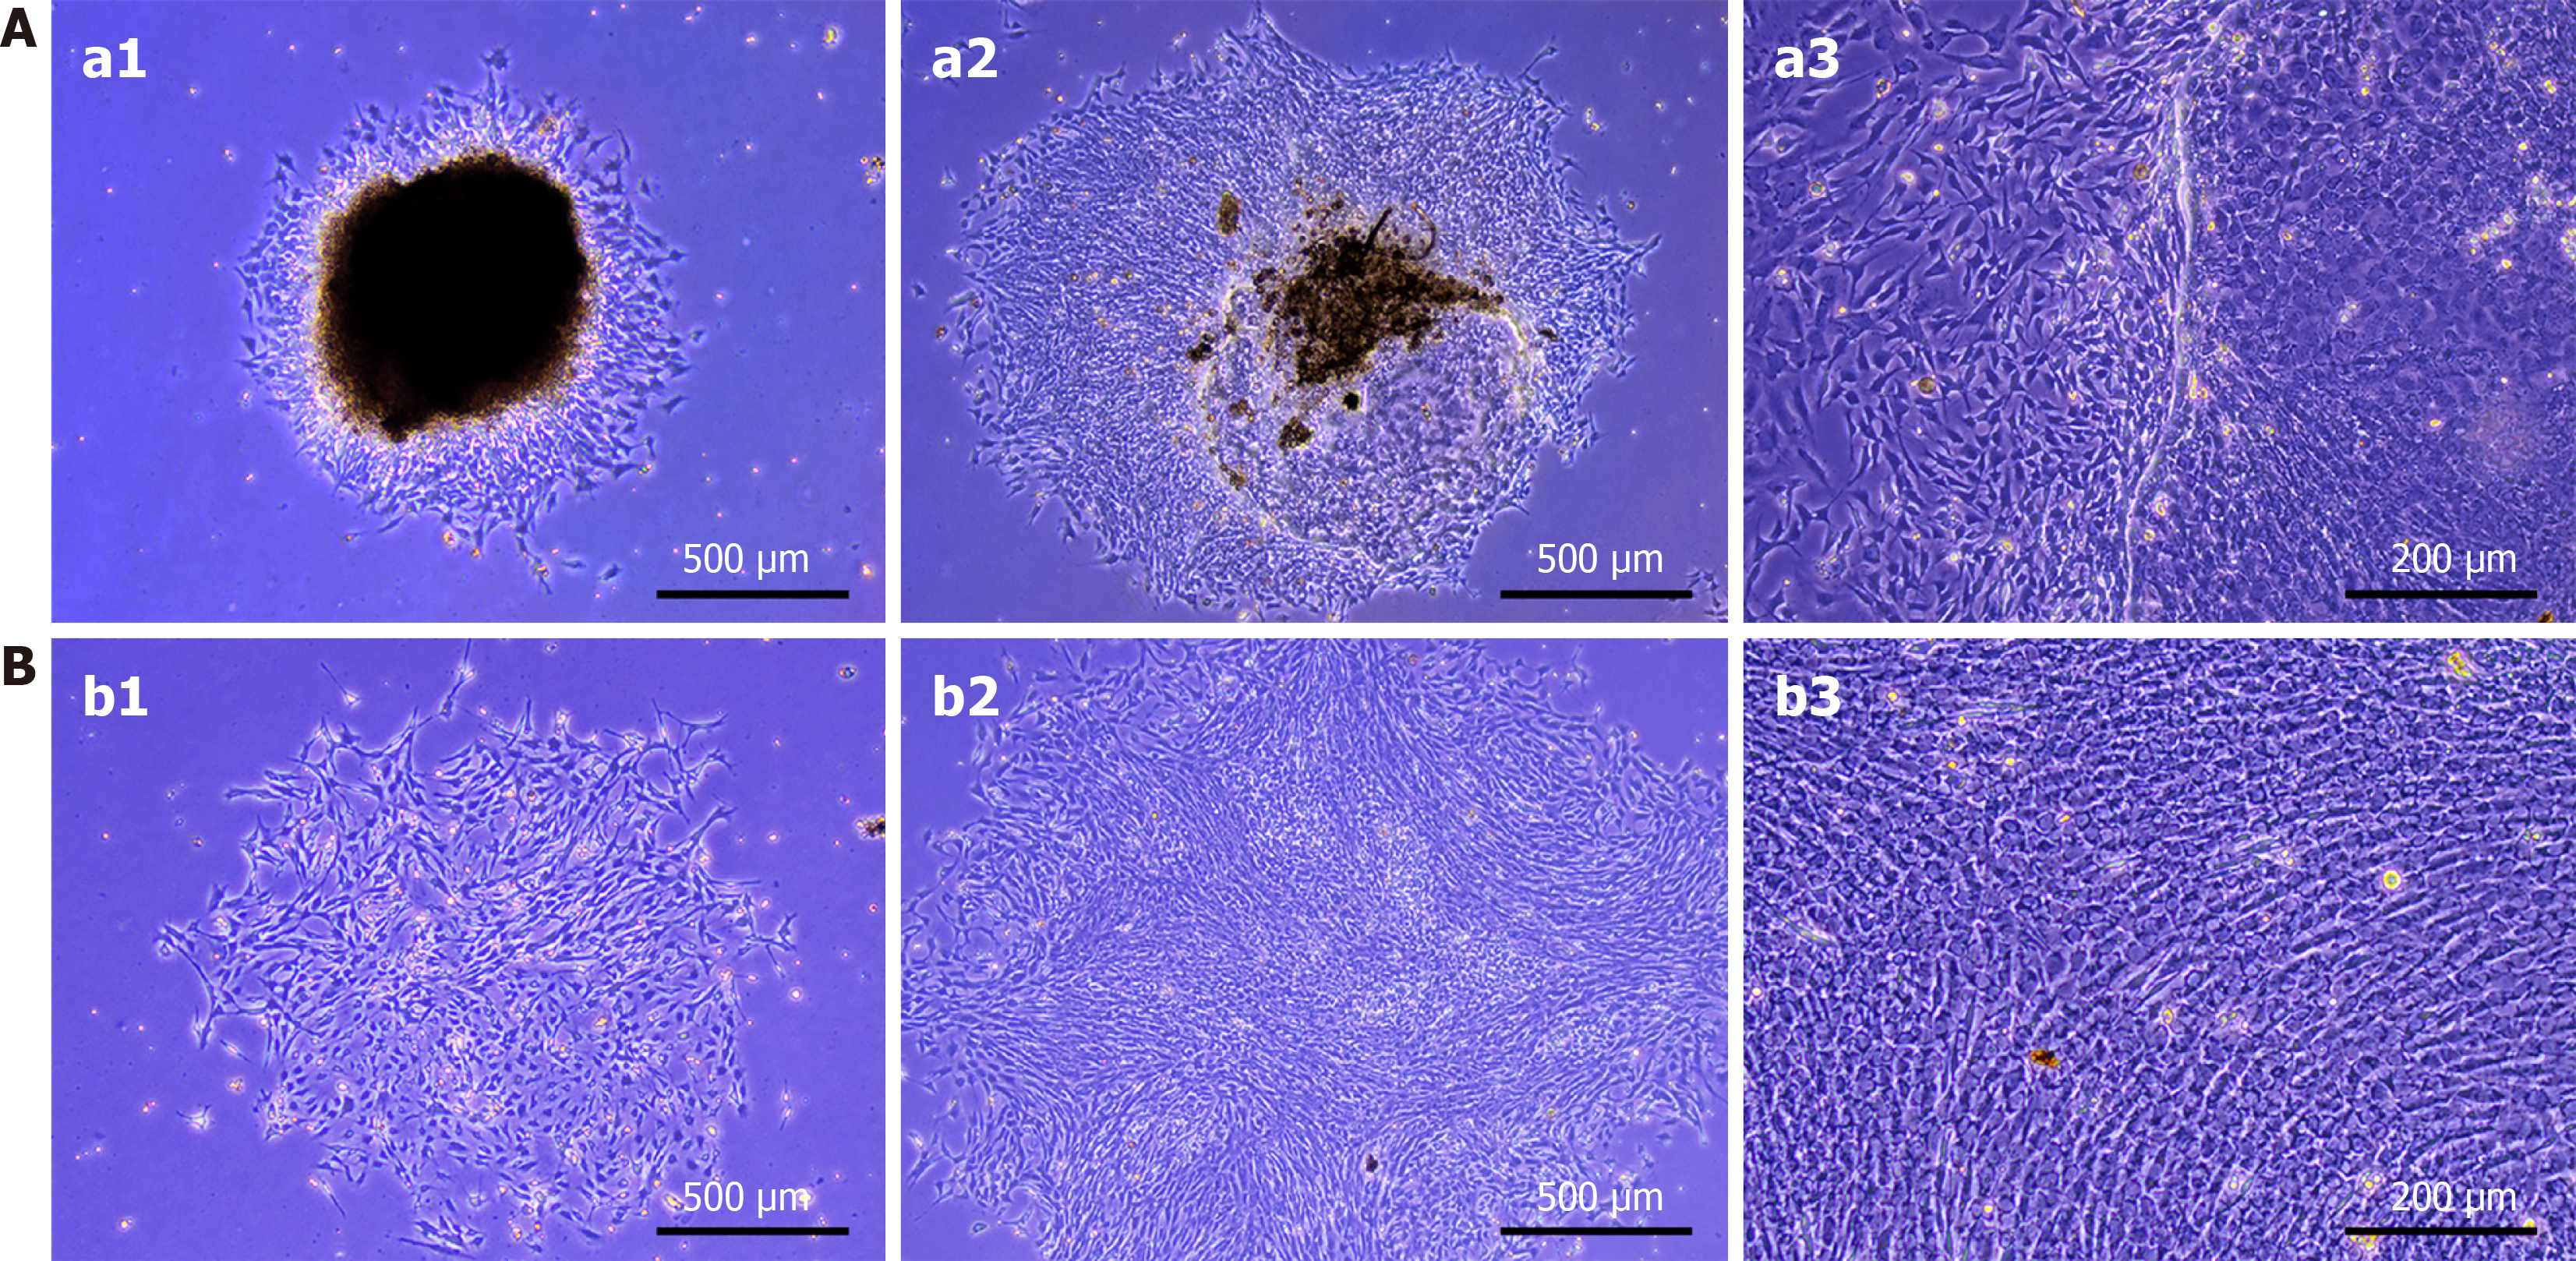
Figure 2 Morphological comparison of primary cells.
A: Conventional adherence (group A): 48 hours, cells migrated out (a1); 7 days, island-like colonies with contaminants (a2); 10 days, target cells and contaminants coexisted (a3); B: Density gradient centrifugation (group B): 48 hours, rapid adhesion (b1); 7 days, homogeneous colonies (b2); 10 days, uniform fibroblast-like morphology (b3). Scale bars: 500 μm (a1, a2, b1, b2) and 200 μm (a3, b3).
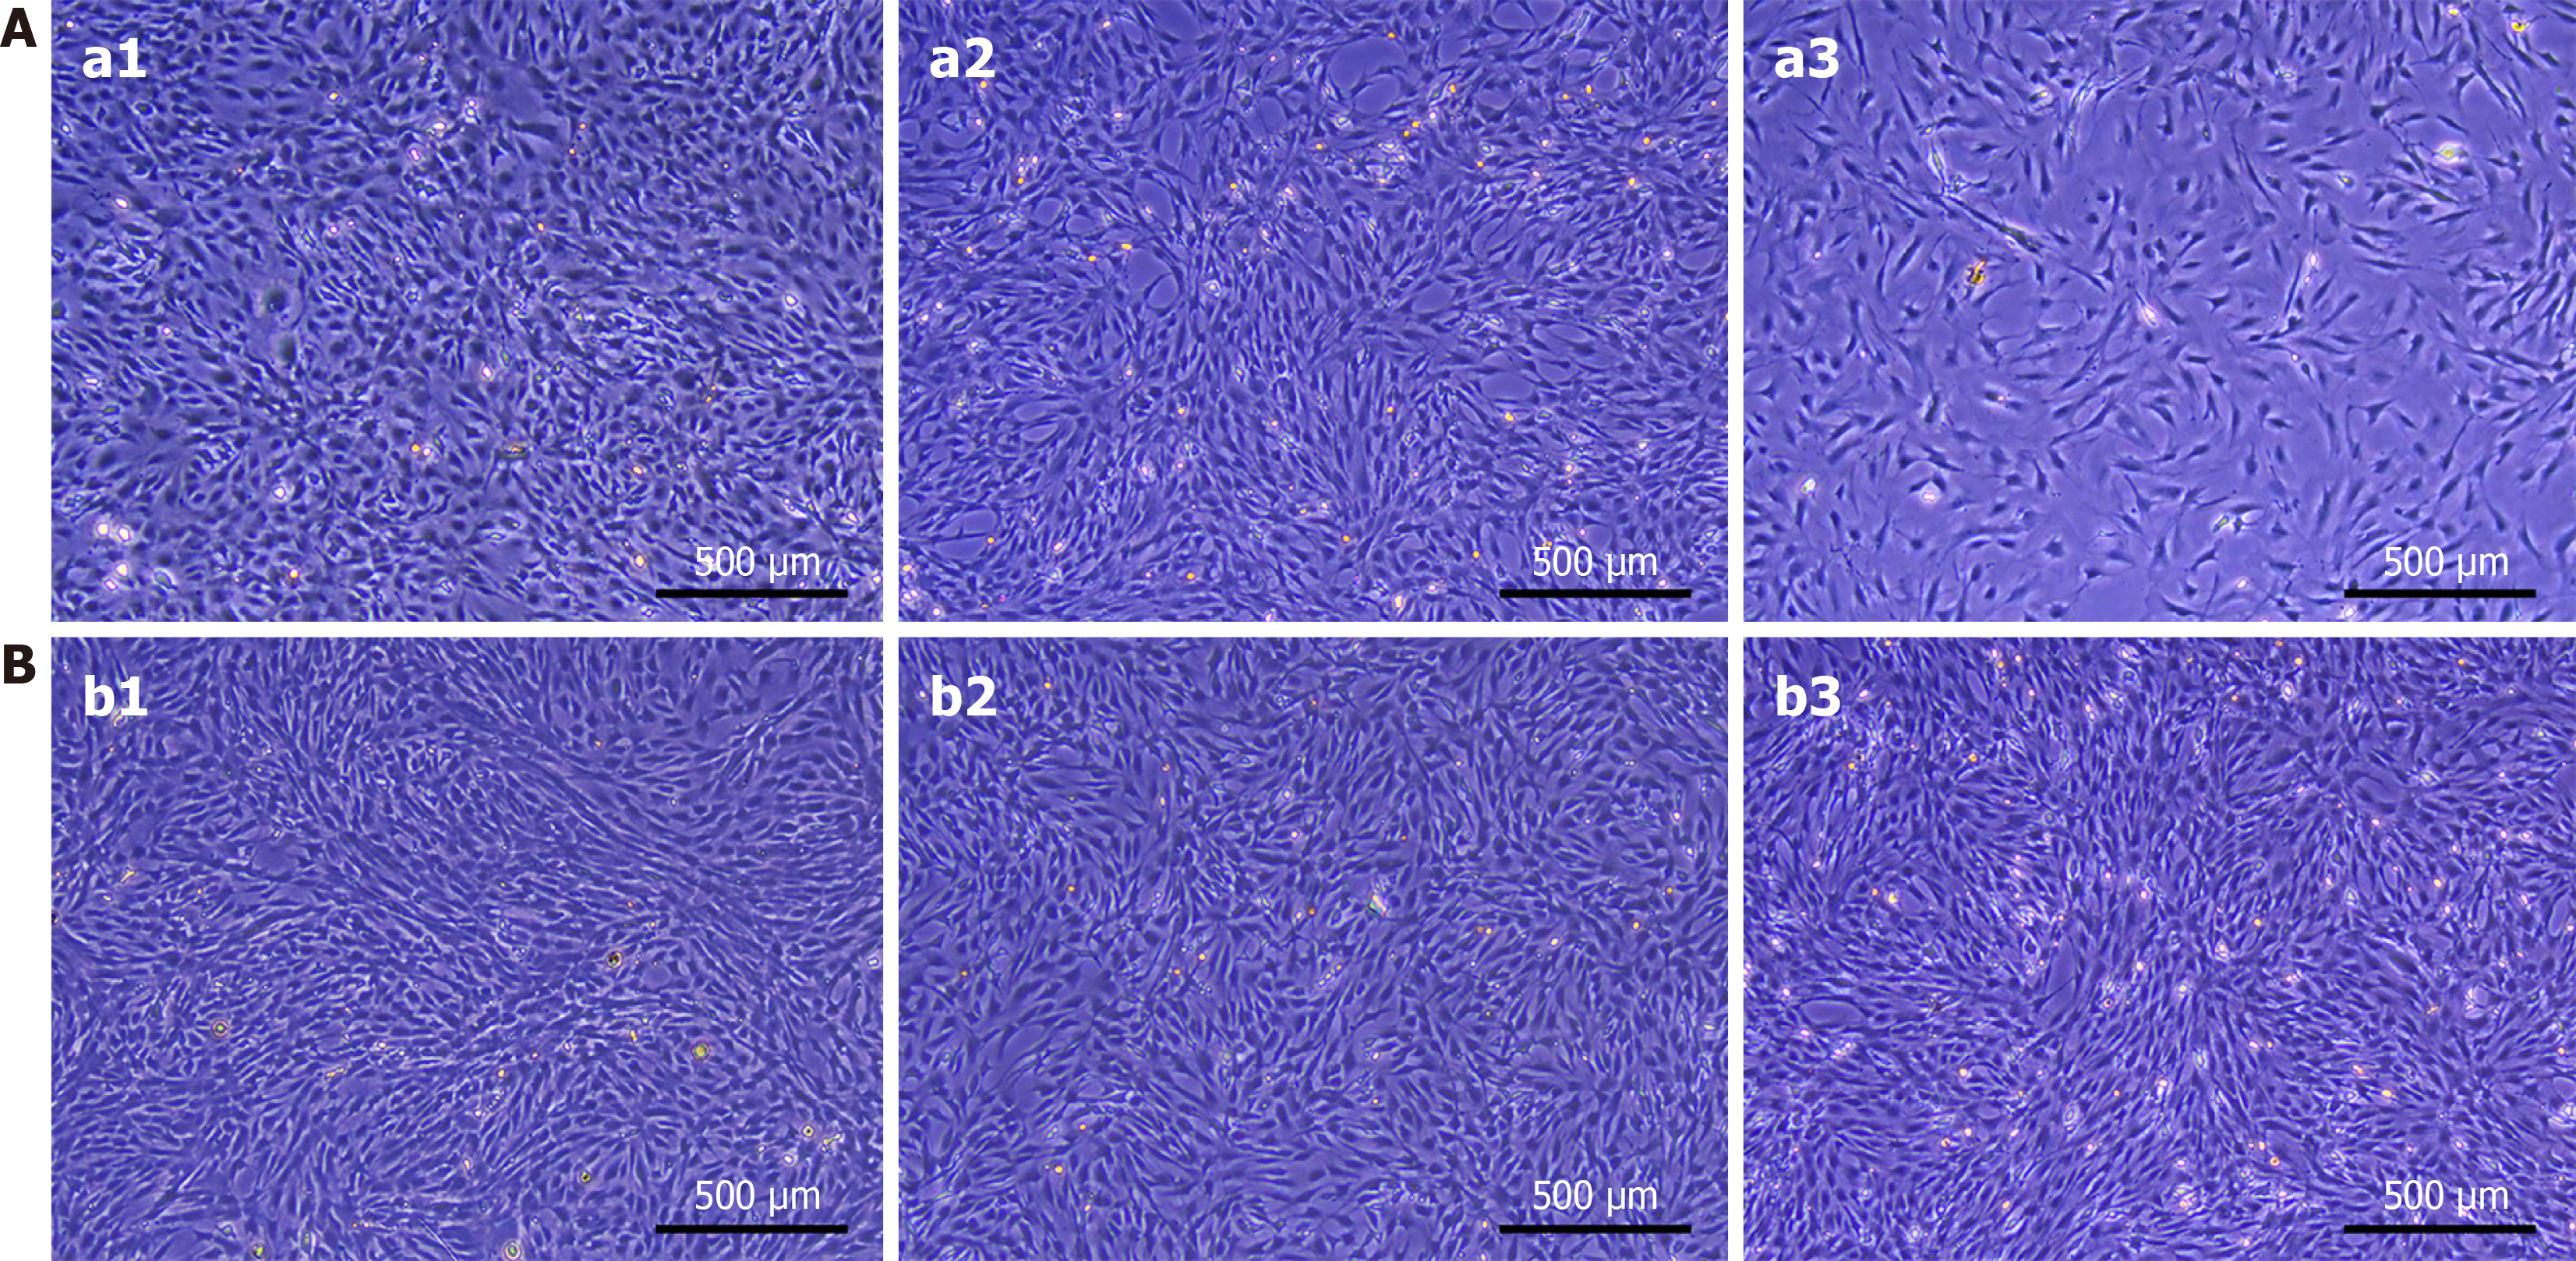
Figure 3 Morphological comparison of passaged cells.
A: Group A: Passage 3 (P3) cells exhibited a mixture of fusiform and polygonal cells (a1); P6 cells showed an increase in cytoplasmic granules (a2); P9, senescent cells with a flattened, widened “cicada-wing-like” appearance (a3); B: Group B: P3 cells are uniformly spindle-shaped and arranged in a swirl pattern (b1); P6, vigorous proliferation (b2); P9, dense and uniform morphology with good adhesion (b3). Scale bar: 500 μm.
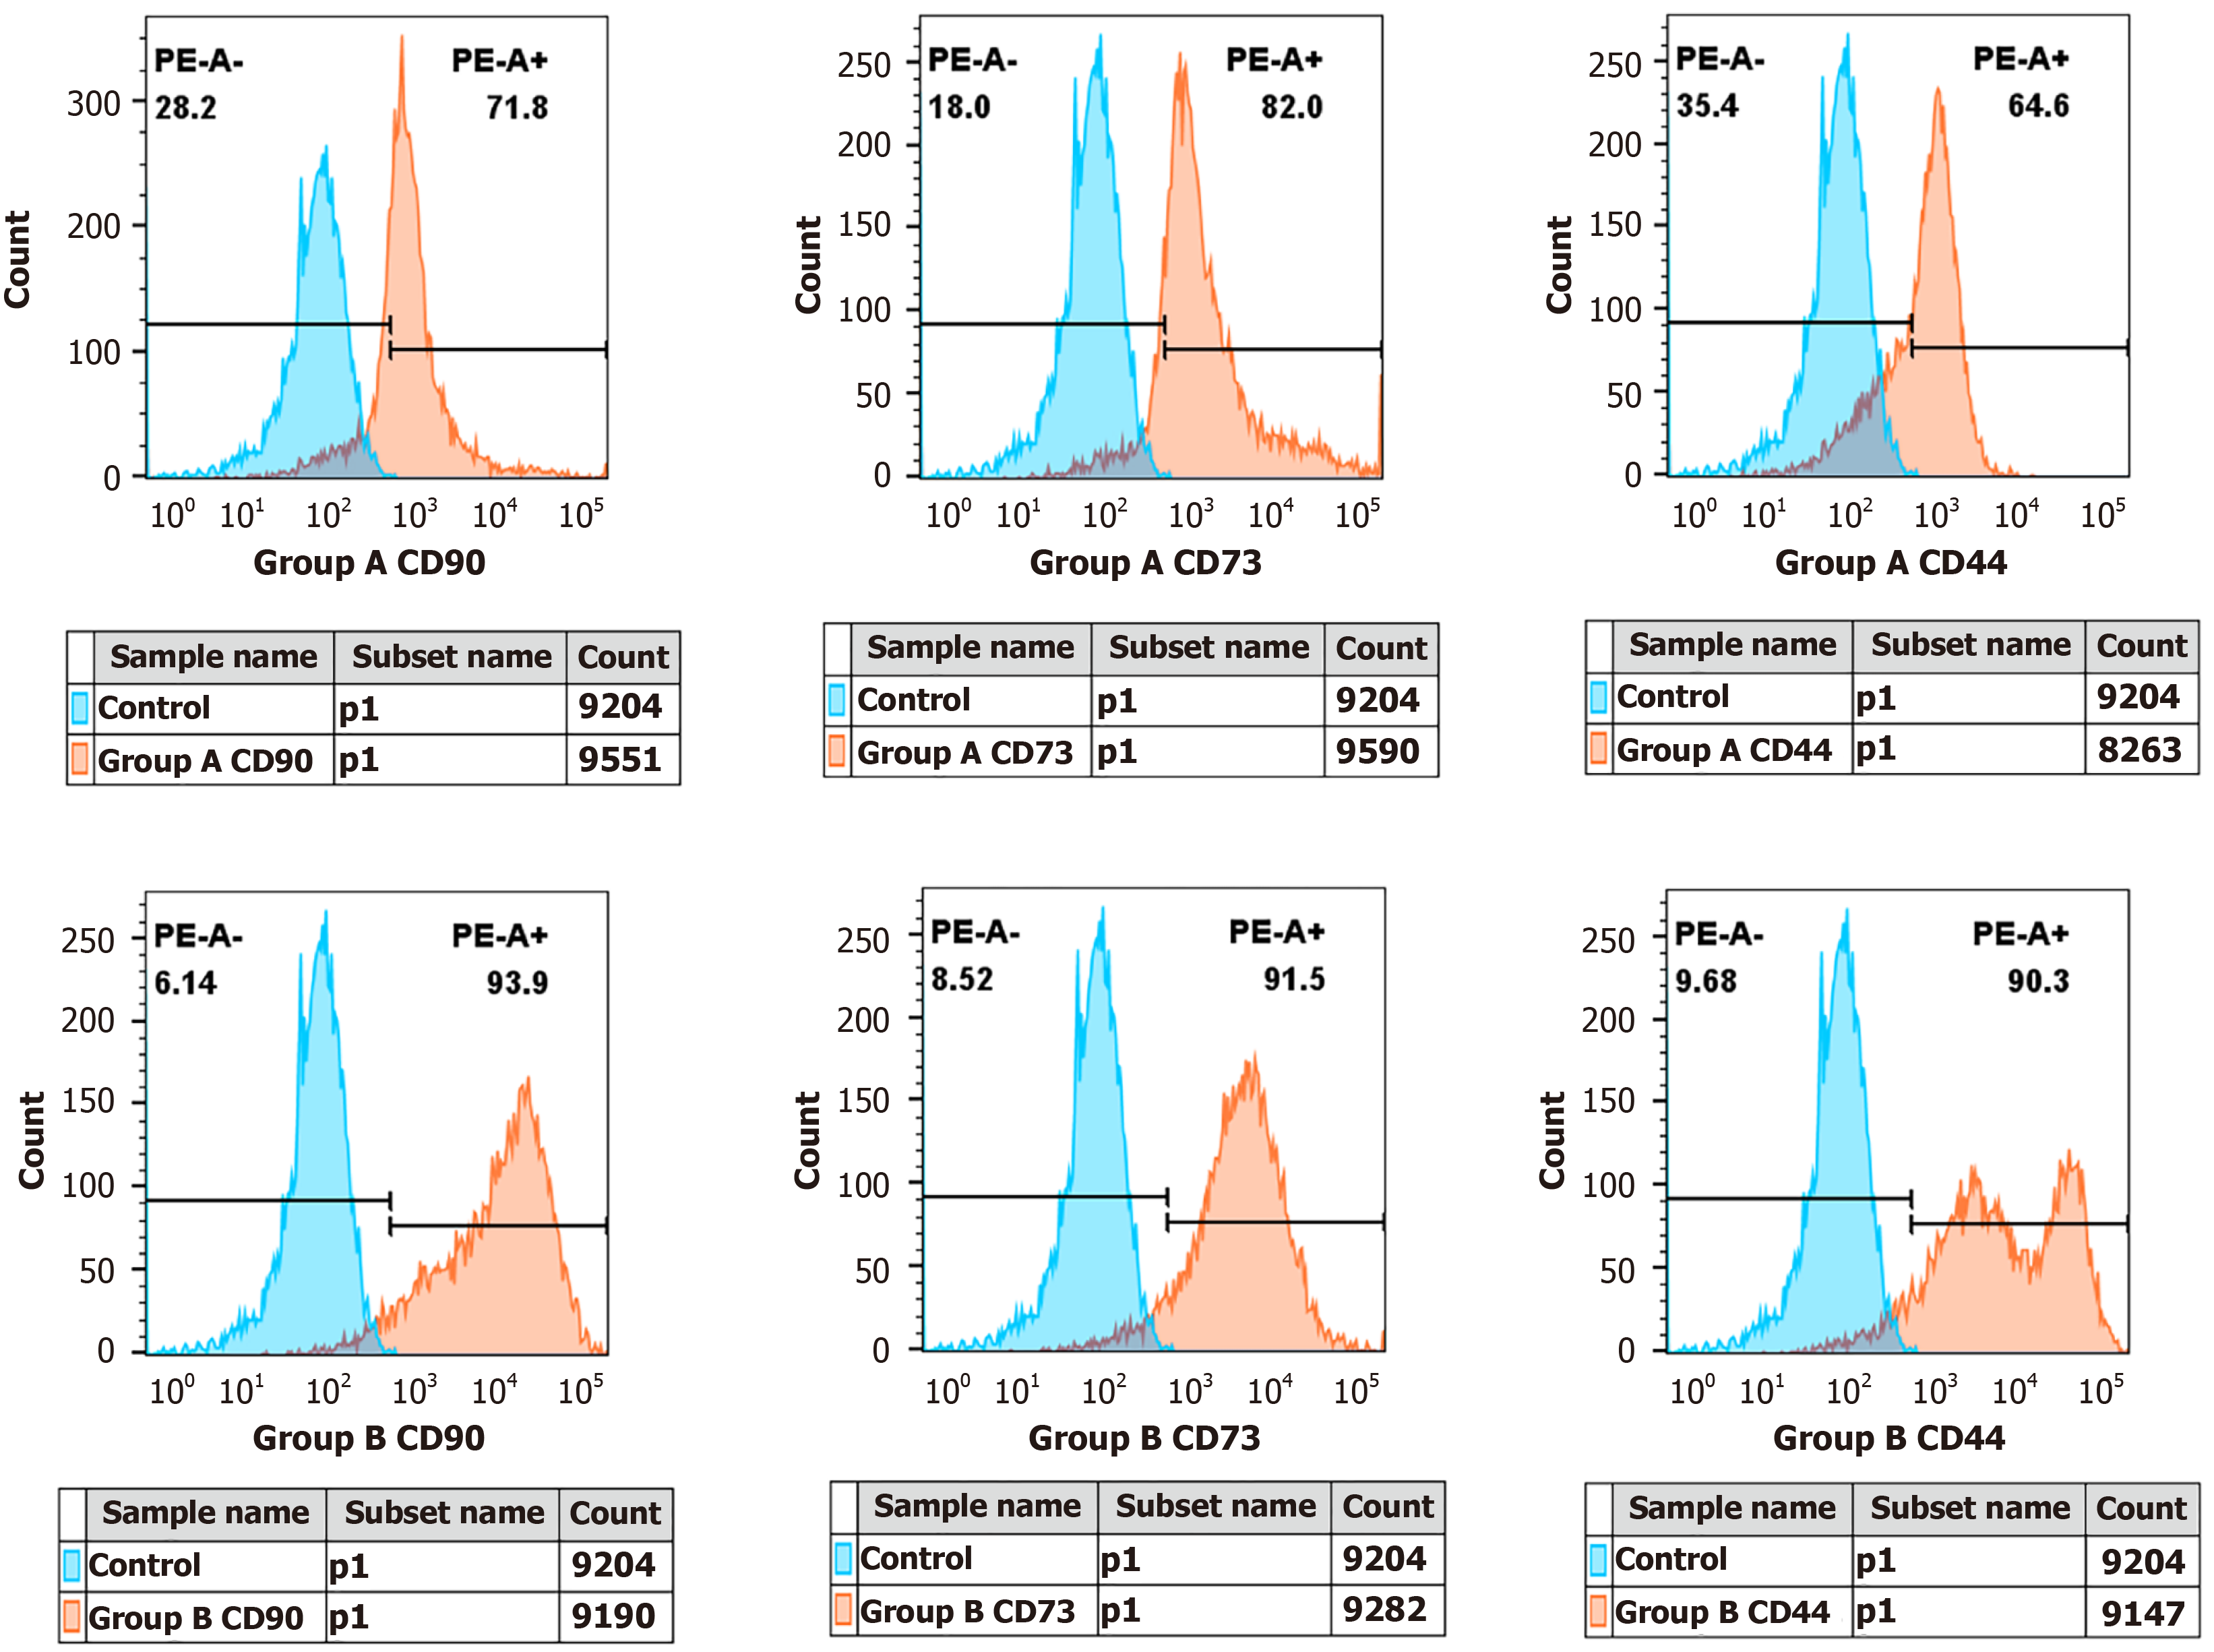
Figure 4 Expression of positive markers.
Representative histograms showing the expression of positive markers (CD90, CD73, CD44) in group A and group B. Data are presented as overlays with isotype controls.
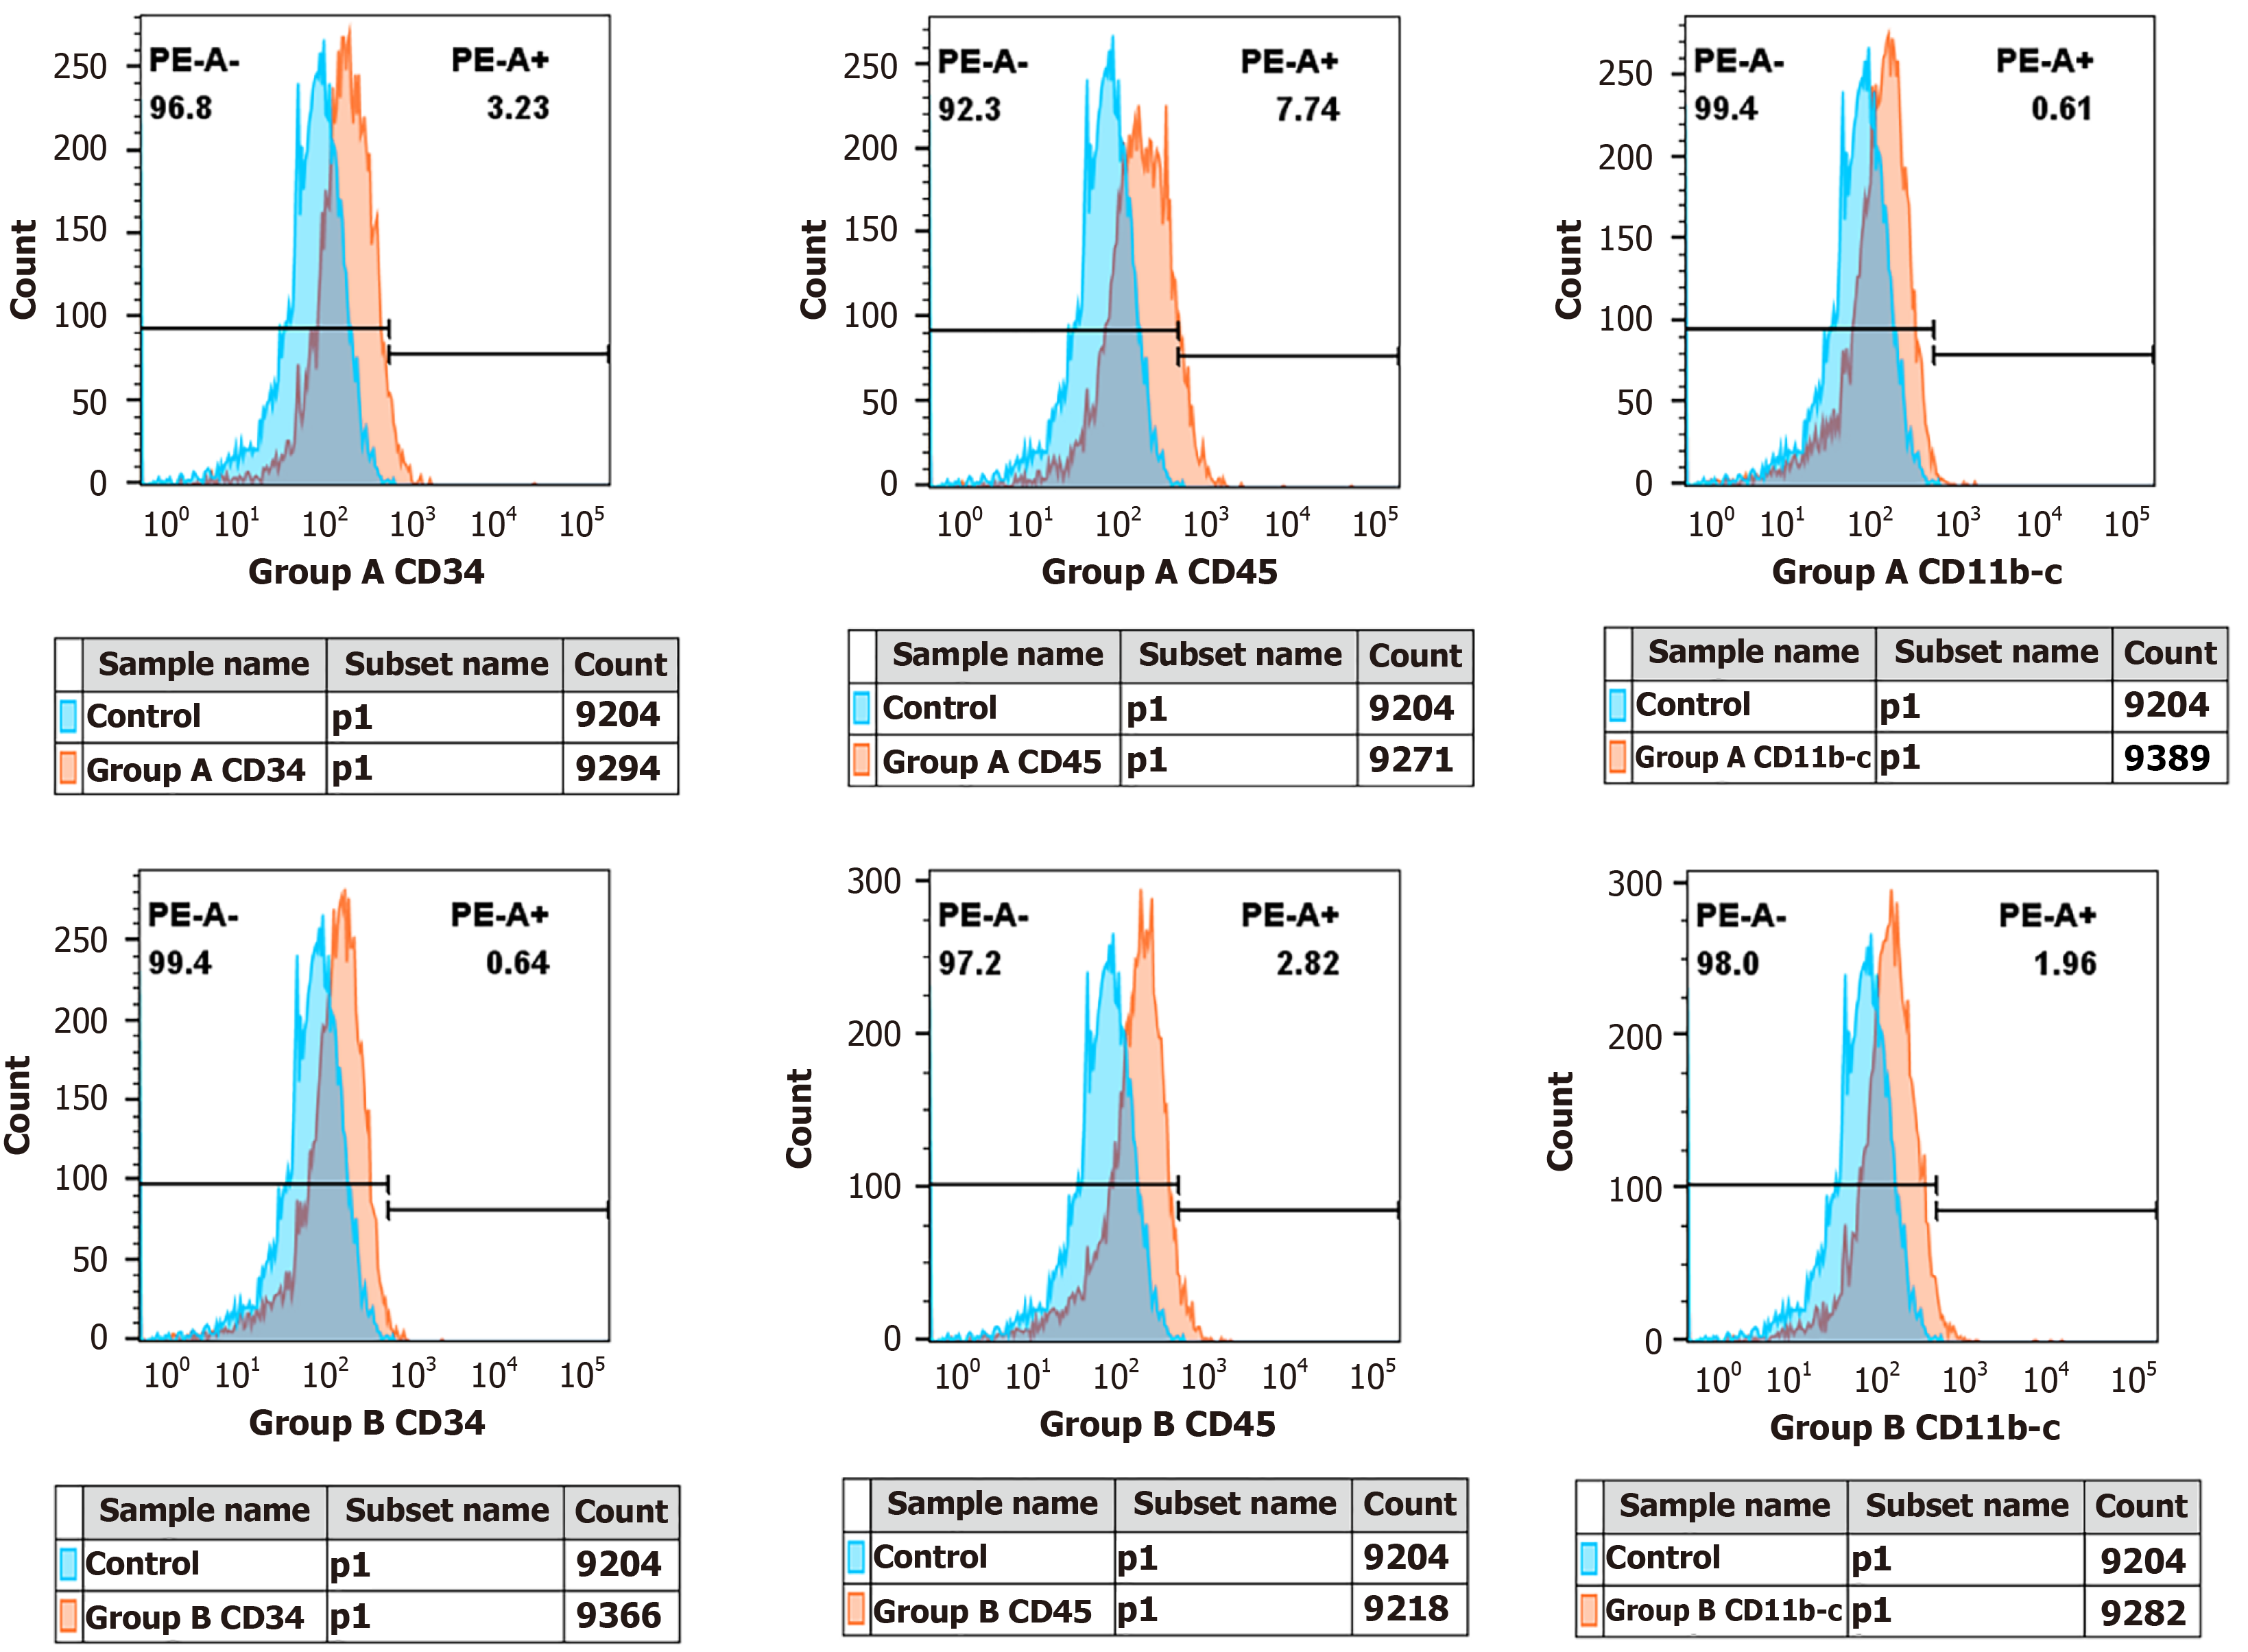
Figure 5 Expression of negative markers.
Representative histograms showing the expression of negative markers (CD34, CD45, CD11b/c) in group A and group B. Data are presented as overlays with isotype controls.
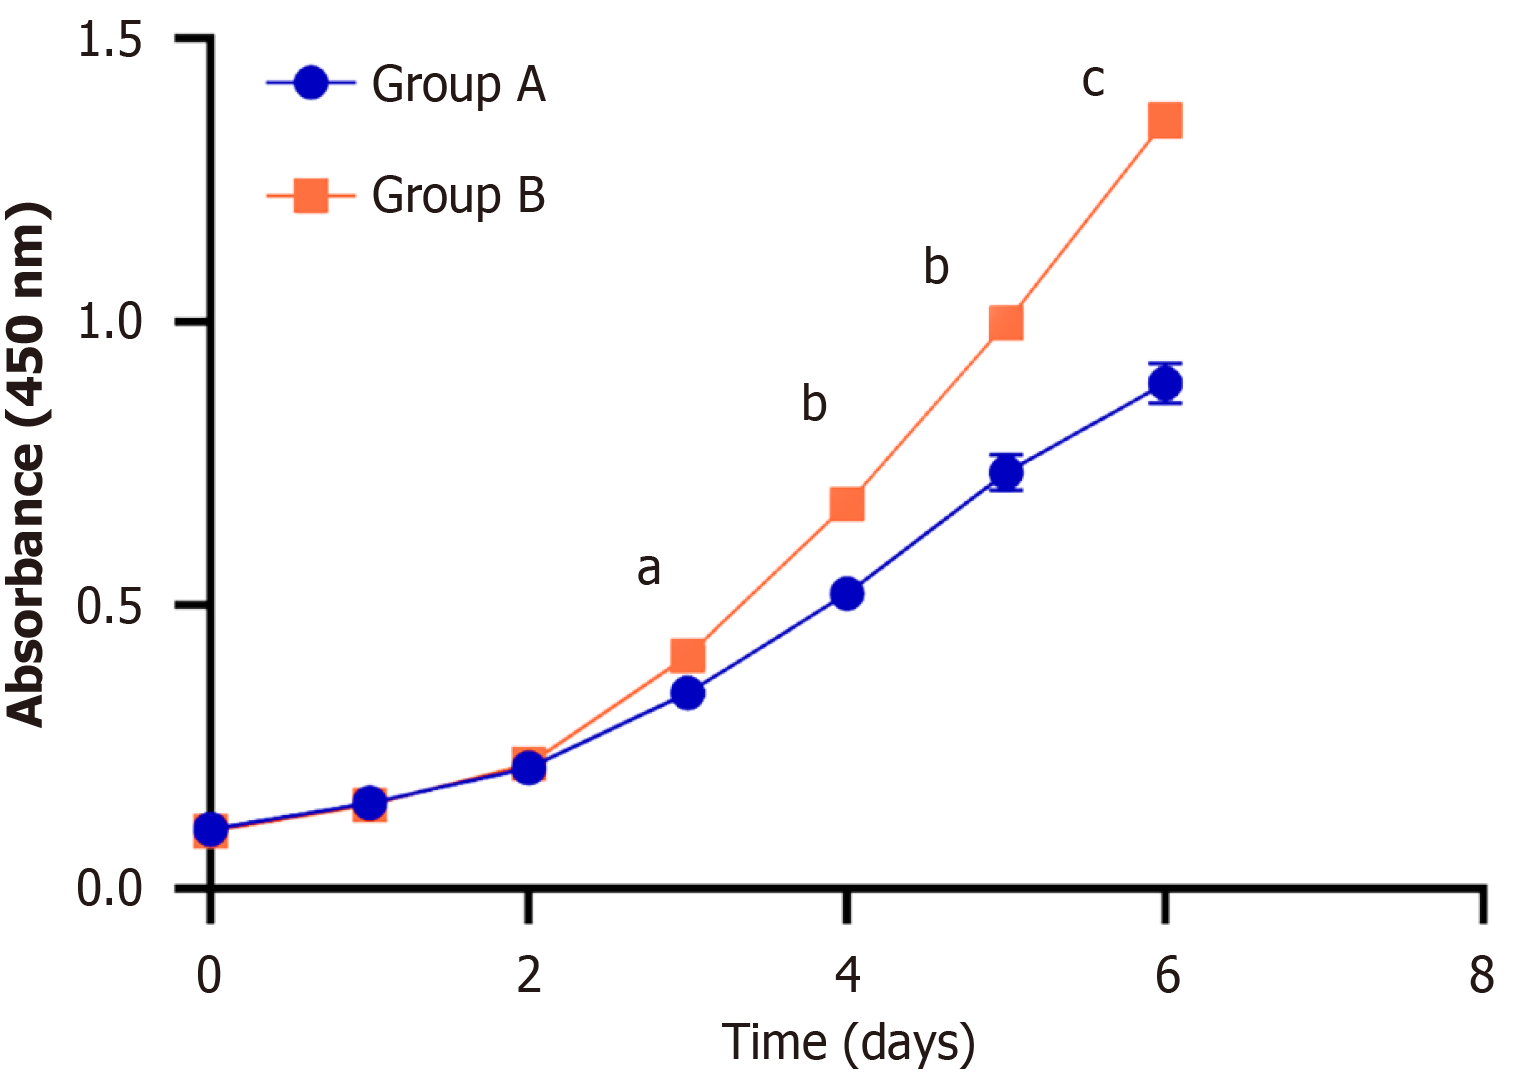
Figure 6 Proliferation curves of passage 4 cells isolated by the two methods.
Cell proliferation was assessed by CCK-8 assay at days 0-6. Data are expressed as mean ± SEM (n = 5). aP < 0.05, bP < 0.01, cP < 0.001 vs group A.
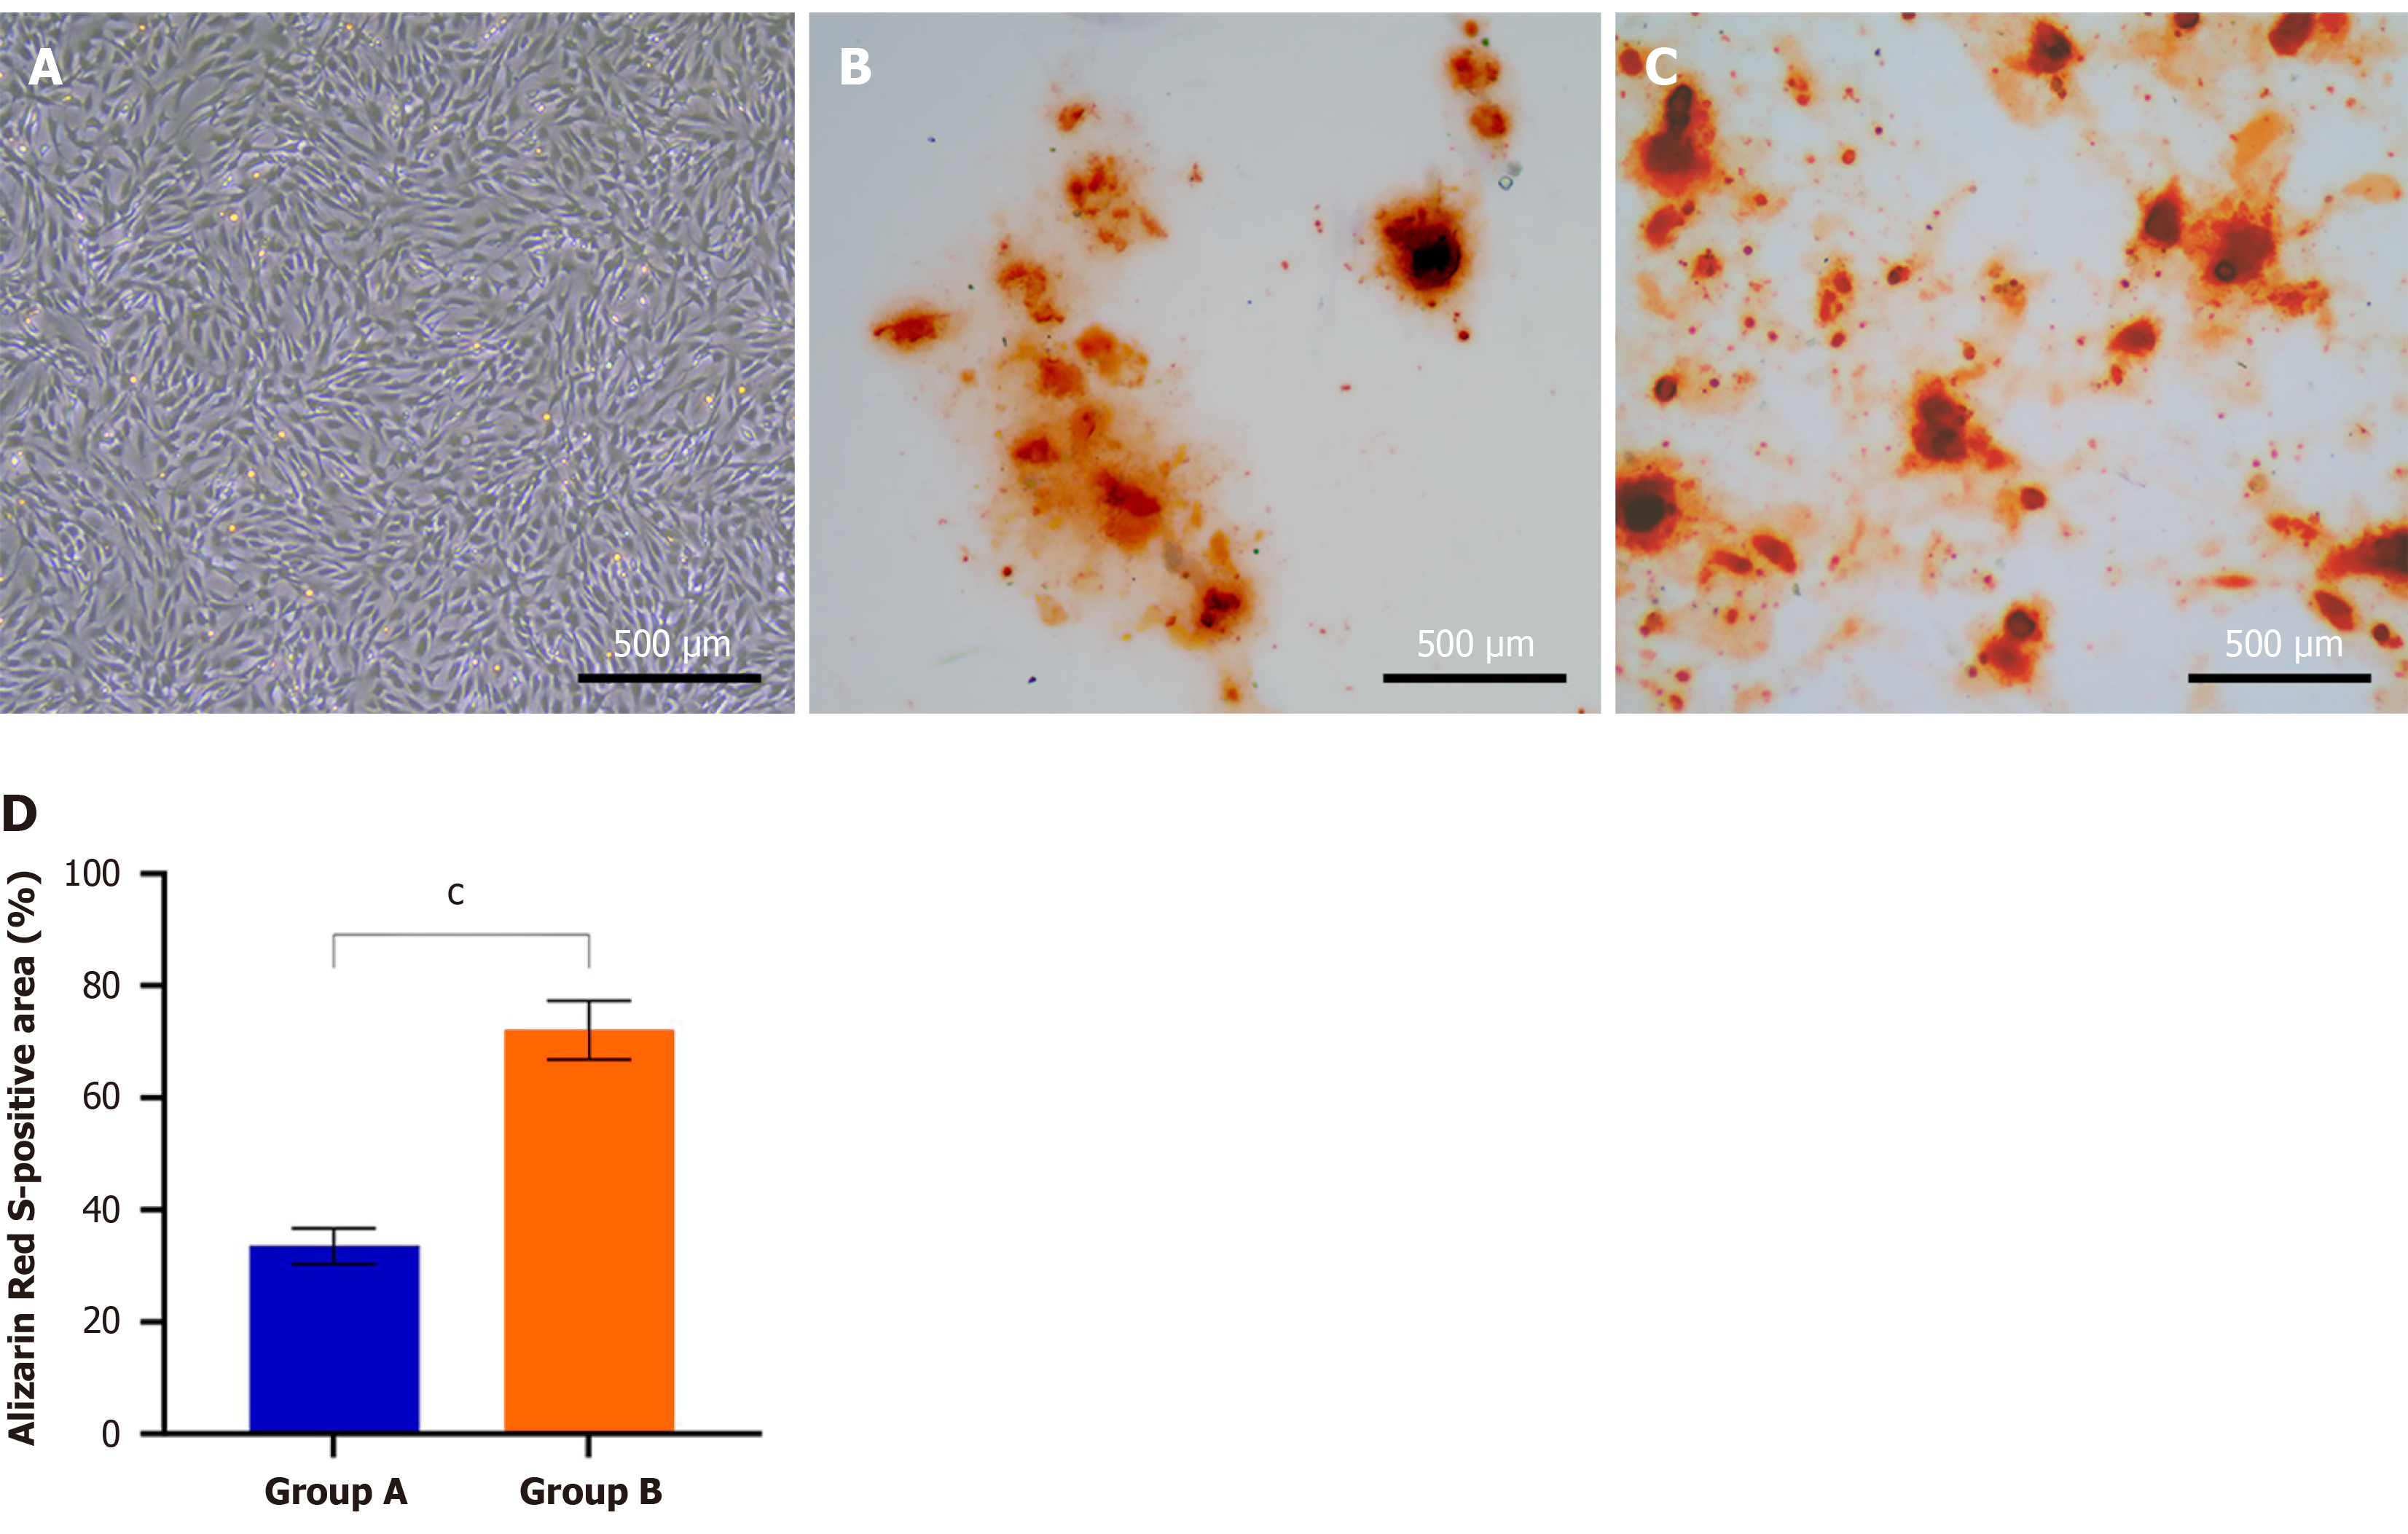
Figure 7 Osteogenic differentiation of passage 4 cells isolated by the two methods.
A: Control (non-induced), scale bar: 500 μm; B: Group A (conventional adherence), scale bar: 500 μm; C: Group B (density gradient centrifugation), scale bar: 500 μm; D: Quantitative analysis of Alizarin Red S-positive area. Data are expressed as mean ± SD (n = 3). cP < 0.001 vs group A.
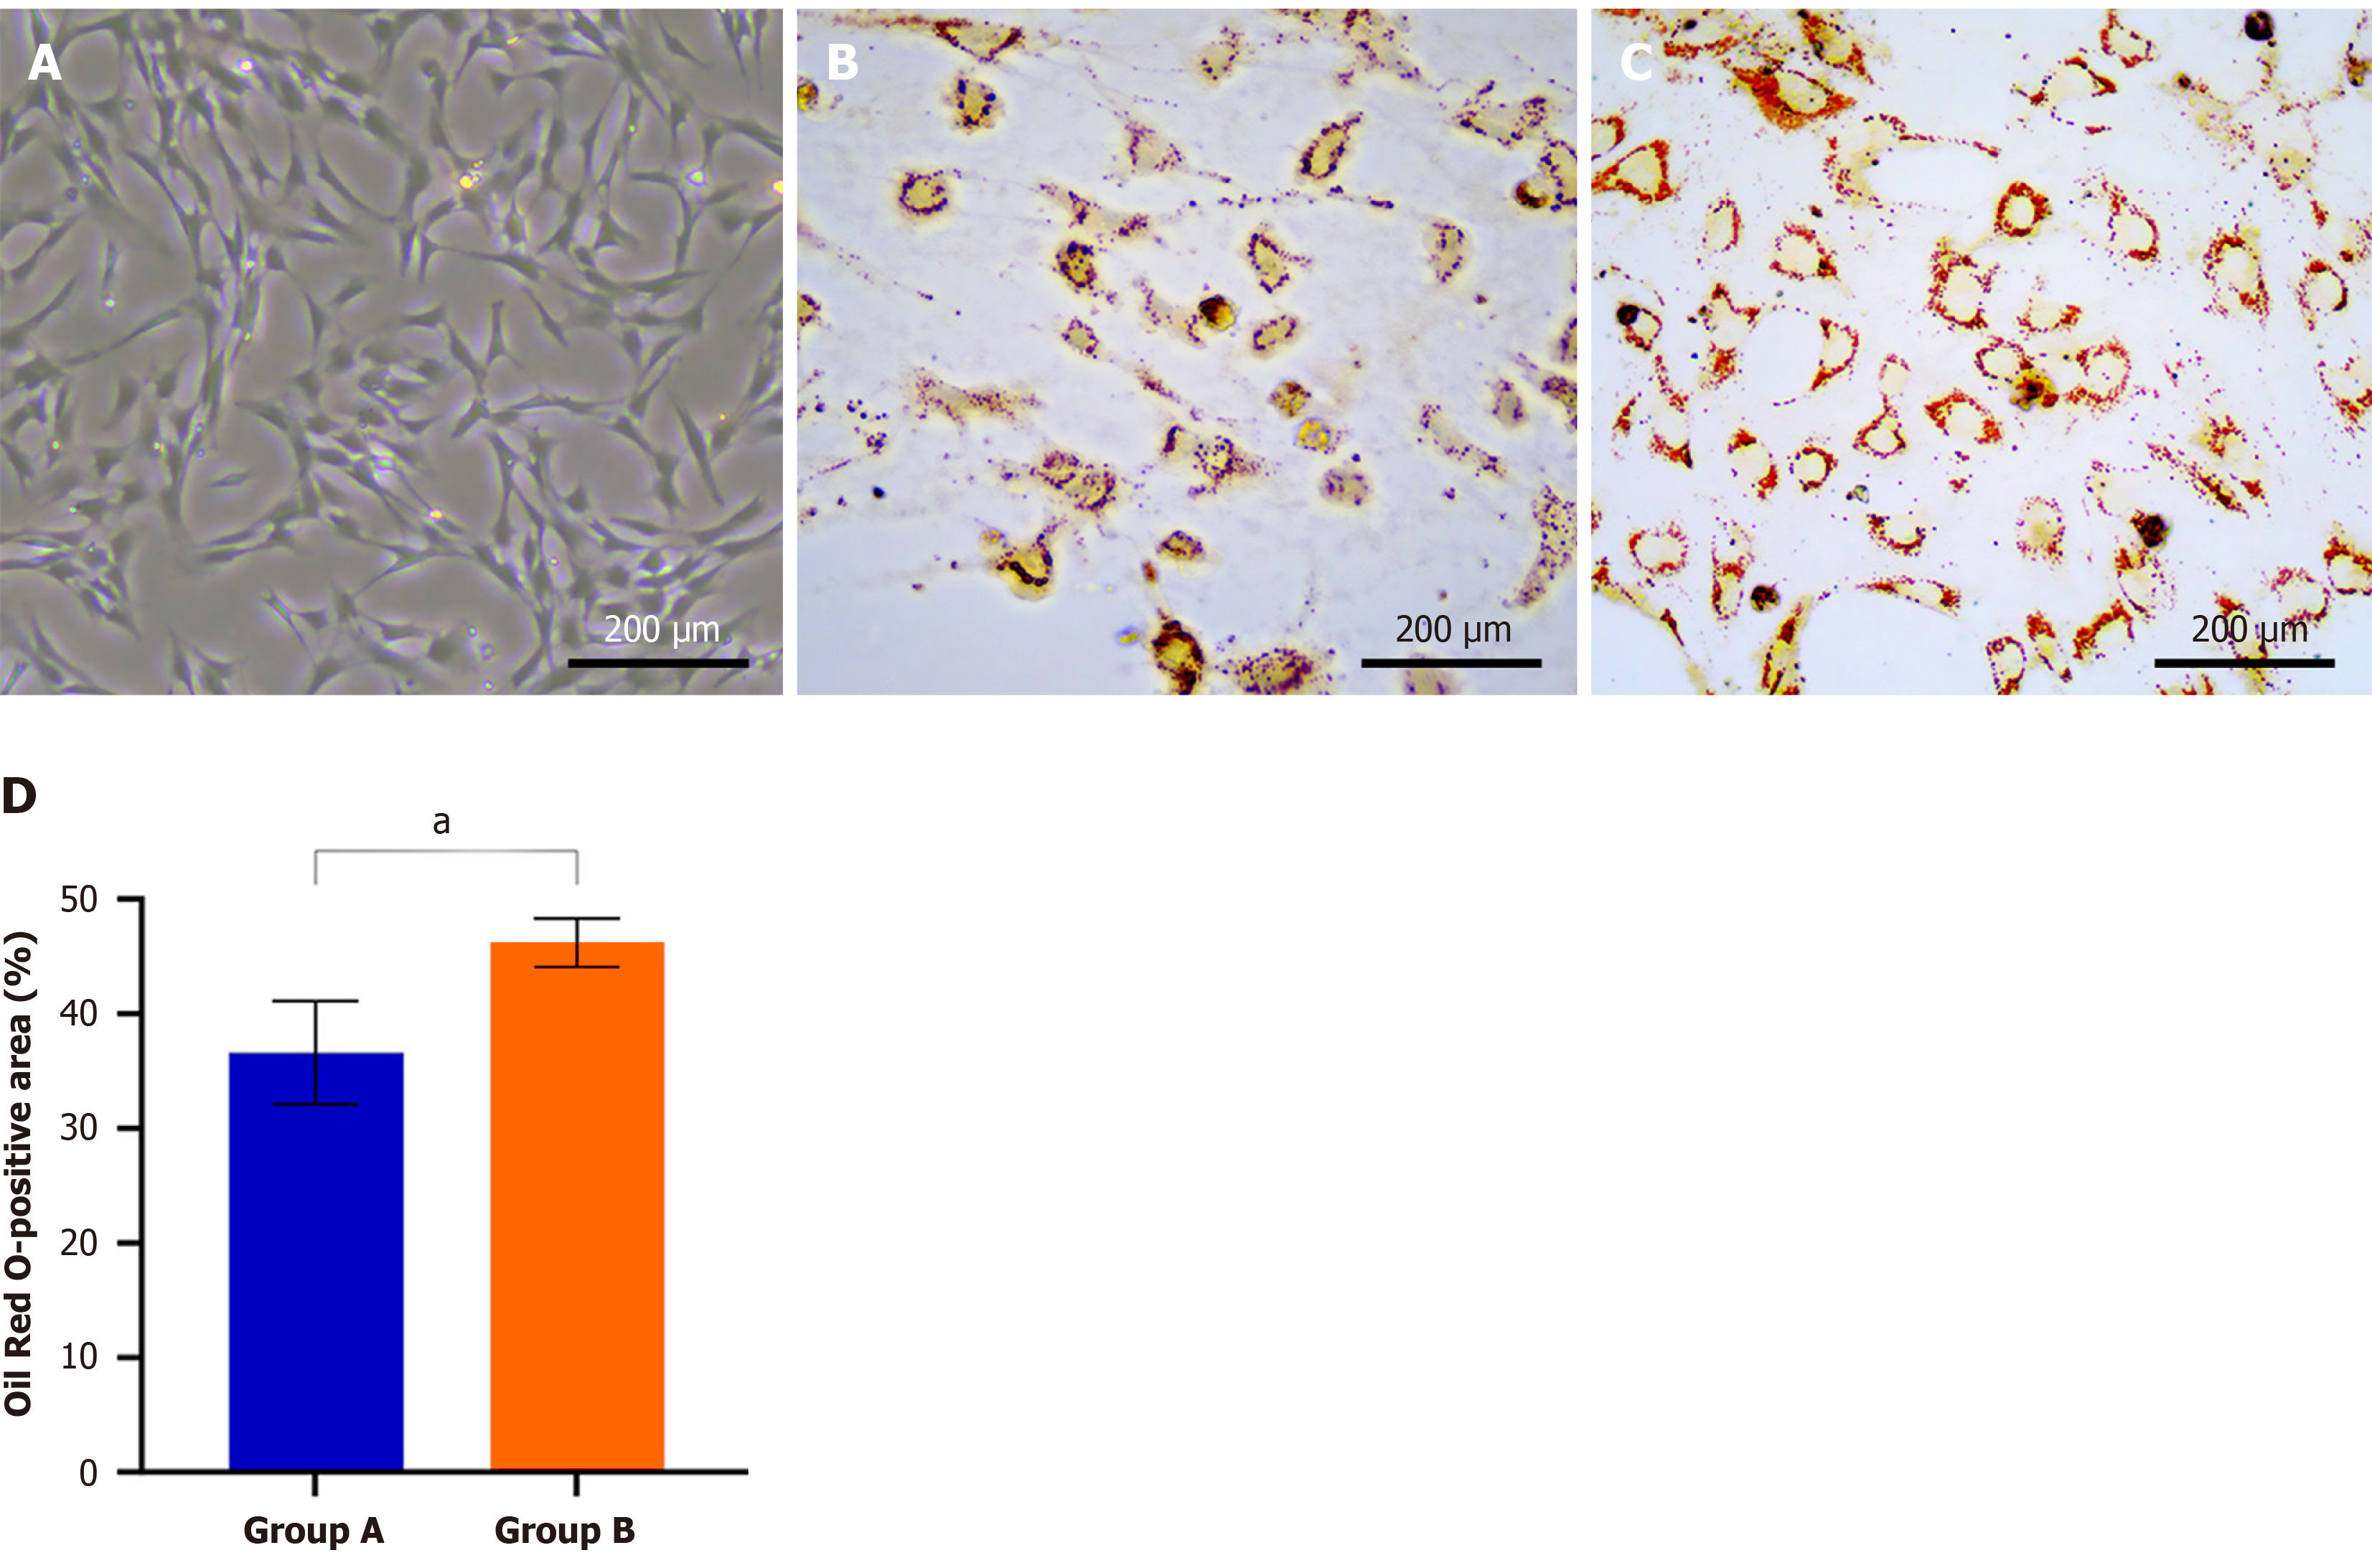
Figure 8 Adipogenic differentiation of passage 4 cells isolated by the two methods.
A: Control (non-induced), scale bar: 200 μm; B: Group A (conventional adherence), scale bar: 200 μm; C: Group B (density gradient centrifugation), scale bar: 200 μm; D: Quantitative analysis of Oil Red O-positive area. Data are expressed as mean ± SD (n = 3). aP < 0.05 vs group A.
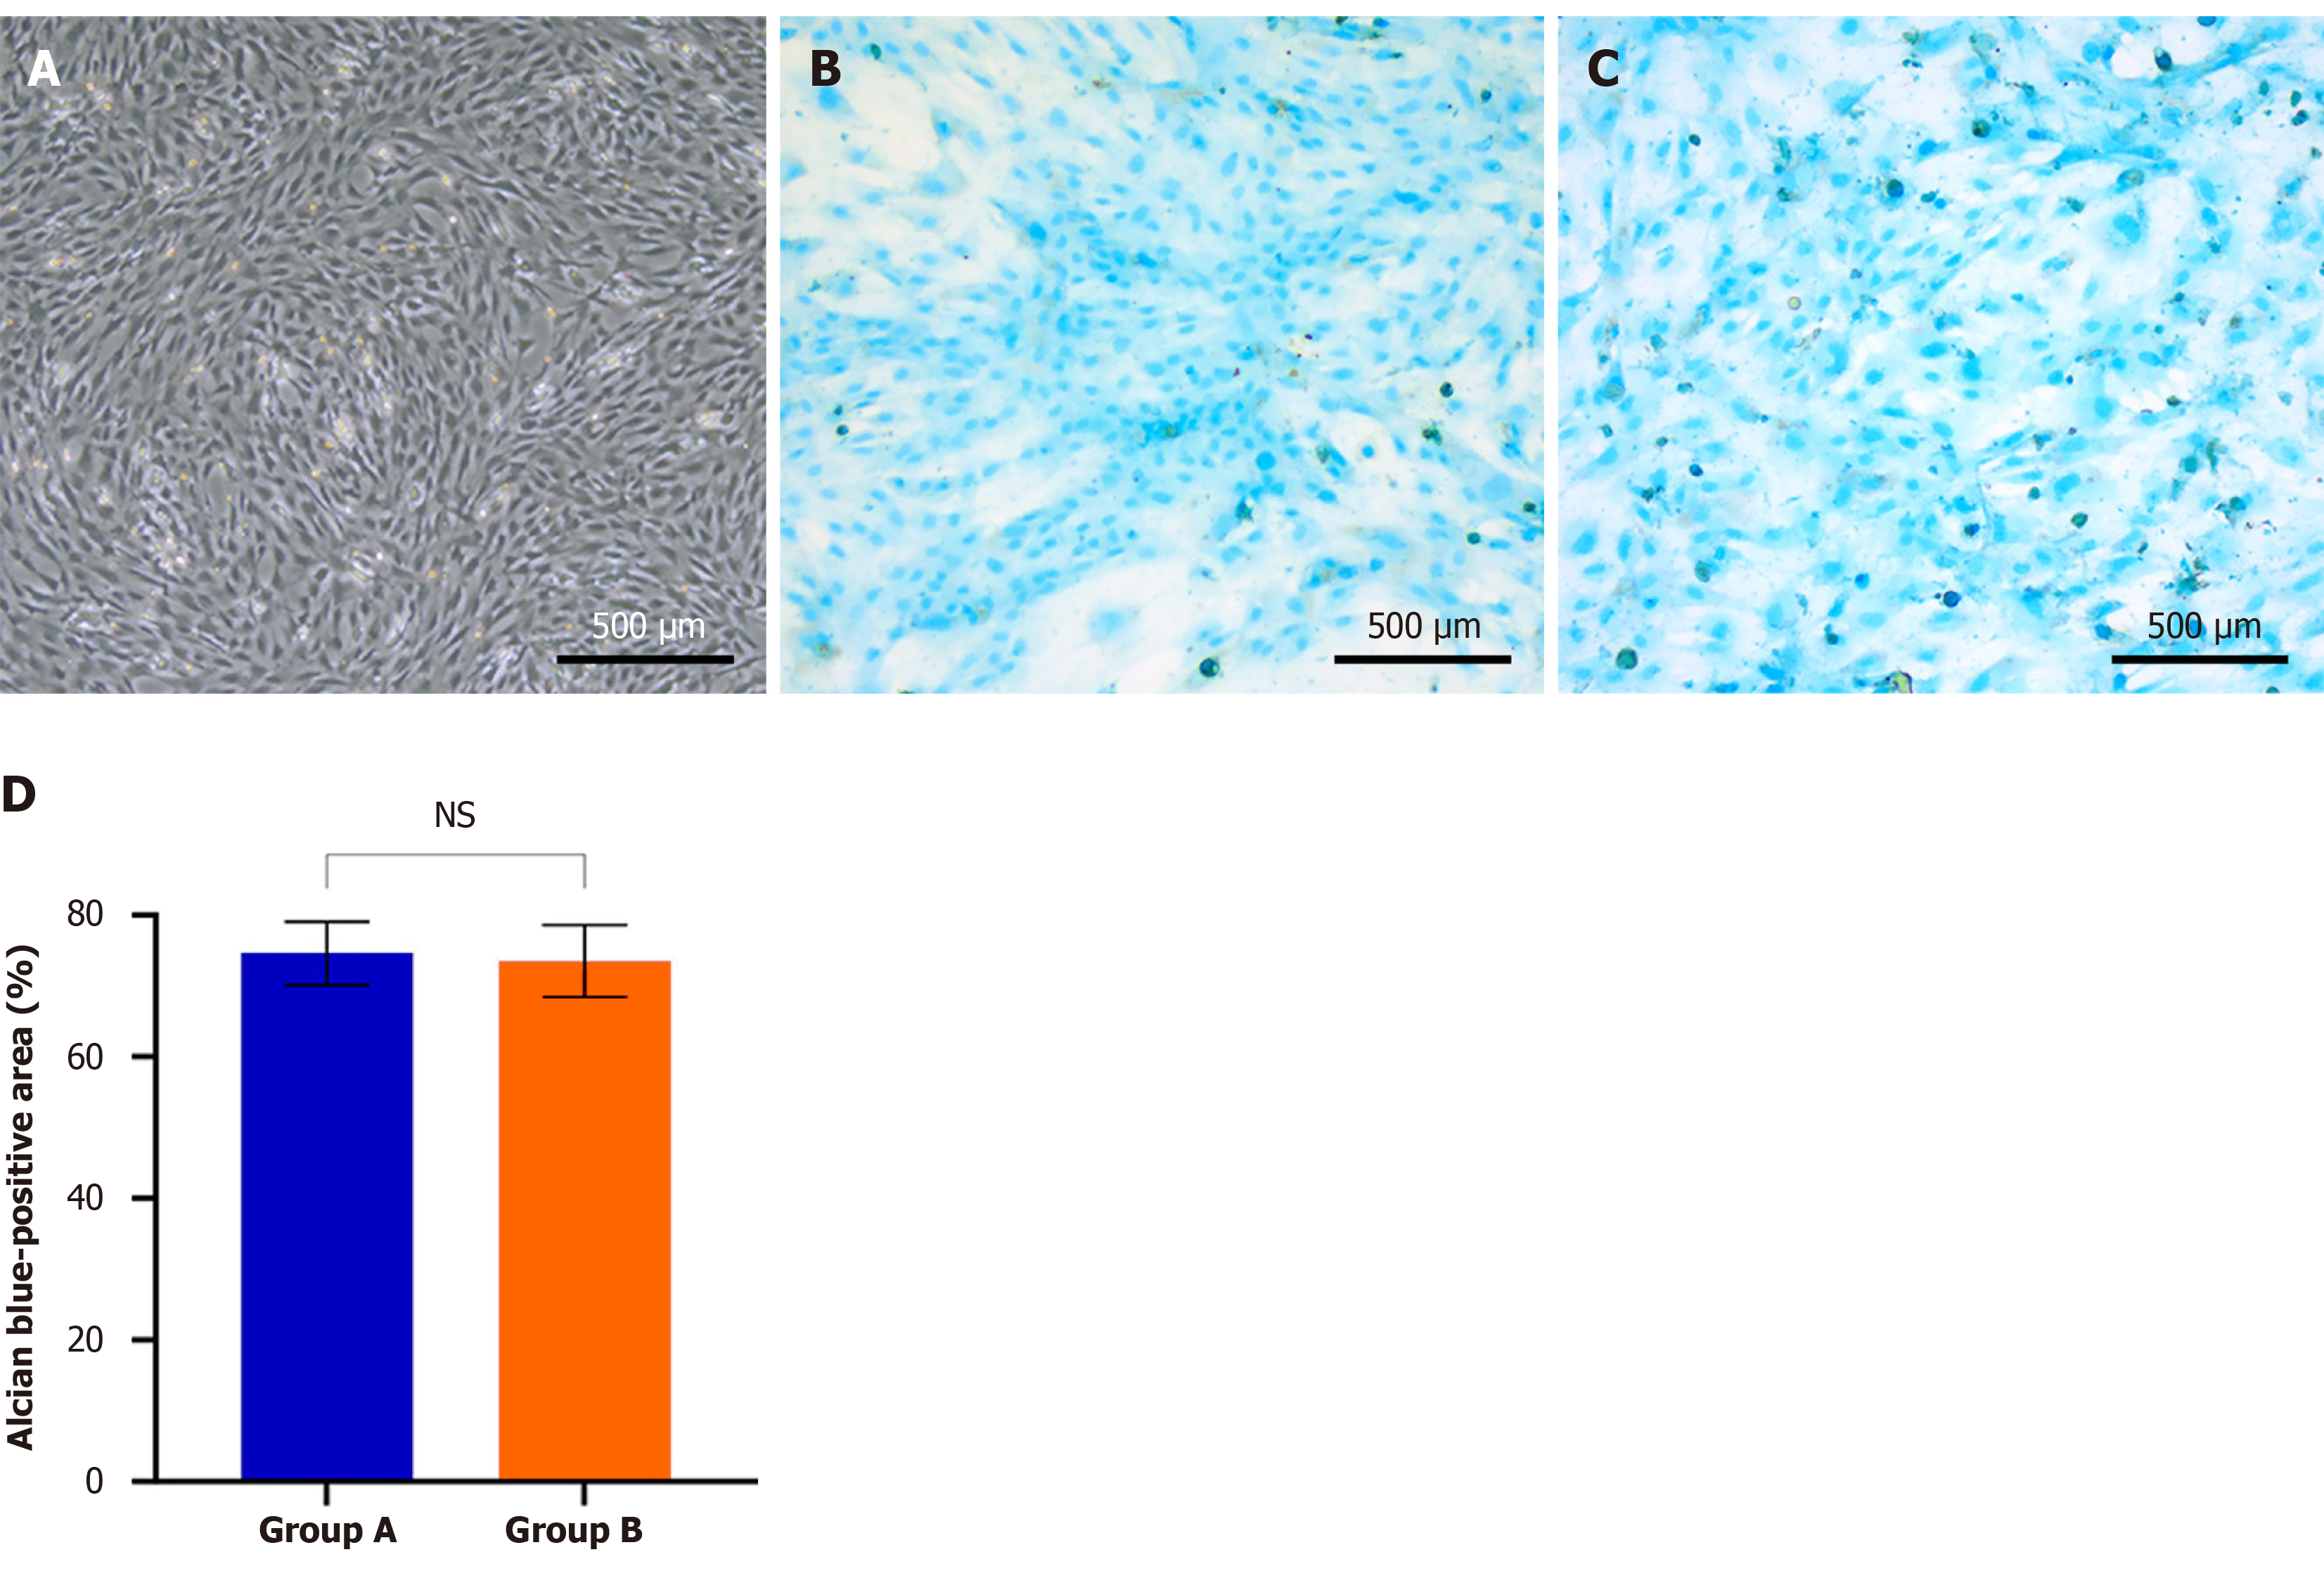
Figure 9 Chondrogenic differentiation of passage 4 cells isolated by the two methods.
A: Control (non-induced), scale bar: 500 μm; B: Group A (conventional adherence), scale bar: 500 μm; C: Group B (density gradient centrifugation), scale bar: 500 μm; D: Quantitative analysis of Alcian blue-positive area. Data are expressed as mean ± SD (n = 3). NS: Not significant.
- Citation: Lai SY, Jiang Y, Yuan R, Wang Z, Wang YC, Zhao ZT, Cai CY, Ruan MY, Zeng YX, Ren B, Wang XF. Density gradient centrifugation vs adherence for rat intestinal mesenchymal stem cell isolation. World J Stem Cells 2026; 18(9): 124197
- URL: https://www.wjgnet.com/1948-0210/full/v18/i9/124197.htm
- DOI: https://dx.doi.org/10.4252/wjsc.124197