
















Copyright: ©Author(s) 2026.
World J Stem Cells. Sep 26, 2026; 18(9): 124197
Published online Sep 26, 2026. doi: 10.4252/wjsc.124197
Published online Sep 26, 2026. doi: 10.4252/wjsc.124197
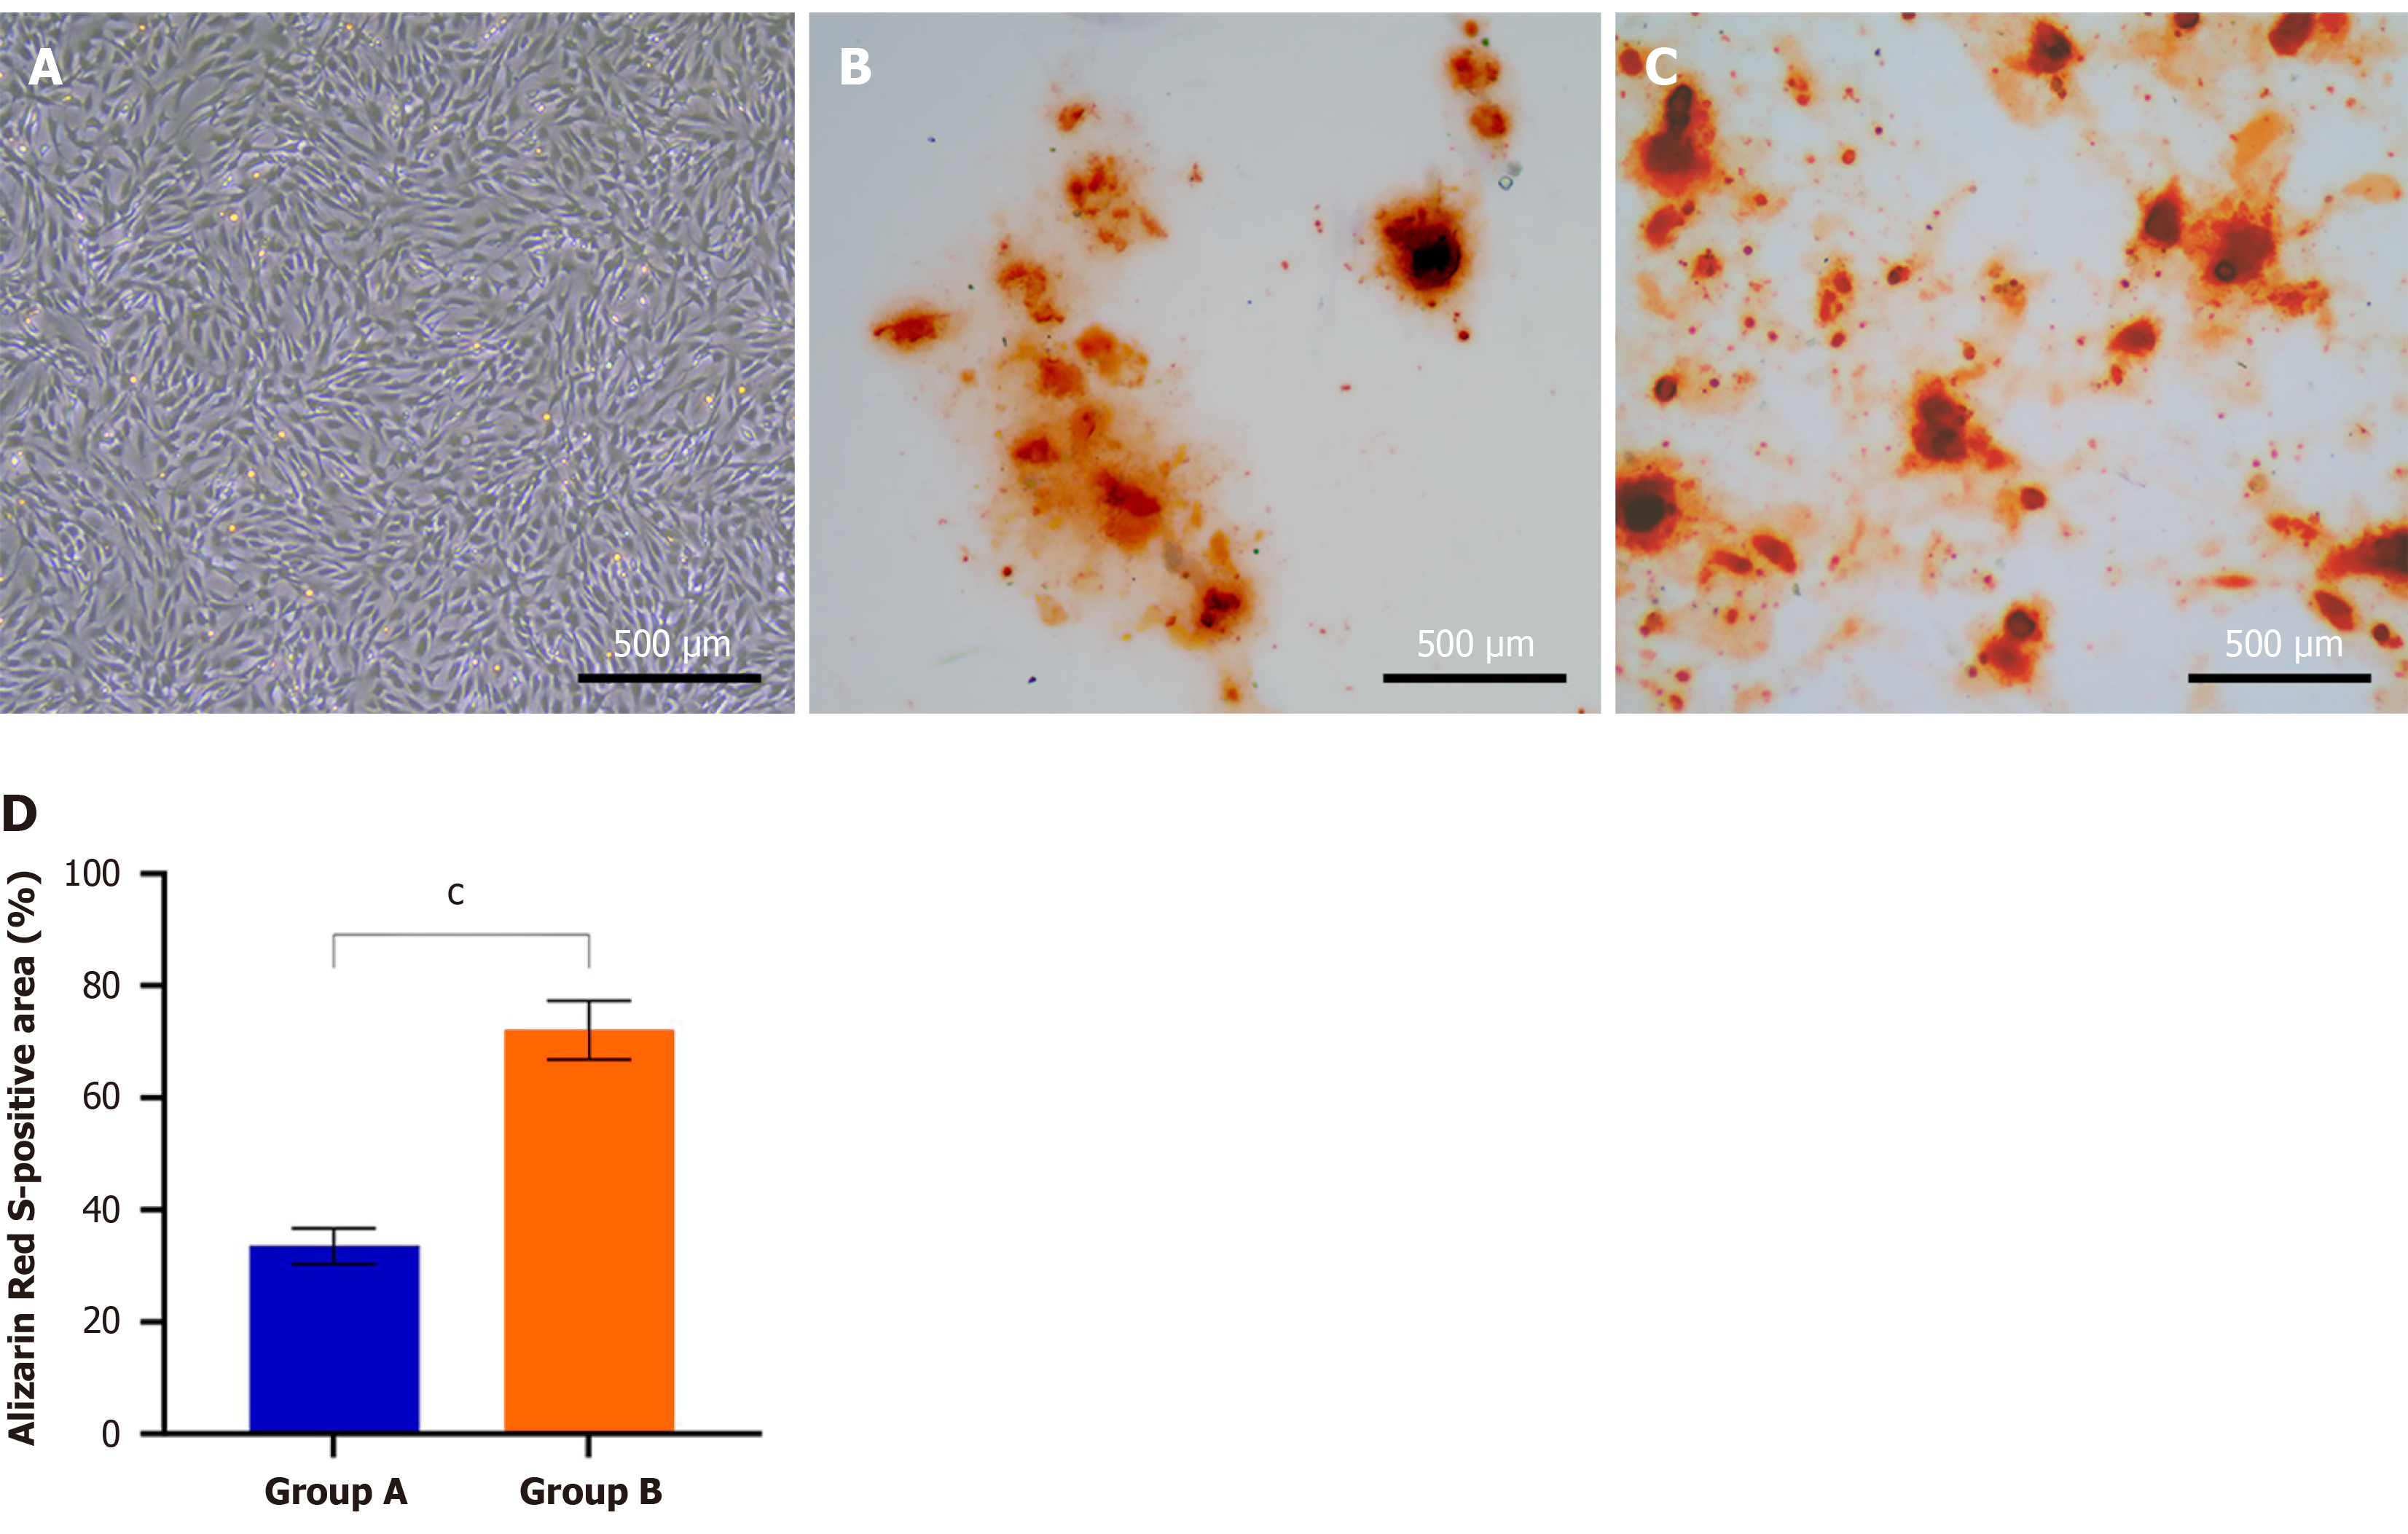
Figure 7 Osteogenic differentiation of passage 4 cells isolated by the two methods.
A: Control (non-induced), scale bar: 500 μm; B: Group A (conventional adherence), scale bar: 500 μm; C: Group B (density gradient centrifugation), scale bar: 500 μm; D: Quantitative analysis of Alizarin Red S-positive area. Data are expressed as mean ± SD (n = 3). cP < 0.001 vs group A.
- Citation: Lai SY, Jiang Y, Yuan R, Wang Z, Wang YC, Zhao ZT, Cai CY, Ruan MY, Zeng YX, Ren B, Wang XF. Density gradient centrifugation vs adherence for rat intestinal mesenchymal stem cell isolation. World J Stem Cells 2026; 18(9): 124197
- URL: https://www.wjgnet.com/1948-0210/full/v18/i9/124197.htm
- DOI: https://dx.doi.org/10.4252/wjsc.124197