Published online Dec 14, 2018. doi: 10.3748/wjg.v24.i46.5259
Peer-review started: September 17, 2018
First decision: October 14, 2018
Revised: October 18, 2018
Accepted: November 9, 2018
Article in press: November 9, 2018
Published online: December 14, 2018
Processing time: 88 Days and 0 Hours
To identify and predict the competing endogenous RNA (ceRNA) networks in colorectal cancer (CRC) by bioinformatics analysis.
In the present study, we obtained CRC tissue and normal tissue gene expression profiles from The Cancer Genome Atlas project. Differentially expressed (DE) genes (DEGs) were identified. Then, upregulated and downregulated miRNA-centered ceRNA networks were constructed by analyzing the DEGs using multiple bioinformatics approaches. DEmRNAs in the ceRNA networks were identified in Kyoto Encyclopedia of Genes and Genomes (KEGG) pathways using KEGG Orthology Based Annotation System 3.0. The interactions between proteins were analyzed using the STRING database. Kaplan-Meier survival analysis was conducted for DEGs and real time quantitative polymerase chain reaction (RT-qPCR) was also performed to validate the prognosis-associated lncRNAs in CRC cell lines.
Eighty-one DElncRNAs, 20 DEmiRNAs, and 54 DEmRNAs were identified to construct the ceRNA networks of CRC. The KEGG pathway analysis indicated that nine out of top ten pathways were related with cancer and the most significant pathway was “colorectal cancer”. Kaplan-Meier survival analysis showed that the overall survival was positively associated with five DEGs (IGF2-AS, POU6F2-AS2, hsa-miR-32, hsa-miR-141, and SERPINE1) and it was negatively related to three DEGs (LINC00488, hsa-miR-375, and PHLPP2). Based on the STRING protein database, it was found that SERPINE1 and PHLPP2 interact with AKT1. Besides, SERPINE1 can interact with VEGFA, VTN, TGFB1, PLAU, PLAUR, PLG, and PLAT. PHLPP2 can interact with AKT2 and AKT3. RT-qPCR revealed that the expression of IGF2-AS, POU6F2-AS2, and LINC00488 in CRC cell lines was consistent with the in silico results.
CeRNA networks play an important role in CRC. Multiple DEGs are related with clinical prognosis, suggesting that they may be potential targets in tumor diagnosis and treatment.
Core tip: We acquired high-throughput data from The Cancer Genome Atlas database and constructed the competing endogenous RNA (ceRNA) networks of colorectal cancer by bioinformatics analysis, which included 81 differentially expressed (DE)lncRNAs, 20 DEmiRNAs, and 54 DEmRNAs. Furthermore, 3 lncRNAs, 3 miRNAs, and 2 mRNAs were found associated with overall survival. Our study revealed that ceRNA networks are important in colorectal cancer and the prognosis-related genes worth exploring further.
- Citation: Liang Y, Zhang C, Ma MH, Dai DQ. Identification and prediction of novel non-coding and coding RNA-associated competing endogenous RNA networks in colorectal cancer. World J Gastroenterol 2018; 24(46): 5259-5270
- URL: https://www.wjgnet.com/1007-9327/full/v24/i46/5259.htm
- DOI: https://dx.doi.org/10.3748/wjg.v24.i46.5259
Colorectal cancer (CRC) is one of the most common digestive malignancies in the world[1]. With the development of new technology in CRC diagnosis and treatment, the prognosis of patients with early detection has been improved. However, the overall 5-year survival rate in advanced cases remains poor[2]. In the United States, CRC was the fourth most common malignant tumor, with 135430 new cases and 50260 deaths in 2017[3]. Therefore, specific CRC biomarkers and therapeutic pathways are in great need to improve the prognosis for patients.
Non-coding RNAs, including microRNAs (miRNAs) and long-noncoding RNAs (lncRNAs), can regulate oncogene and tumor suppressor gene expression in multiple ways[4,5]. MiRNAs are 20-22 nucleotides long and regulate genes post-transcriptionally by directly binding mRNAs[6]. LncRNAs are defined as transcripts that range from 200 nucleotides to multiple kilobases in length[7]. Recent research has focused on these lncRNAs, which function as competing endogenous RNAs (ceRNAs) to regulate gene expression by sponging miRNAs through shared miRNA response elements[8].
In the last few years, with the development of gene-sequencing technology, dysregulation of lncRNAs has been revealed in diverse malignancies. Studies have utilized bioinformatics tools to predict the target genes of novel lncRNAs, and molecular biology techniques including real time quantitative polymerase chain reaction (RT-qPCR), silencing technique, and luciferase reporter gene assays, among others, to validate in silico predictions. In CRC, the lncRNA UICLM acts as a ceRNA for hsa-miR-215 to upregulate ZEB2 expression and promote CRC progression[9]. Additionally, the lncRNA HNF1A-AS1 functions as an oncogene in the metastasis of CRC by modulating the hsa-miR-34/p53 axis[10]. Finally, the lncRNA CASC2 plays a role as a tumor suppressor gene by sponging hsa-miR-18a[11].
The lncRNA/miRNA/mRNA axis is regarded as an important mechanism in tumor progression and metastasis[12]. However, studies of ceRNA networks of novel coding and noncoding RNAs in CRC in large cohorts have not been performed. In our study, we obtained malignant and normal tissue expression profiles from The Cancer Genome Atlas (TCGA, http://cancergenome.nih.gov) project[13]. CeRNA networks were constructed including differentially expressed mRNAs (DEmRNAs), differentially expressed lncRNAs (DElncRNAs), and differentially expressed miRNAs (DEmiRNAs), which were based on the miRcode (http://www.mircode.org/)[14], miRTarBas (http://mirtarbase.mbc.nctu.edu.tw/php/)[15], TargetScan (http://www.targetscan.org/), and miRDB (http://www.mirdb.org/) databases[16]. Kaplan-Meier survival curve analysis was performed to identify differentially expressed genes (DEGs) that are associated with overall survival.
We downloaded CRC transcriptome profiles from TCGA through the Genomic Data Commons (GDC) Data Transfer Tool 1.3.0[13]. The public data included the tissue expression profiles (derived by RNA-seq) of 644 CRC tissues and 51 normal tissues (level 3) and 619 CRC and 11 normal tissue expression profiles (level 3) derived by miRNA-seq. According to the publication guidelines (2015) provided by TCGA (https://cancergenome.nih.gov/publications/publicationguidelines), our study does not require the approval of an ethics committee.
We analyzed the RNA-seq data by merging it to an RNA matrix with PERL software. Then, we converted the gene ID to gene name according to Ensembl (Homo sapiens) (http://asia.ensembl.org/index.html). The miRNA-seq data were analyzed using the same method. DEmRNAs, DElncRNAs, and DEmiRNAs were identified with the edgeR package in R with a threshold log2 fold change (FC) > 2.0 and P < 0.01. Heat maps of DEGs were constructed using the gplots package in R.
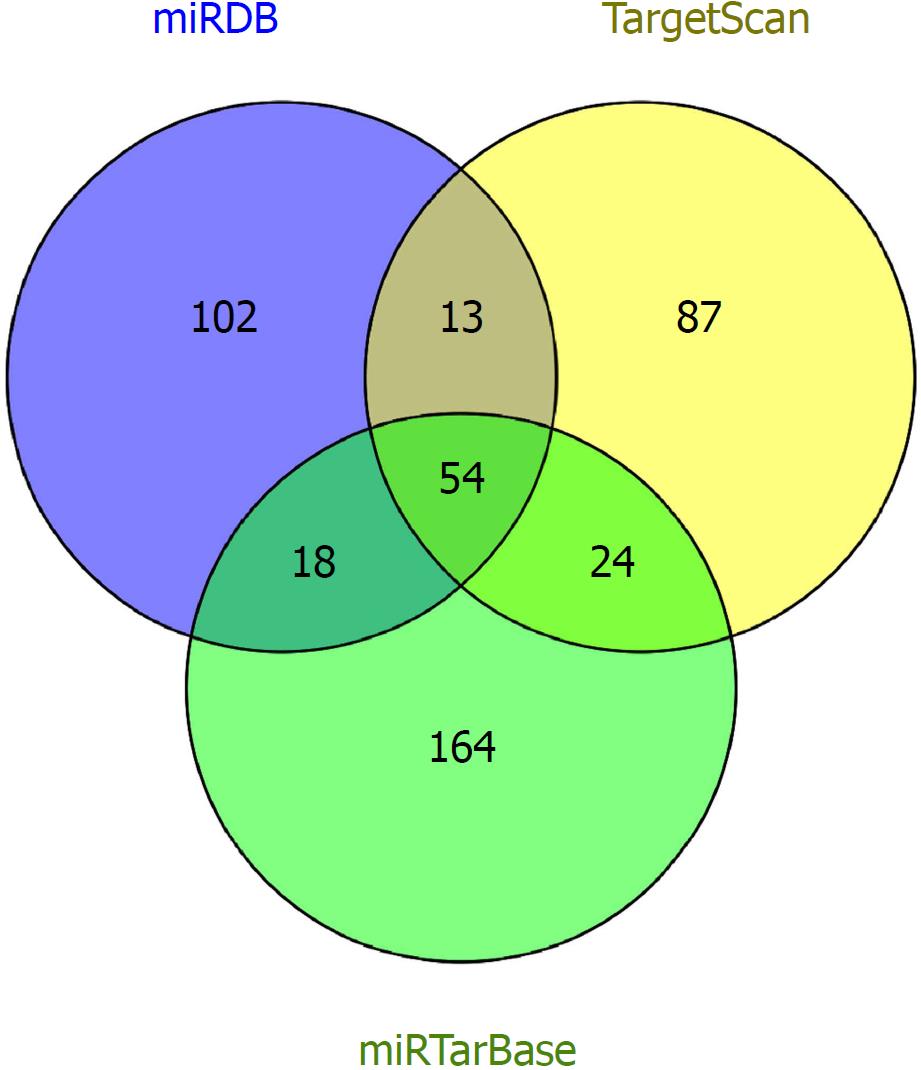
Next, we constructed ceRNA networks that were mapped by identifying DEGs to an established co-expression database (miRcode, miRTarBase, TargetScan, and miRDB). LncRNA-miRNA-mRNA reactions were split into lncRNA-miRNA and miRNA-mRNA interactions. LncRNA-miRNA interactions were predicted by comparing DElncRNAs and DEmiRNAs to the miRcode database. DEmRNAs regulating genes of DEmiRNAs were identified by intersecting the predicted results between miRTarBase, TargetScan, and the miRDB databases. According to the ceRNA hypothesis[12], miRNAs negatively regulate mRNA expression and lncRNAs act as ceRNAs to limit miRNA function by sponging them. The networks were visualized and mapped using Cytoscape v3.5.1[17].
To explore the function of the DEGs in the ceRNA networks in tumorigenesis and metastasis, KEGG pathways[18] were analyzed using KOBAS (http://kobas.cbi.pku.edu.cn/), which is a web server that annotates an input set of genes with pathways based on human disease databases[19]. Then, we utilized STRING protein database v10.5 (http://string-db.org/) to analyze the protein-protein interactions of the DEGs.
We selected CRC adenocarcinoma and adjacent normal tissue expression data and clinical information from TCGA project. None of the patients received preoperative treatment. Kaplan-Meier survival analysis and the log-rank test were performed for DEGs in the ceRNA networks. P < 0.05 was regarded as statistically significant.
The CRC cell lines HT29, LoVo, and SW480, along with the normal intestinal epithelial cell line NCM460, were purchased from the Institute of Biochemistry and Cell Biology at the Chinese Academy of Sciences, Shanghai, China. The cell lines were cultured in RPMI 1640 medium (HyClone, Logan, UT, United States) supplemented with 10% fetal bovine serum (Gibco, Grand Island, NY, United States), 100 U/mL penicillin, and 100 μg/mL streptomycin. All cells were maintained in an incubator with a humidified atmosphere of 95% air and 5% CO2 at 37 °C.
Total RNA was isolated from the cells using Trizol reagent (Invitrogen, Carlsbad, CA, United States). The quality and concentration of isolated RNA were detected with a NanoDrop 2000 spectrophotometer. Total RNA (800 ng) was converted to cDNA by using the PrimeScript TM RT reagent Kit (Takara, Otsu, Shiga, Japan). The Kit contained gDNA Eraser which could remove genomic DNA. We utilized LightCycler96 (Roche Diagnostic, Basel, Switzerland) to perform RT-qPCR using SYBR Green (Takara). The two-step amplification reaction was as follows: 95 °C for 30 s for preincubation, then 45 cycles of 95 °C for 10 s and 60 °C for 30 s. GAPDH expression was used as an endogenous control. Quantitative analysis was calculated using the 2-ΔΔCt method[20]. Primers were designed as follows: POU6F2-AS2 forward, 5’-ACAGCAGTGCCAGAAGGAGTATTG-3’ and reverse, 5’-GCAGACCTGAGCTTGTGAGTGAC-3’; LINC00488 forward, 5’-GAGCAGCAAGAATGAGAGCAGAGG-3’ and reverse, 5’-GAATCTGAGGAAGCACCGTGAACC-3’; IGF2-AS forward, 5’-TCCACACCAGACAGCACAGACC-3’ and reverse, 5’-TCCGTGGTTGGCTCCAGGTG-3’; GAPDH forward, 5’-AGCCACATCGCTCAGACAC-3’ and reverse, 5’-GCCCAATACGACCAAATCC-3’.
All data were analyzed using SPSS 20.0 (Chicago, IL, United States). Student’s t-test was performed for CRC cell lines and normal intestinal epithelial cell line comparisons. Differences with P < 0.05 were regarded as statistically significant. All experiments were repeated three times.
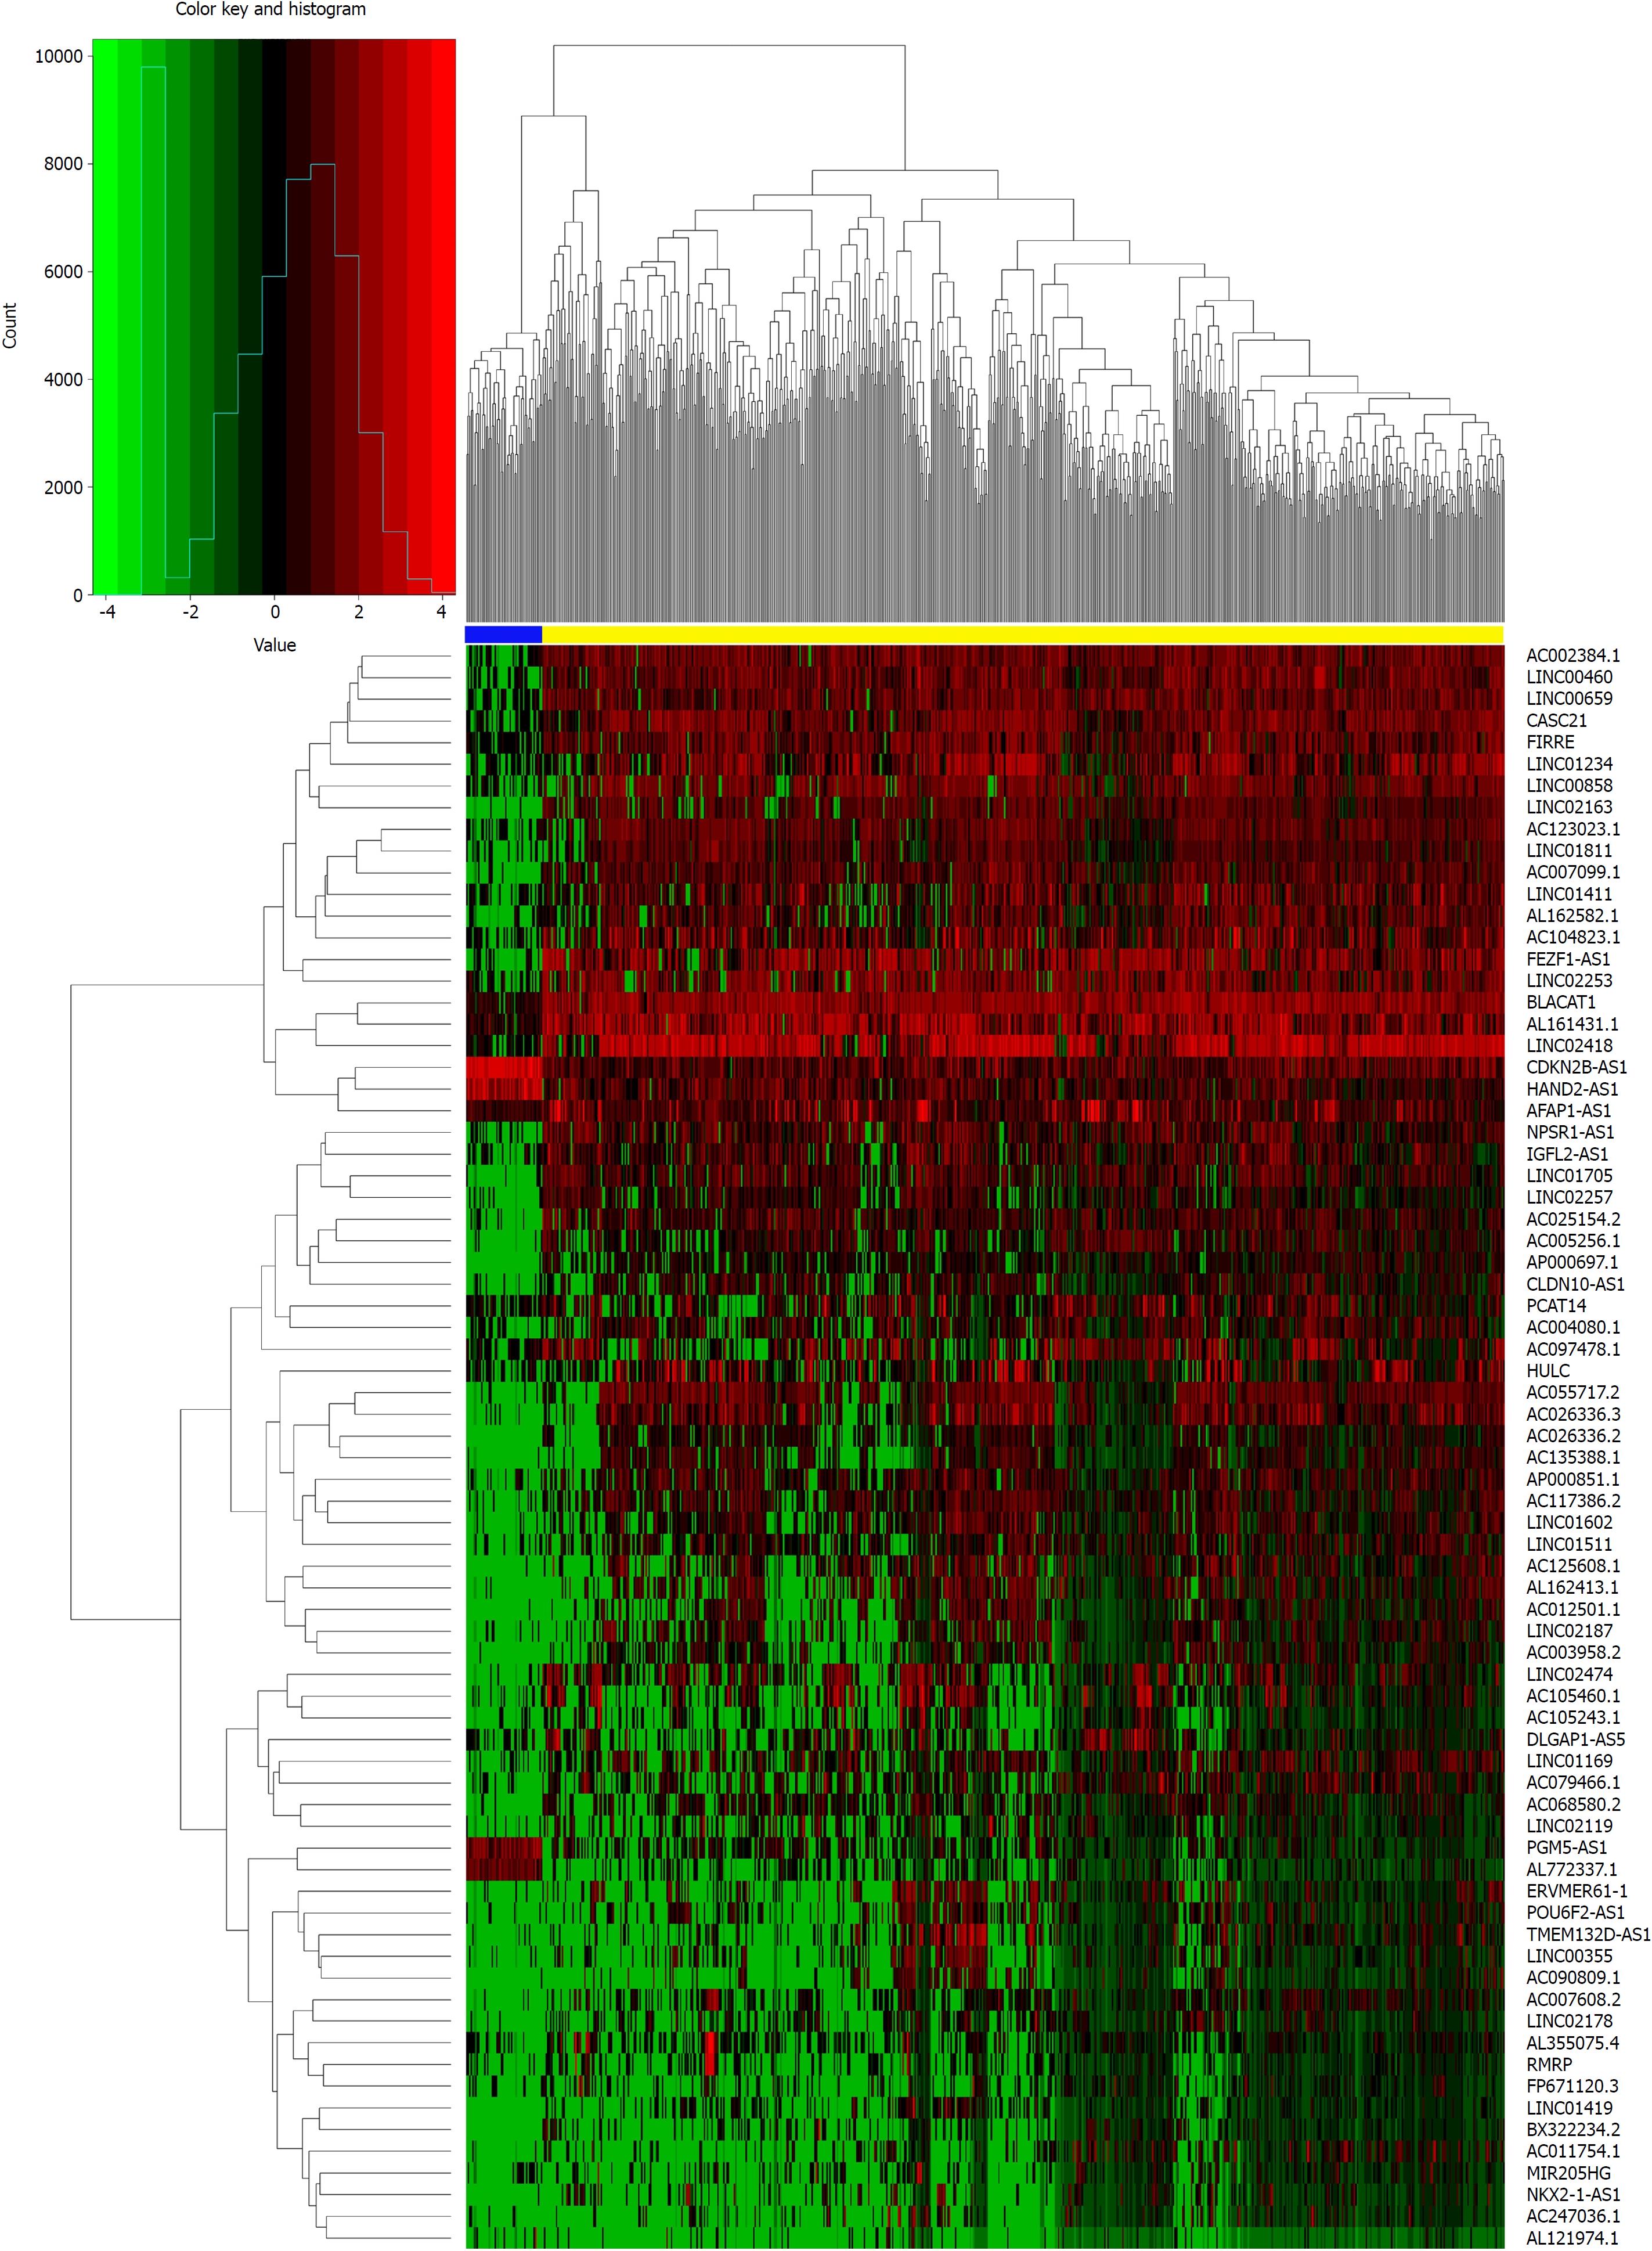
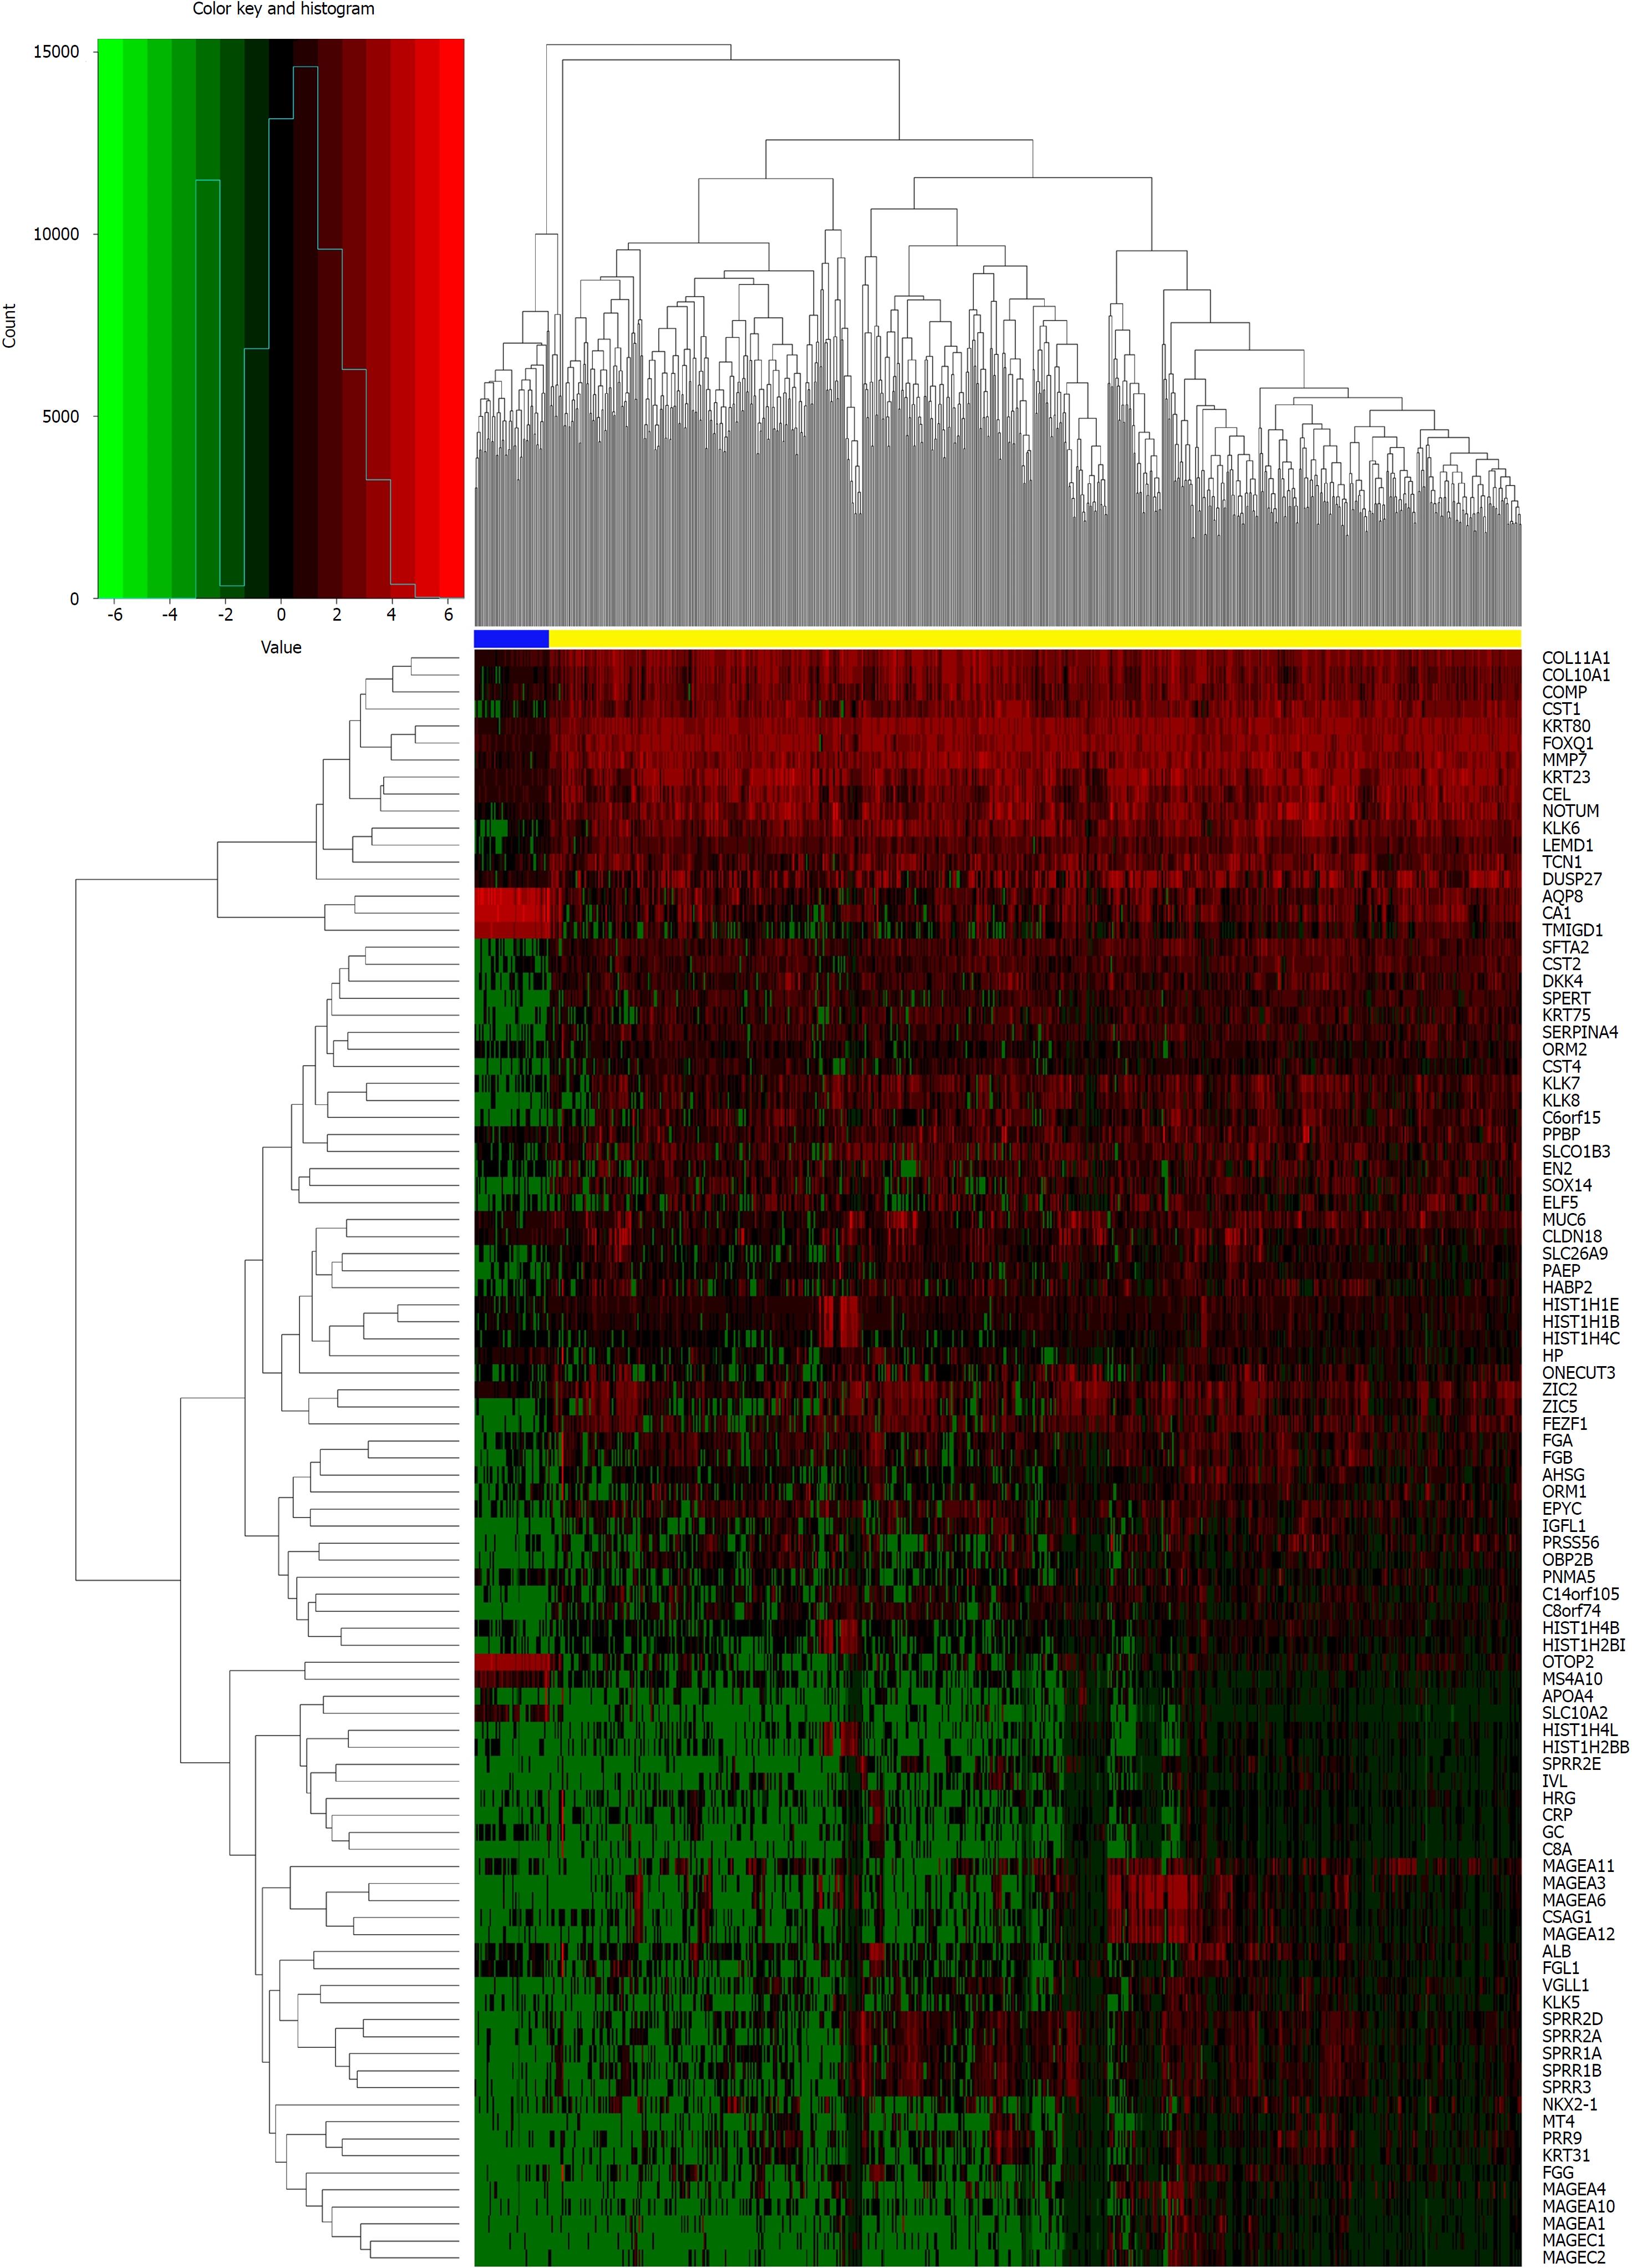
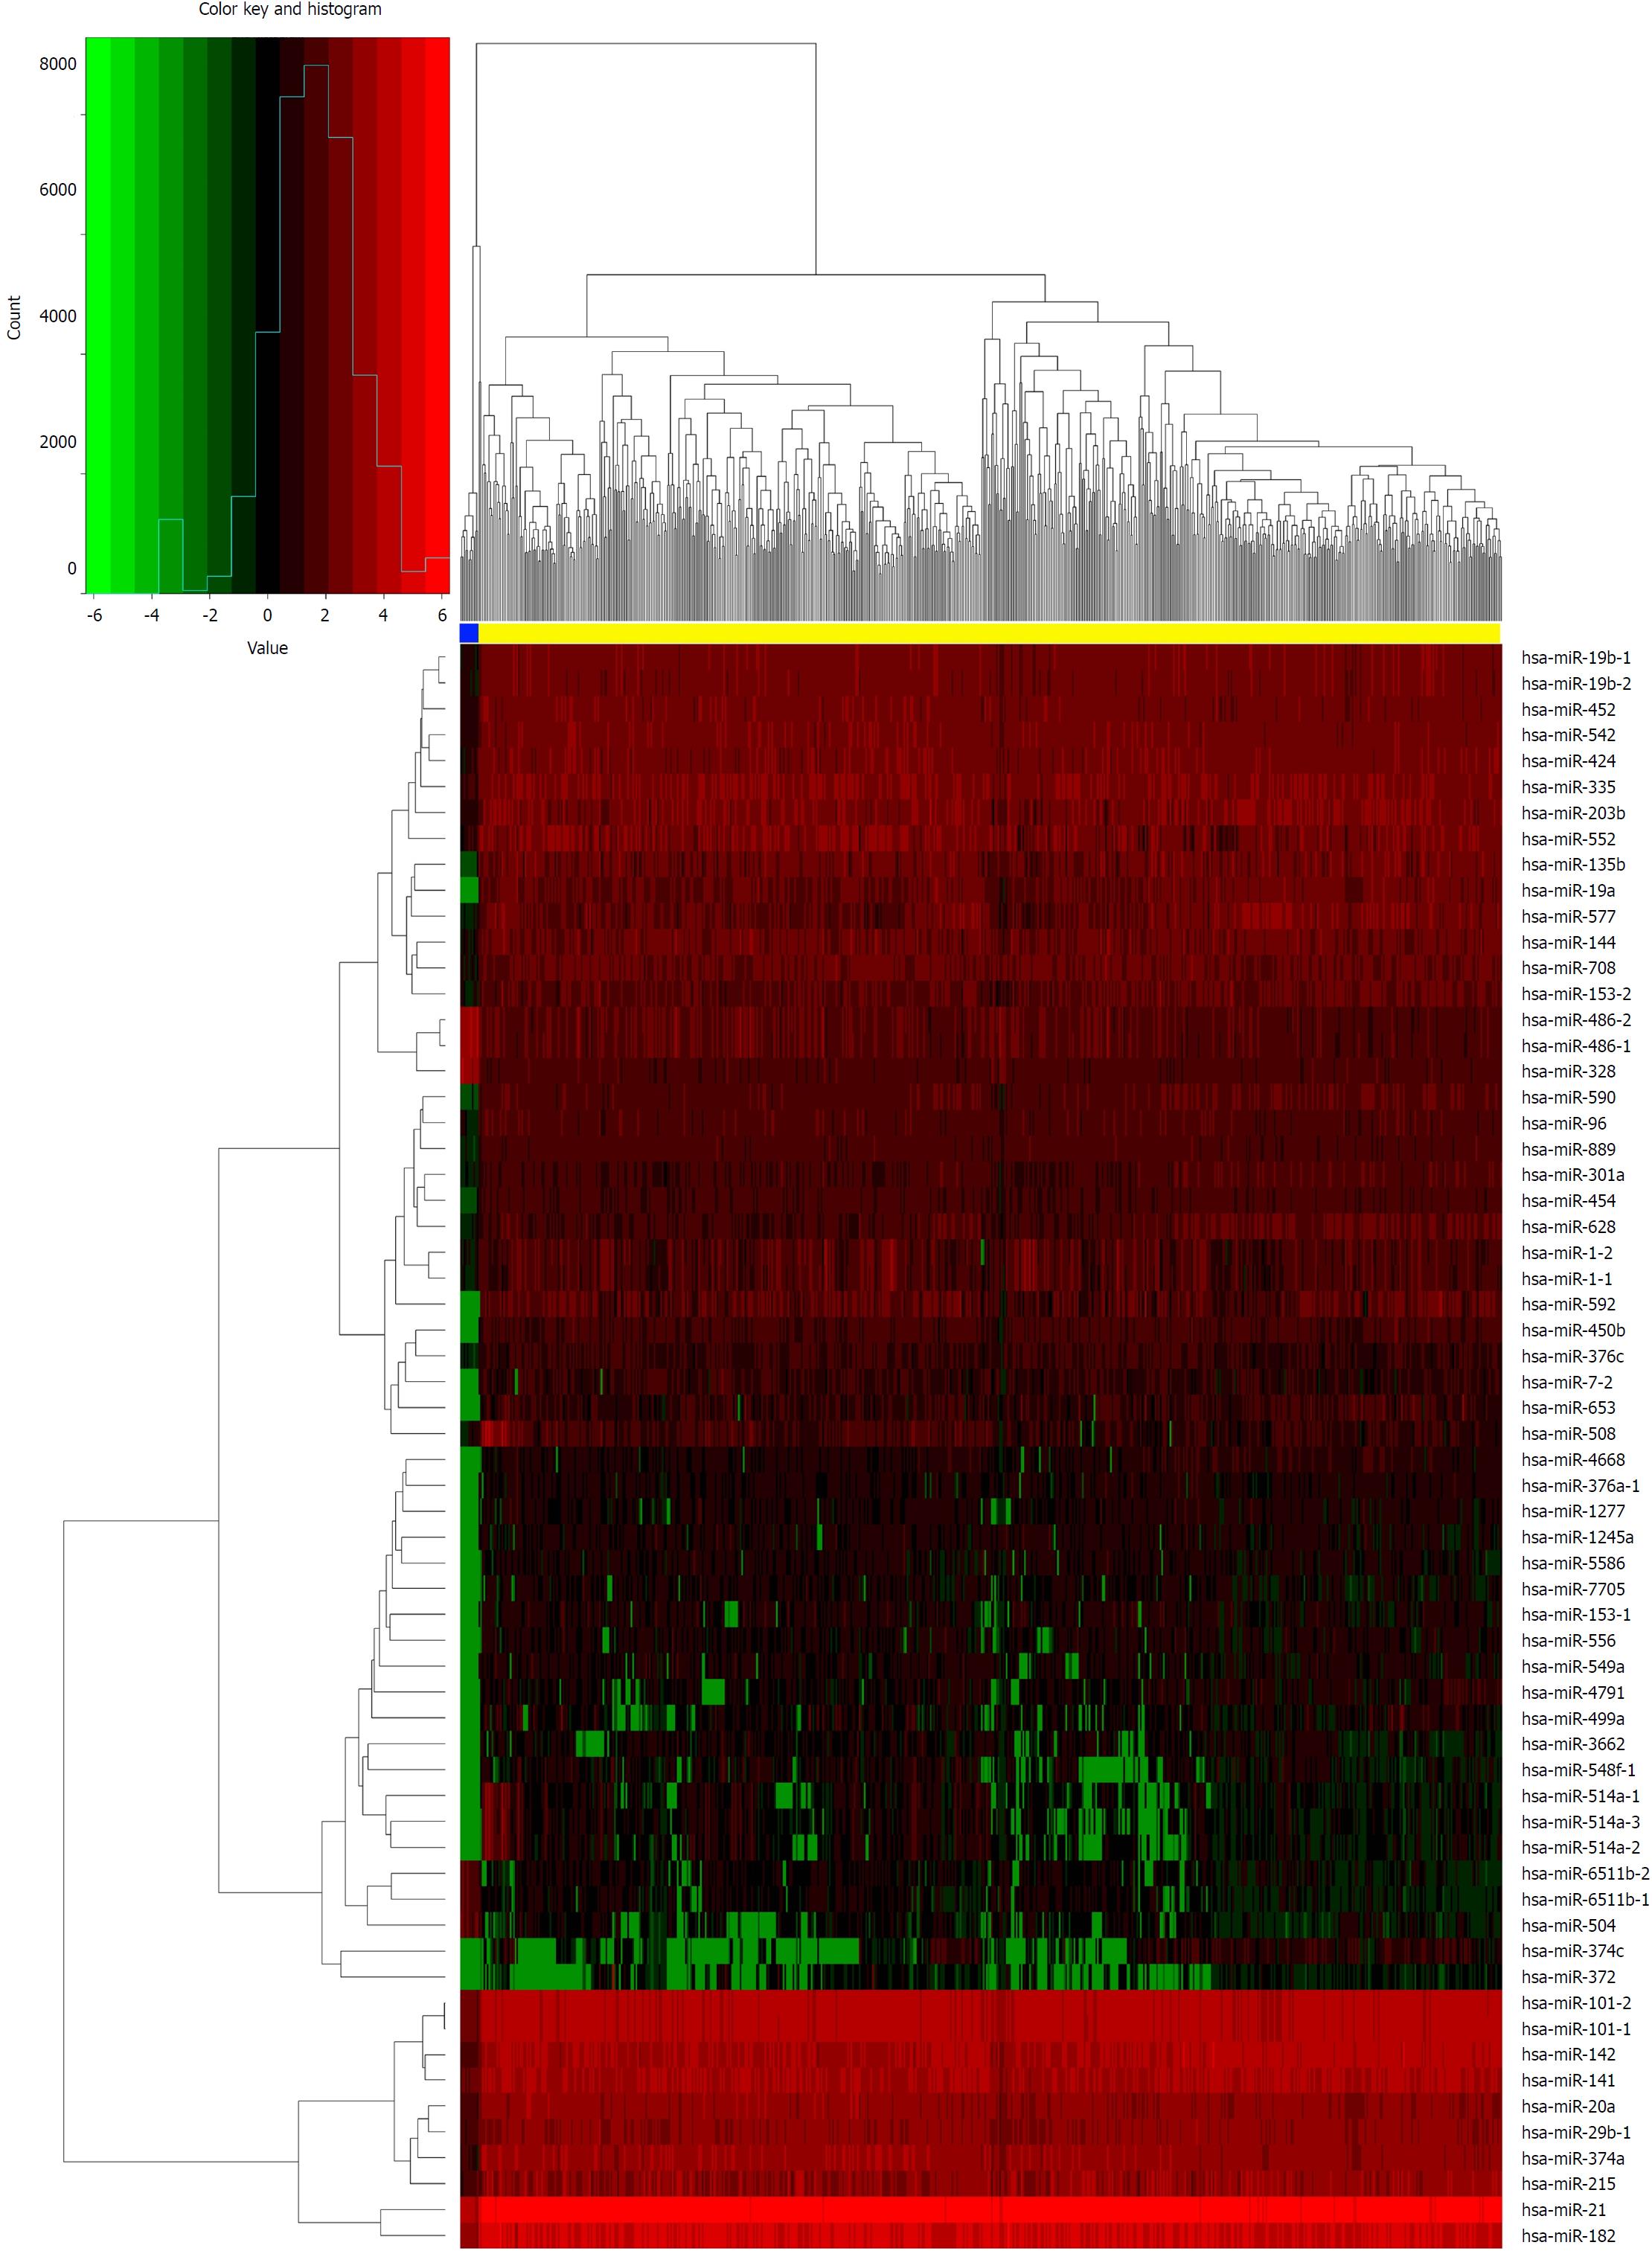
We identified DElncRNAs and DEmRNAs between 644 CRC and 51 normal tissue expression profiles from TCGA. As a result, we identified 1043 DElncRNAs, 2146 DEmRNAs, and 276 DEmiRNAs using the edgeR package in R. There were 768 up-regulated and 275 down-regulated DEGs among the DElncRNAs, and 1198 up-regulated and 948 down-regulated DEGs in the DEmRNAs. Using the same method, 180 up-regulated and 96 down-regulated DEmiRNAs were obtained by comparing 619 CRC and 11 normal tissue expression profiles. Moreover, we constructed heat maps of the top DEGs (log2 FC > 5, P < 0.01) in each category using R (Figures 1-3).
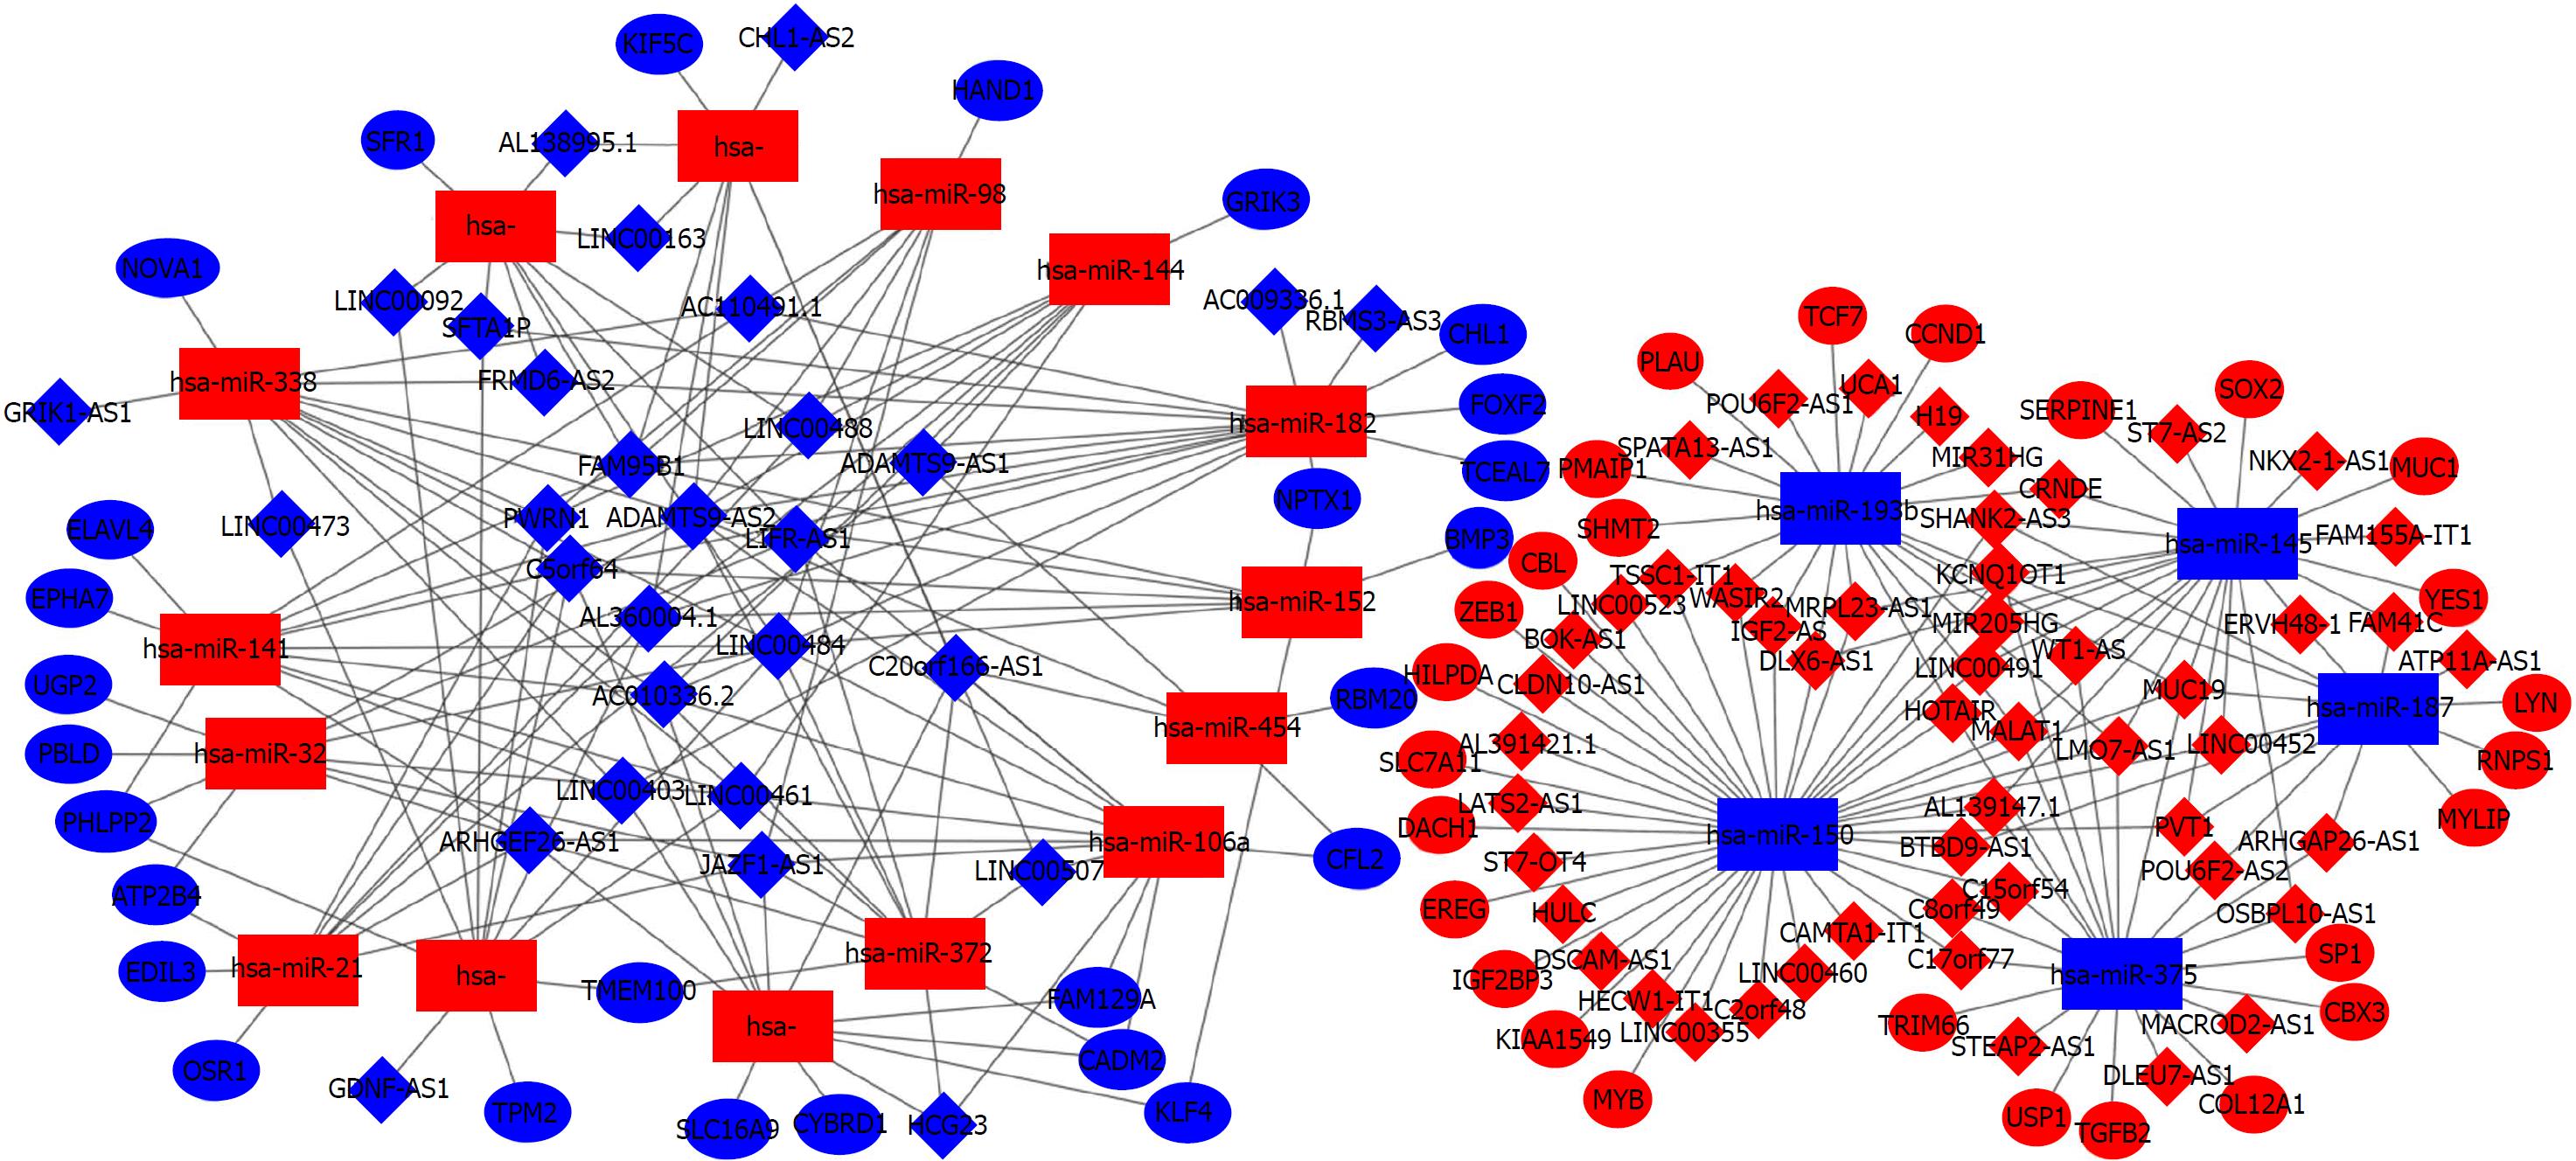
To construct the ceRNA networks, we predicted the interactions among DEGs using online bioinformatics tools. We utilized miRcode to predict the interactions between DElncRNAs and DEmiRNAs and we also predicted DEmRNAs targeted by the DEmiRNAs by intersecting the predictions of miRTarBase, TargetScan, and miRDB (Figure 4). Ultimately, 81 DElncRNAs, 20 DEmiRNAs, and 54 DEmRNAs were identified to construct the ceRNA networks of CRC using Cytoscape (Figure 5). The interactions among DEGs are shown in Tables 1 and 2.
| DEmiRNAs | DElncRNAs | DEmiRNAs | DElncRNAs |
| Hsa-miR-193b | IGF2-AS, H19, MIR31HG, WT1-AS, MUC19, UCA1, POU6F2-AS1, TSSC1-IT1, MRPL23-AS1, SPATA13-AS1, HOTAIR, WASIR2, DLX6-AS1, CRNDE, MALAT1, KCNQ1OT1 | Hsa-miR-182 | AC009336.1, C5orf64, AL360004.1, AC010336.2, SFTA1P, LINC00402, RBMS3-AS3, ADAMTS9-AS2, LIFR-AS1, FRMD6-AS2 |
| Hsa-miR-145 | SHANK2-AS3, WT1-AS, MUC19, ST7-AS2, MRPL23-AS1, FAM155A-IT1, FAM41C, MIR205HG, DLX6-AS1, OSBPL10-AS1, ERVH48-1, CRNDE, PVT1, LINC00491, MALAT1, NKX2-1-AS1, KCNQ1OT1, AL139147.1, ITCH-IT1, LINC00452 | Hsa-miR-106a | C20orf166-AS1, AC010336.2, HCG23, JAZF1-AS1, LINC00484, ADAMTS9-AS2, ARHGEF26-AS1, LIFR-AS1, LINC00461, LINC00507 |
| Hsa-miR-187 | SHANK2-AS3, MUC19, BTBD9-AS1, LINC00452, FAM41C, ATP11A-AS1, ERVH48-1, POU6F2-AS2, ARHGEF26-AS1, PVT1 | Hsa-miR-152 | C5orf64, AL360004.1, FAM95B1, LINC00484, ADAMTS9-AS2 |
| Hsa-miR-150 | IGF2-AS, C2orf48, SHANK2-AS3, C15orf54, HECW1-IT1, LINC00523, MUC19, ST7-OT4, CLDN10-AS1, TSSC1-IT1, MRPL23-AS1, BTBD9-AS1, LINC00355, LMO7-AS1, HOTAIR, MIR205HG, WASIR2, DLX6-AS1, LINC00460, LATS2-AS1, BOK-AS1, DSCAM-AS1, CAMTA1-IT1, PVT1, LINC00491, HULC, MALAT1, C8orf49, KCNQ1OT1, AL139147.1, AL391421.1 | Hsa-miR-338 | GRIK1-AS1, C5orf64, AC010336.2, LINC00473, FAM95B1, AC110491.1, LINC00402, LINC00484, ADAMTS9-AS2, LINC00461, FRMD6-AS2, PWRN1 |
| Hsa-miR-375 | C15orf54, C17orf77, WT1-AS, MUC19, STEAP2-AS1, LMO7-AS1, HOTAIR, OSBPL10-AS1, POU6F2-AS2, MACROD2-AS1, DLEU7-AS1, MALAT1, C8orf49, KCNQ1OT1, AL139147.1 | Hsa-miR-17 | C20orf166-AS1, C5orf64, AC010336.2, HCG23, JAZF1-AS1, LINC00402, ARHGEF26-AS1 |
| Hsa-miR-183 | C20orf166-AS1, AL360004.1, FAM95B1, CHL1-AS2, ADAMTS9-AS2, LINC00507 | Hsa-miR-424 | C5orf64, AL360004.1, LINC00473, LINC00092, SFTA1P, LINC00484, LINC00461, PWRN1 |
| Hsa-miR-98 | LINC00488, FAM95B1, AC110491.1, JAZF1-AS1, LINC00484, ADAMTS9-AS2, PWRN1 | Hsa-miR-21 | C5orf64, AL360004.1, LINC00488, JAZF1-AS1, ADAMTS9-AS1, ARHGEF26-AS1, PWRN1 |
| Hsa-miR-144 | AL360004.1, AC010336.2, LINC00488, ADAMTS9-AS1, ADAMTS9-AS2, LIFR-AS1, LINC00461, PWRN1 | Hsa-miR-454 | C20orf166-AS1, ADAMTS9-AS1, ADAMTS9-AS2 |
| Hsa-miR-32 | JAZF1-AS1, LINC00484, ADAMTS9-AS2, ARHGEF26-AS1 | Hsa-miR-141 | C5orf64, AC010336.2, FAM95B1, AC110491.1, LINC00402, LINC00484, ADAMTS9-AS2, ARHGEF26-AS1, LINC00461 |
| Hsa-miR-206 | LINC00488, FAM95B1, LINC00092, SFTA1P, LINC00163, LINC00484, AL138995.1, LIFR-AS1, FRMD6-AS2 | Hsa-miR-372 | C20orf166-AS1, AC010336.2, HCG23, JAZF1-AS1, LINC00484, ADAMTS9-AS2, ARHGEF26-AS1, LIFR-AS1, LINC00461 |
| DEmiRNAs | DEmRNAs |
| Hsa-miR-193b | PLAU, PMAIP1, TCF7, CCND1, SHMT2 |
| Hsa-miR-145 | SERPINE1, SOX2, MUC1, YES1 |
| Hsa-miR-187 | LYN, RNPS1, MYLIP |
| Hsa-miR-375 | TRIM66, USP1, TGFB2, COL12A1, CBX3, SP1 |
| Hsa-miR-150 | CBL, ZEB1, HILPDA, SLC7A11, DACH1, EREG, IGF2BP3, KIAA1549, MYB |
| Hsa-miR-183 | KIF5C |
| Hsa-miR-98 | HAND1 |
| Hsa-miR-144 | CRIK3 |
| Hsa-miR-182 | CHL1, FOXF2, TCEAL7, NPTX1 |
| Hsa-miR-152 | NPTX1, BMP3, KLF4 |
| Hsa-miR-454 | RBM20, CFL2 |
| Hsa-miR-106a | CFL2, FAM129A, CADM2 |
| Hsa-miR-372 | TMEM100, CADM2, |
| Hsa-miR-17 | SLC16A9, CYBRD1, KLF4, CADM2, FAM129A |
| Hsa-miR-424 | TPM2, TMEM100 |
| Hsa-miR-21 | ATP2B4, EDIL3, OSR1 |
| Hsa-miR-32 | UGP2, PBLD, PHLPP2, ATP2B4 |
| Hsa-miR-141 | ELAVL4, EPHA7, PHLPP2 |
| Hsa-miR-338 | NOVA1 |
| Hsa-miR-206 | SFRP1 |
To better reveal the function of ceRNA networks in CRC, we subjected the 54 DEmRNAs in the ceRNA networks to Kyoto Encyclopedia of Genes and Genomes (KEGG) pathway analysis using KEGG Orthology Based Annotation System (KOBAS) 3.0, and the top ten KEGG pathways are shown in Table 3. There were nine pathways related to cancer, including “Colorectal cancer”, “p53 signaling pathway”, “Chronic myeloid leukemia”, “Proteoglycans in cancer”, “miRNAs in cancer”, “Thyroid cancer”, “Transcriptional misregulation in cancer”, “Pathways in cancer”, and “Wnt signaling pathway”. These results indicate that ceRNA networks play important roles in the carcinogenesis and progression of CRC.
| Pathway ID | Description | P value | Gene name |
| hsa05210 | Colorectal cancer | 8.18E-05 | TCF7, CCND1, TGFB2 |
| hsa04115 | p53 signaling pathway | 1.11E-04 | SERPINE1, CCND1 |
| hsa05220 | Chronic myeloid leukemia | 1.30E-04 | CCND1, CBL, TGFB2 |
| hsa05205 | Proteoglycans in cancer | 1.52E-04 | CCND1, CBL, TGFB2, PLAU |
| hsa05206 | MicroRNAs in cancer | 6.20E-04 | ZEB1, CCND1, PLAU, TGFB2 |
| hsa05216 | Thyroid cancer | 7.31E-04 | TCF7, CCND1 |
| hsa04550 | Signaling pathways regulating pluripotency of stem cells | 8.67E-04 | SOX2, KLF4, HAND1 |
| hsa04310 | Wnt signaling pathway | 8.84E-04 | TCF7, CCND1, SFRP1 |
| hsa05202 | Transcriptional misregulation in cancer | 1.69E-03 | SP1, PLAU, ZEB1 |
| hsa05200 | Pathways in cancer | 1.74E-03 | TCF7, CCND1, CBL, TGFB2 |
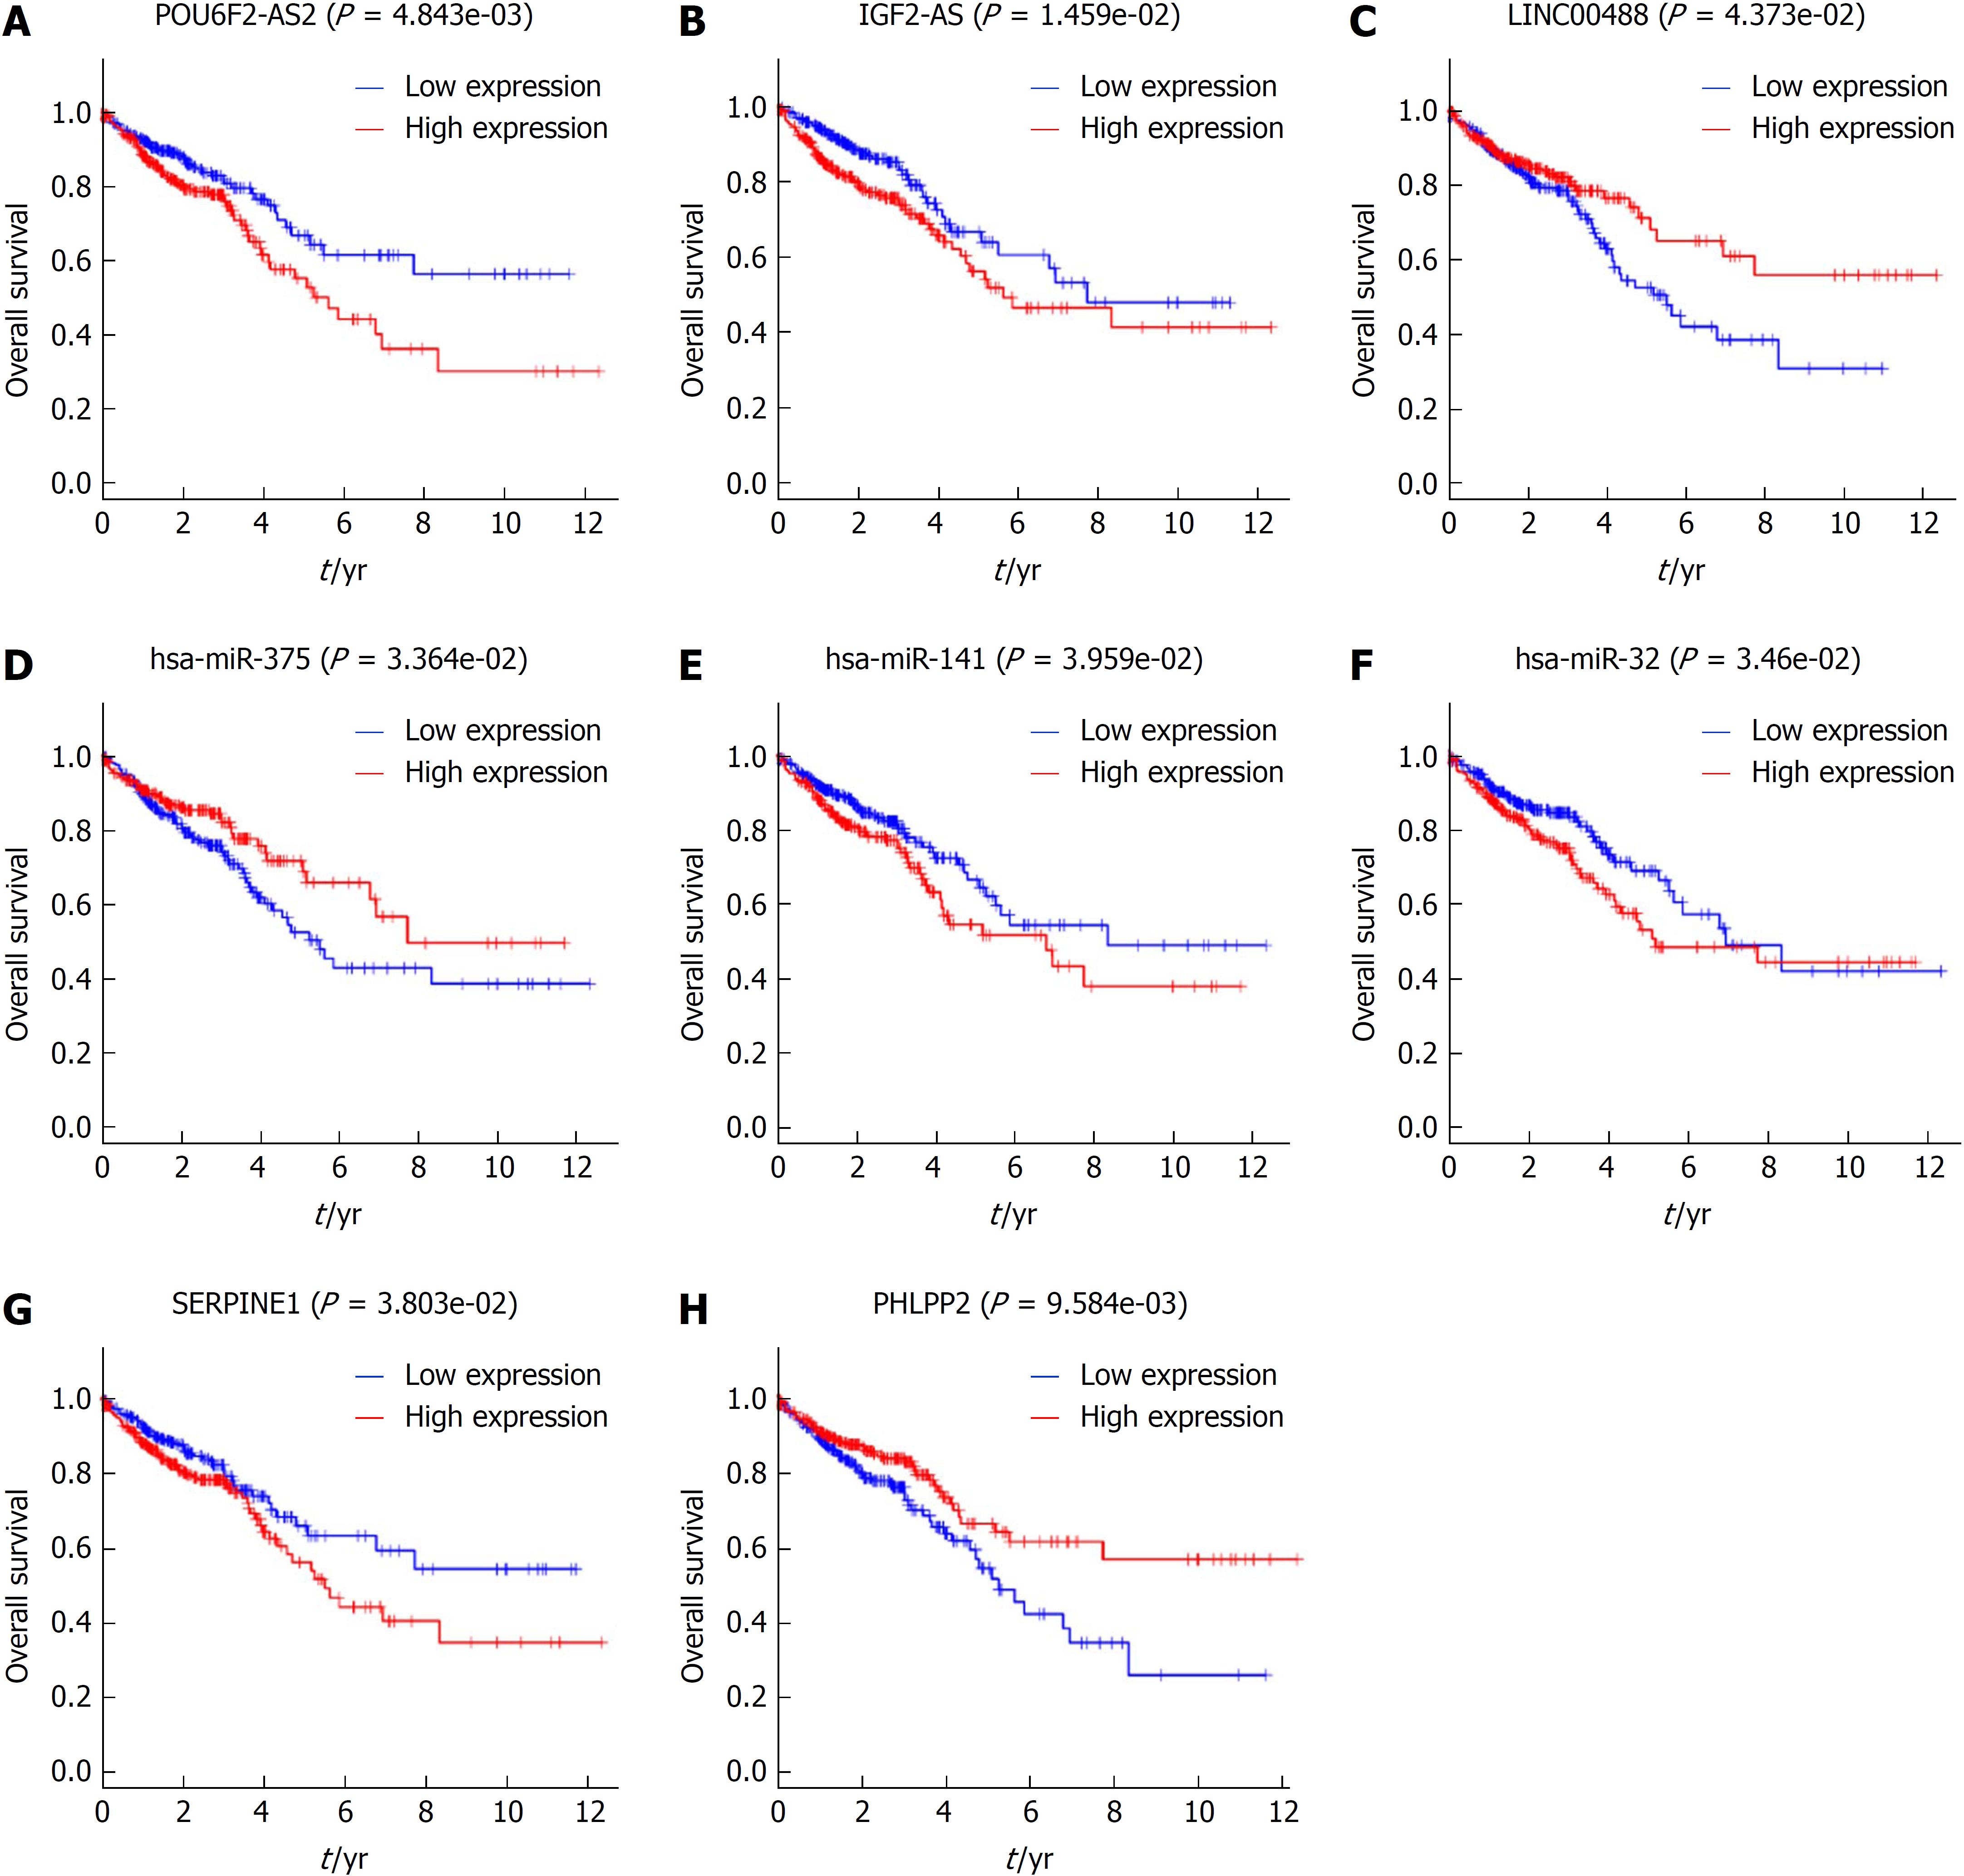
We preformed Kaplan-Meier curve analysis to identify the DEGs in the ceRNA networks that are related to overall survival. The results showed that 3 DElncRNAs (IGF2-AS, POU6F2-AS2, and LINC00488), 3 DEmiRNAs (hsa-miR-32, hsa-miR-141, and hsa-miR-375), and 2 DEmRNAs (PHLPP2 and SERPINE1) were associated with the clinical prognosis of patients. The Kaplan-Meier curves showed that the lncRNAs IGF2-AS and POU6F2-AS2, as well as hsa-miR-32, hsa-miR-141, and serpin peptidase inhibitor, clade E member 1 (SERPINE1) were negatively correlated with overall survival, whereas LINC00488, hsa-miR-375, and PH domain and leucine rich repeat protein phosphatase 2 (PHLPP2) were positively correlated with overall survival (Figure 6).
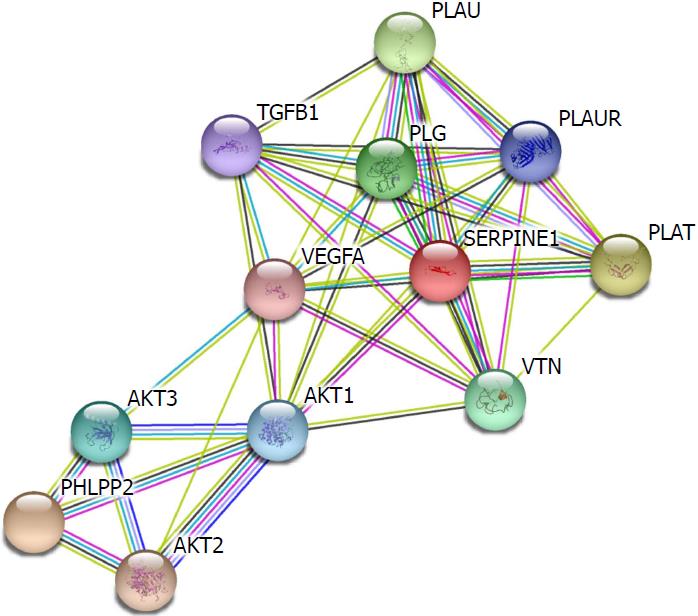
The ceRNA networks illustrated that PHLPP2 may be regulated by hsa-miR-32 and hsa-miR-141. Interestingly, PHLPP2 as well as hsa-miR-32 and hsa-miR-141 has been previously related to patient prognosis. We used the STRING protein database to analyze the protein-protein interactions of SERPINE1 and PHLPP2. The results revealed that SERPINE1 and PHLPP2 interact with V-akt murine thymoma viral oncogene homolog 1 (AKT1). Moreover, SERPINE1 can interact with several proteins including vascular endothelial growth factor A (VEGFA), vitronectin (VTN), transforming growth factor, beta 1 (TGFB1), plasminogen activator, urokinase (PLAU), plasminogen activator, urokinase receptor (PLAUR), plasminogen (PLG), and plasminogen activator, tissue (PLAT). Additionally, PHLPP2 can interact with AKT2 and AKT3 (Figure 7).
To further confirm our in silico results, we performed RT-qPCR to detect the expression levels of IGF2-AS, POU6F2-AS2, and LINC00488 in CRC cell lines (HT29, LoVo, and SW480) and in a normal intestinal epithelial cell line (NCM460). We found that the expression of IGF2-AS and POU6F2-AS2 was significantly increased in CRC cell lines. Conversely, LINC00488 was downregulated in CRC cell lines compared with NCM460 (Figure 8).
The role of ceRNAs in tumorigenesis and development has remained controversial[21]. However, many studies have revealed the regulatory function of ceRNA networks in proliferation, invasion, metastasis, and epithelial-mesenchymal transition (EMT). This urgently requires the establishment of a comprehensive regulatory network based on a large sample size of whole genome sequences. By constructing regulatory networks, we can better clarify the role of ceRNAs and provide direction for further research.
In this study, we integrated lncRNA, miRNA, and mRNA high-throughput data from TCGA and constructed ceRNA networks. KEGG pathway analysis of DEmRNAs indicated that ceRNA networks may regulate CRC progression via multiple mechanisms. It is noteworthy that “Colorectal cancer” was the most significant pathway in which transcription factor 7 (TCF7), cyclin D1 (CCND1), and transforming growth factor, beta 2 (TGFB2) are involved. TCF7 is a critical signaling molecule in the WNT/β-catenin pathway, which belongs to the TCF/LEF1 family[22]. The WNT/β-catenin pathway is recognized as a key regulator in cancer by transcriptionally activating a variety of oncogenes including CCND1[23]. CCND1 has been validated as an oncogene in CRC, and it regulates the cell cycle transition from the G1 phase to the S phase[24]. Chen et al[25] showed that TGFB2 induces CRC migration, metastasis, and the EMT by promoting SNAIL and SLUG expression.
To identify novel prognosis-related biomarkers, we applied Kaplan-Meier curve analysis to identify DEGs in ceRNA networks that correlated with clinical features among CRC patients. Ultimately, we detected 3 DEmiRNAs (hsa-miR-32, hsa-miR-141, and hsa-miR-375), and 2 DEmRNAs (PHLPP2 and SERPINE1) that may be indicators of prognosis. Wu et al[26] showed that hsa-miR-32 promoted CRC growth, migration, and invasion by downregulating PTEN. Feng et al[27] revealed that hsa-miR-141 may act as a biomarker for the early detection of recurrence during CRC surveillance. Cui et al[28] found that hsa-miR-375 acts as an anti-oncogene through the inhibition of SP-1, BCL-2, and other EMT-associated genes. Increased SERPINE1 expression has been found in G3/G4 CRC cells, which may be a predictor of CRC invasiveness, progression, and overall survival[29]. PHLPP2, a protein phosphatase, is an isoform of PHLPP. PHLPP2 negatively regulates RAF/MEK/ERK signaling by directly inhibiting RAF1 activity to inhibit the progression of cancer[30]. Li et al[31] and Liao et al[32] reported that hsa-miR-938 and hsa-miR-224 repressed PHLPP2 expression in CRC. In the ceRNA networks identified here, our prediction showed that PHLPP2 is targeted by hsa-miR-141, hsa-miR-32, and hsa-miR-424. We noted that the hsa-miR-141/PHLPP2 and hsa-miR-32/PHLPP2 axis in ceRNA networks may be a diagnostic biomarker and a therapeutic target for the treatment of CRC.
In the present study, 1043 DElncRNAs were detected in 644 CRC tissues compared to 51 normal tissues. Among them, 3 DElncRNAs (IGF2-AS, POU6F2-AS2, and LINC00488) were related to the prognosis of CRC. The lncRNA IGF2-AS is an antisense lncRNA for IGF2, and has been validated to promote hepatitis C virus replication[33]. In our work, IGF2-AS may regulate target genes by competitive sponging against hsa-miR-150 and hsa-miR-193b. The lncRNA POU6F2-AS2 has been demonstrated to be overexpressed in esophageal squamous cell cancer, which can directly target the Ybx protein and protect cancer cells from ionizing radiation[34]. We predicted that hsa-miR-375 interacts with POU6F2-AS2, which is related with clinical prognosis. Additionally, hsa-miR-375 is related to overall survival. The POU6F2-AS2/hsa-miR-375 axis may be another crucial diagnosis-related target. However, little is known about LINC00488. To confirm the expression levels of these three lncRNAs, we performed RT-qPCR in CRC cell lines. The results were consistent with the in silico analysis results. Additionally, little is known about the functions of IGF2-AS, POU6F2-AS2, and LINC00488 in CRC. Thus, additional research is needed to explore the biological and molecular mechanisms of these DElncRNAs in CRC.
In summary, we analyzed the expression profiles of CRC samples from TCGA and constructed ceRNA networks of the DEGs. KEGG pathway analysis further confirmed the role of these ceRNA networks in the development of CRC. Moreover, we identified several DEGs that were related to clinical prognosis, and the expression of IGF2-AS, POU6F2-AS2, and LINC00488 was validated using RT-qPCR in cell lines. Our study deepens our understanding of ceRNA networks and provides potential therapeutic targets and prognosis-related biomarkers for further research.
With the development of high-throughput technology, dysregulation of non-coding genes has been revealed in colorectal cancer (CRC). Furthermore, accumulating studies have demonstrated that long-noncoding RNAs (lncRNAs) function as competing endogenous RNAs (ceRNAs) to regulate oncogene and tumor suppressor gene expression by sponging microRNAs (miRNAs). In the present research, we constructed and analyzed the ceRNA networks and found the prognosis-related differentially expressed genes (DEGs) by bioinformatics analysis.
CRC is one of the most common malignancies in the world and the prognosis of patients in advanced stage remains poor. Therefore, specific biomarkers and novel therapeutic strategies are urgently required to improve the diagnosis and prognosis for CRC patients.
In our research, we aimed to construct ceRNA networks that include differentially expressed (DE)mRNAs, DElncRNAs, and DEmiRNAs based on co-expression database. Moreover, Kyoto Encyclopedia of Genes and Genomes (KEGG) pathway analysis and protein-protein interactions network analysis were performed to confirm the importance of ceRNA networks in the development of CRC. Importantly, our study provides new potential lncRNA/miRNA/mRNA axis for future research and clinical practice.
We obtained CRC tissue and normal tissue gene expression profiles from The Cancer Genome Atlas project. DEGs were identified by using the edgeR package in R software. Then, upregulated and downregulated miRNA-centered ceRNA networks were constructed by analyzing the DEGs using multiple bioinformatics approaches. The networks were visualized and mapped using Cytoscape software. DEmRNAs in the ceRNA networks were identified in KEGG pathways using KEGG Orthology Based Annotation System 3.0. Kaplan-Meier survival analysis was conducted for DEGs and real time quantitative polymerase chain reaction (RT-qPCR) was performed to verify the prognosis-associated DElncRNAs in CRC cell lines.
We constructed CRC ceRNA networks which included 81 DElncRNAs, 20 DEmiRNAs, and 54 DEmRNAs. KEGG pathway analysis indicated that nine pathways were related to cancer and the most significant pathway was “Colorectal cancer”. According to Kaplan-Meier curve analysis, the overall survival was positively associated with five DEGs (IGF2-AS, POU6F2-AS2, hsa-miR-32, hsa-miR-141, and SERPINE1) and it was negatively related to three DEGs (LINC00488, hsa-miR-375, and PHLPP2). The expression of prognosis-related DElncRNAs in CRC cell lines was consistent with the in silico results.
In the present study, we provide a new pathway to construct ceRNA networks for cancer research and novel insights on non-coding RNAs in CRC. We identified and constructed the ceRNA networks of CRC in large cohorts. Enrichment analysis results verified the critical role of the ceRNA networks in CRC. Besides, multiple prognosis-related DEGs found in this research could be used as potential biomarkers and therapeutic targets.
Further exploration of ceRNA networks provided a number of potential biomarkers and therapeutic targets for CRC. However, much more work is needed to reveal the function and mechanism of prognosis-related DEGs in the future.
Manuscript source: Unsolicited manuscript
Specialty type: Gastroenterology and hepatology
Country of origin: China
Peer-review report classification
Grade A (Excellent): 0
Grade B (Very good): B, B
Grade C (Good): 0
Grade D (Fair): 0
Grade E (Poor): 0
P- Reviewer: Bordonaro M, Langner C S- Editor: Wang XJ L- Editor: A E- Editor: Yin SY
| 1. | Torre LA, Bray F, Siegel RL, Ferlay J, Lortet-Tieulent J, Jemal A. Global cancer statistics, 2012. CA Cancer J Clin. 2015;65:87-108. [RCA] [PubMed] [DOI] [Full Text] [Cited by in Crossref: 18694] [Cited by in RCA: 21370] [Article Influence: 2137.0] [Reference Citation Analysis (3)] |
| 2. | Edwards BK, Ward E, Kohler BA, Eheman C, Zauber AG, Anderson RN, Jemal A, Schymura MJ, Lansdorp-Vogelaar I, Seeff LC. Annual report to the nation on the status of cancer, 1975-2006, featuring colorectal cancer trends and impact of interventions (risk factors, screening, and treatment) to reduce future rates. Cancer. 2010;116:544-573. [RCA] [PubMed] [DOI] [Full Text] [Cited by in Crossref: 1390] [Cited by in RCA: 1504] [Article Influence: 100.3] [Reference Citation Analysis (1)] |
| 3. | Siegel RL, Miller KD, Fedewa SA, Ahnen DJ, Meester RGS, Barzi A, Jemal A. Colorectal cancer statistics, 2017. CA Cancer J Clin. 2017;67:177-193. [RCA] [PubMed] [DOI] [Full Text] [Cited by in Crossref: 2526] [Cited by in RCA: 2912] [Article Influence: 364.0] [Reference Citation Analysis (3)] |
| 4. | Brosnan CA, Voinnet O. The long and the short of noncoding RNAs. Curr Opin Cell Biol. 2009;21:416-425. [RCA] [PubMed] [DOI] [Full Text] [Cited by in Crossref: 252] [Cited by in RCA: 277] [Article Influence: 17.3] [Reference Citation Analysis (0)] |
| 5. | Rigoutsos I. New tricks for animal microRNAS: targeting of amino acid coding regions at conserved and nonconserved sites. Cancer Res. 2009;69:3245-3248. [RCA] [PubMed] [DOI] [Full Text] [Cited by in Crossref: 159] [Cited by in RCA: 172] [Article Influence: 10.8] [Reference Citation Analysis (0)] |
| 6. | Bartel DP. MicroRNAs: target recognition and regulatory functions. Cell. 2009;136:215-233. [RCA] [PubMed] [DOI] [Full Text] [Cited by in Crossref: 14460] [Cited by in RCA: 16089] [Article Influence: 1005.6] [Reference Citation Analysis (2)] |
| 7. | Mattick JS, Rinn JL. Discovery and annotation of long noncoding RNAs. Nat Struct Mol Biol. 2015;22:5-7. [RCA] [PubMed] [DOI] [Full Text] [Cited by in Crossref: 430] [Cited by in RCA: 487] [Article Influence: 48.7] [Reference Citation Analysis (0)] |
| 8. | Salmena L, Poliseno L, Tay Y, Kats L, Pandolfi PP. A ceRNA hypothesis: the Rosetta Stone of a hidden RNA language? Cell. 2011;146:353-358. [RCA] [PubMed] [DOI] [Full Text] [Cited by in Crossref: 4127] [Cited by in RCA: 5558] [Article Influence: 397.0] [Reference Citation Analysis (0)] |
| 9. | Chen DL, Lu YX, Zhang JX, Wei XL, Wang F, Zeng ZL, Pan ZZ, Yuan YF, Wang FH, Pelicano H. Long non-coding RNA UICLM promotes colorectal cancer liver metastasis by acting as a ceRNA for microRNA-215 to regulate ZEB2 expression. Theranostics. 2017;7:4836-4849. [RCA] [PubMed] [DOI] [Full Text] [Full Text (PDF)] [Cited by in Crossref: 234] [Cited by in RCA: 243] [Article Influence: 30.4] [Reference Citation Analysis (0)] |
| 10. | Fang C, Qiu S, Sun F, Li W, Wang Z, Yue B, Wu X, Yan D. Long non-coding RNA HNF1A-AS1 mediated repression of miR-34a/SIRT1/p53 feedback loop promotes the metastatic progression of colon cancer by functioning as a competing endogenous RNA. Cancer Lett. 2017;410:50-62. [RCA] [PubMed] [DOI] [Full Text] [Cited by in Crossref: 83] [Cited by in RCA: 93] [Article Influence: 11.6] [Reference Citation Analysis (0)] |
| 11. | Wang Y, Liu Z, Yao B, Li Q, Wang L, Wang C, Dou C, Xu M, Liu Q, Tu K. Long non-coding RNA CASC2 suppresses epithelial-mesenchymal transition of hepatocellular carcinoma cells through CASC2/miR-367/FBXW7 axis. Mol Cancer. 2017;16:123. [RCA] [PubMed] [DOI] [Full Text] [Full Text (PDF)] [Cited by in Crossref: 149] [Cited by in RCA: 201] [Article Influence: 25.1] [Reference Citation Analysis (0)] |
| 12. | Tay Y, Rinn J, Pandolfi PP. The multilayered complexity of ceRNA crosstalk and competition. Nature. 2014;505:344-352. [RCA] [PubMed] [DOI] [Full Text] [Cited by in Crossref: 2305] [Cited by in RCA: 3097] [Article Influence: 281.5] [Reference Citation Analysis (0)] |
| 13. | Wang Z, Jensen MA, Zenklusen JC. A Practical Guide to The Cancer Genome Atlas (TCGA). Methods Mol Biol. 2016;1418:111-141. [RCA] [PubMed] [DOI] [Full Text] [Cited by in Crossref: 219] [Cited by in RCA: 435] [Article Influence: 48.3] [Reference Citation Analysis (0)] |
| 14. | Jeggari A, Marks DS, Larsson E. miRcode: a map of putative microRNA target sites in the long non-coding transcriptome. Bioinformatics. 2012;28:2062-2063. [RCA] [PubMed] [DOI] [Full Text] [Full Text (PDF)] [Cited by in Crossref: 447] [Cited by in RCA: 582] [Article Influence: 44.8] [Reference Citation Analysis (0)] |
| 15. | Hsu SD, Lin FM, Wu WY, Liang C, Huang WC, Chan WL, Tsai WT, Chen GZ, Lee CJ, Chiu CM. miRTarBase: a database curates experimentally validated microRNA-target interactions. Nucleic Acids Res. 2011;39:D163-D169. [RCA] [PubMed] [DOI] [Full Text] [Full Text (PDF)] [Cited by in Crossref: 879] [Cited by in RCA: 1021] [Article Influence: 68.1] [Reference Citation Analysis (0)] |
| 16. | Wong N, Wang X. miRDB: an online resource for microRNA target prediction and functional annotations. Nucleic Acids Res. 2015;43:D146-D152. [RCA] [PubMed] [DOI] [Full Text] [Full Text (PDF)] [Cited by in Crossref: 1247] [Cited by in RCA: 1419] [Article Influence: 129.0] [Reference Citation Analysis (0)] |
| 17. | Shannon P, Markiel A, Ozier O, Baliga NS, Wang JT, Ramage D, Amin N, Schwikowski B, Ideker T. Cytoscape: a software environment for integrated models of biomolecular interaction networks. Genome Res. 2003;13:2498-2504. [RCA] [PubMed] [DOI] [Full Text] [Cited by in Crossref: 24663] [Cited by in RCA: 33588] [Article Influence: 1599.4] [Reference Citation Analysis (0)] |
| 18. | Draghici S, Khatri P, Tarca AL, Amin K, Done A, Voichita C, Georgescu C, Romero R. A systems biology approach for pathway level analysis. Genome Res. 2007;17:1537-1545. [RCA] [PubMed] [DOI] [Full Text] [Cited by in Crossref: 806] [Cited by in RCA: 940] [Article Influence: 52.2] [Reference Citation Analysis (0)] |
| 19. | Xie C, Mao X, Huang J, Ding Y, Wu J, Dong S, Kong L, Gao G, Li CY, Wei L. KOBAS 2.0: a web server for annotation and identification of enriched pathways and diseases. Nucleic Acids Res. 2011;39:W316-W322. [RCA] [PubMed] [DOI] [Full Text] [Full Text (PDF)] [Cited by in Crossref: 2658] [Cited by in RCA: 3476] [Article Influence: 248.3] [Reference Citation Analysis (0)] |
| 20. | Schmittgen TD, Livak KJ. Analyzing real-time PCR data by the comparative C(T) method. Nat Protoc. 2008;3:1101-1108. [RCA] [PubMed] [DOI] [Full Text] [Cited by in Crossref: 16283] [Cited by in RCA: 19249] [Article Influence: 1132.3] [Reference Citation Analysis (0)] |
| 21. | Thomson DW, Dinger ME. Endogenous microRNA sponges: evidence and controversy. Nat Rev Genet. 2016;17:272-283. [RCA] [PubMed] [DOI] [Full Text] [Cited by in Crossref: 1116] [Cited by in RCA: 1590] [Article Influence: 176.7] [Reference Citation Analysis (0)] |
| 22. | Li Q, Hua Y, Yang Y, He X, Zhu W, Wang J, Gan X. TCF7/TCF1 feedback controls osteocalcin signaling in brown adipocytes independent of canonical WNT/β-catenin pathway. Mol Cell Biol. 2018;. [RCA] [PubMed] [DOI] [Full Text] [Cited by in Crossref: 11] [Cited by in RCA: 20] [Article Influence: 2.9] [Reference Citation Analysis (0)] |
| 23. | Kafri P, Hasenson SE, Kanter I, Sheinberger J, Kinor N, Yunger S, Shav-Tal Y. Quantifying β-catenin subcellular dynamics and cyclin D1 mRNA transcription during Wnt signaling in single living cells. Elife. 2016;5. [RCA] [PubMed] [DOI] [Full Text] [Full Text (PDF)] [Cited by in Crossref: 43] [Cited by in RCA: 62] [Article Influence: 6.9] [Reference Citation Analysis (0)] |
| 24. | Lewis RC, Bostick RM, Xie D, Deng Z, Wargovich MJ, Fina MF, Roufail WM, Geisinger KR. Polymorphism of the cyclin D1 gene, CCND1, and risk for incident sporadic colorectal adenomas. Cancer Res. 2003;63:8549-8553. [PubMed] |
| 25. | Chen S, Zhu J, Zuo S, Ma J, Zhang J, Chen G, Wang X, Pan Y, Liu Y, Wang P. 1,25(OH)2D3 attenuates TGF-β1/β2-induced increased migration and invasion via inhibiting epithelial-mesenchymal transition in colon cancer cells. Biochem Biophys Res Commun. 2015;468:130-135. [RCA] [PubMed] [DOI] [Full Text] [Cited by in Crossref: 36] [Cited by in RCA: 40] [Article Influence: 4.0] [Reference Citation Analysis (0)] |
| 26. | Wu W, Yang J, Feng X, Wang H, Ye S, Yang P, Tan W, Wei G, Zhou Y. MicroRNA-32 (miR-32) regulates phosphatase and tensin homologue (PTEN) expression and promotes growth, migration, and invasion in colorectal carcinoma cells. Mol Cancer. 2013;12:30. [RCA] [PubMed] [DOI] [Full Text] [Full Text (PDF)] [Cited by in Crossref: 113] [Cited by in RCA: 142] [Article Influence: 11.8] [Reference Citation Analysis (0)] |
| 27. | Feng L, Ma H, Chang L, Zhou X, Wang N, Zhao L, Zuo J, Wang Y, Han J, Wang G. Role of microRNA-141 in colorectal cancer with lymph node metastasis. Exp Ther Med. 2016;12:3405-3410. [RCA] [PubMed] [DOI] [Full Text] [Cited by in Crossref: 16] [Cited by in RCA: 17] [Article Influence: 1.9] [Reference Citation Analysis (0)] |
| 28. | Cui F, Wang S, Lao I, Zhou C, Kong H, Bayaxi N, Li J, Chen Q, Zhu T, Zhu H. miR-375 inhibits the invasion and metastasis of colorectal cancer via targeting SP1 and regulating EMT-associated genes. Oncol Rep. 2016;36:487-493. [RCA] [PubMed] [DOI] [Full Text] [Cited by in Crossref: 40] [Cited by in RCA: 44] [Article Influence: 4.9] [Reference Citation Analysis (0)] |
| 29. | Mazzoccoli G, Pazienza V, Panza A, Valvano MR, Benegiamo G, Vinciguerra M, Andriulli A, Piepoli A. ARNTL2 and SERPINE1: potential biomarkers for tumor aggressiveness in colorectal cancer. J Cancer Res Clin Oncol. 2012;138:501-511. [RCA] [PubMed] [DOI] [Full Text] [Full Text (PDF)] [Cited by in Crossref: 104] [Cited by in RCA: 107] [Article Influence: 8.2] [Reference Citation Analysis (0)] |
| 30. | Li X, Stevens PD, Liu J, Yang H, Wang W, Wang C, Zeng Z, Schmidt MD, Yang M, Lee EY. PHLPP is a negative regulator of RAF1, which reduces colorectal cancer cell motility and prevents tumor progression in mice. Gastroenterology. 2014;146:1301-1312.e1-e10. [RCA] [PubMed] [DOI] [Full Text] [Cited by in Crossref: 62] [Cited by in RCA: 72] [Article Influence: 6.5] [Reference Citation Analysis (0)] |
| 31. | Li CF, Li YC, Jin JP, Yan ZK, Li DD. miR-938 promotes colorectal cancer cell proliferation via targeting tumor suppressor PHLPP2. Eur J Pharmacol. 2017;807:168-173. [RCA] [PubMed] [DOI] [Full Text] [Cited by in Crossref: 14] [Cited by in RCA: 18] [Article Influence: 2.3] [Reference Citation Analysis (0)] |
| 32. | Liao WT, Li TT, Wang ZG, Wang SY, He MR, Ye YP, Qi L, Cui YM, Wu P, Jiao HL. microRNA-224 promotes cell proliferation and tumor growth in human colorectal cancer by repressing PHLPP1 and PHLPP2. Clin Cancer Res. 2013;19:4662-4672. [RCA] [PubMed] [DOI] [Full Text] [Cited by in Crossref: 89] [Cited by in RCA: 105] [Article Influence: 8.8] [Reference Citation Analysis (0)] |
| 33. | Xiong Y, Jia M, Yuan J, Zhang C, Zhu Y, Kuang X, Lan L, Wang X. STAT3regulated long noncoding RNAs lnc7SK and lncIGF2AS promote hepatitis C virus replication. Mol Med Rep. 2015;12:6738-6744. [RCA] [PubMed] [DOI] [Full Text] [Full Text (PDF)] [Cited by in Crossref: 27] [Cited by in RCA: 39] [Article Influence: 3.9] [Reference Citation Analysis (0)] |
| 34. | Liu J, Sun X, Zhu H, Qin Q, Yang X, Sun X. Long noncoding RNA POU6F2-AS2 is associated with oesophageal squamous cell carcinoma. J Biochem. 2016;160:195-204. [RCA] [PubMed] [DOI] [Full Text] [Cited by in Crossref: 18] [Cited by in RCA: 23] [Article Influence: 2.6] [Reference Citation Analysis (0)] |


