Published online Jul 28, 2018. doi: 10.3748/wjg.v24.i28.3145
Peer-review started: March 22, 2018
First decision: April 24, 2018
Revised: June 13, 2018
Accepted: June 25, 2018
Article in press: June 25, 2018
Published online: July 28, 2018
Processing time: 127 Days and 17.9 Hours
To evaluate the prognostic power of different molecular data in liver cancer.
Cox regression screen and least absolute shrinkage and selection operator were performed to select significant prognostic variables. Then the concordance index was calculated to evaluate the prognostic power. For the combination data, based on the clinical cox model, molecular features that better fit the model were combined to calculate the concordance index. Prognostic models were built based on the arithmetic summation of the significant variables. Kaplan-Meier survival curve and log-rank test were performed to compare the survival difference. Then a heatmap was constructed and gene set enrichment analysis was performed for pathway analysis.
The mRNA data were the most informative prognostic variables in all kinds of omics data in liver cancer, with the highest concordance index (C-index) of 0.61. For the copy number variation, methylation and miRNA data, the combination of molecular data with clinical data could significantly boost the prediction accuracy of the molecular data alone (P < 0.05). On the other hand, the combination of clinical data with methylation, miRNA and mRNA data could significantly boost the prediction accuracy of the clinical data itself (P < 0.05). Based on the significant prognostic variables, different prognostic models were built. In addition, the heatmap analysis, survival analysis, and gene set enrichment analysis validated the practicability of the prognostic models.
In all kinds of omics data in liver cancer, the mRNA data might be the most informative prognostic variable. The combination of clinical data with molecular data might be the future direction for cancer prognosis and prediction.
© The Author(s) 2018. Published by Baishideng Publishing Group Inc. All rights reserved.
Core tip: The Cancer Genome Atlas (TCGA) is funded by the National Institute of Health to describe the genomic alterations across cancer types. Several months after the publication of liver cancer TCGA, we systemically evaluated the prognostic power of different omics data of liver cancer. We found that in all kinds of omics data in liver cancer, the mRNA data might be the most informative prognostic variable. The combination of clinical data with molecular data might be the future direction for cancer prognosis and prediction.
- Citation: Song YZ, Li X, Li W, Wang Z, Li K, Xie FL, Zhang F. Integrated genomic analysis for prediction of survival for patients with liver cancer using The Cancer Genome Atlas. World J Gastroenterol 2018; 24(28): 3145-3154
- URL: https://www.wjgnet.com/1007-9327/full/v24/i28/3145.htm
- DOI: https://dx.doi.org/10.3748/wjg.v24.i28.3145
Liver cancer is the fourth most common digestive cancer, with the second highest cancer mortality rate worldwide[1,2]. Every year, there are approximately 750,000 new cases, and most of these patients died of liver cancer[2]. Due to tumor heterogeneity and patients’ physical status, the prognosis of liver cancer varied across different patients, with the average 5-year survival rate of 26%[2].
Prognostic markers can help make better clinical decision by selecting patients who respond well to some specific treatment. Currently, there are several commonly used clinical markers for liver cancer, such as alpha-fetoprotein (AFP), patient age, tumor stage and some scoring systems[3,4]. In addition, some genetic biomarkers are emerging as novel indicators in cancer diagnosis and prognosis, such as GPC3, DKK1, S100A4, S100A14, SOX6, SUOX, xCT, GRK6, et al[5,6].
The Cancer Genome Atlas (TCGA) is funded by the National Institute of Health (NIH) to describe the genomic alterations across different cancer types[7]. It provides tremendous amount of “omics” data, including mRNA sequencing data, miRNA sequencing data, reverse phase protein arrays data, copy number change data and DNA sequencing data. In 2017, the comprehensive genomic characteristics of liver cancer have also been analyzed[8]. It included unsupervised clustering of five molecular platforms to identify the hepatocellular carcinoma patients associated with poor prognosis.
However, there is no consensus on the predictive power of these indicators, especially the molecular markers. Therefore, by utilizing the TCGA data, we aimed to evaluate the prognostic power of liver cancer by molecular markers, and also to assess the predictive power of liver cancer by combining molecular markers and clinical data.
The clinical data and level 3 molecular data, including copy number variation (CNV), methylation, mRNA, miRNA and protein data of the liver cancer patients were downloaded from the TCGA repository (http://gdac.broadinstitute.org/). For the clinical data, we included the patient age and tumor stage, which were the easiest accessible information. For the CNV data, we adopted the Affymetrix genome-wide human SNP array 6.0 platform to detect the copy number variation. After we got the level 3 segmentation file of the copy number data, the GISTIC version 2.0.22 was executed to detect significant regions of amplification and deletion. For the methylation data, the Illumina DNA methylation 450 platform level 3 data was utilized. With respect to the mRNA and miRNA data, the Illumina HiSeq mRNASeq and Illumina HiSeq miRNASeq level 3 data were adopted. For the protein data, we applied the reverse phase protein array (RPPA) data platform.
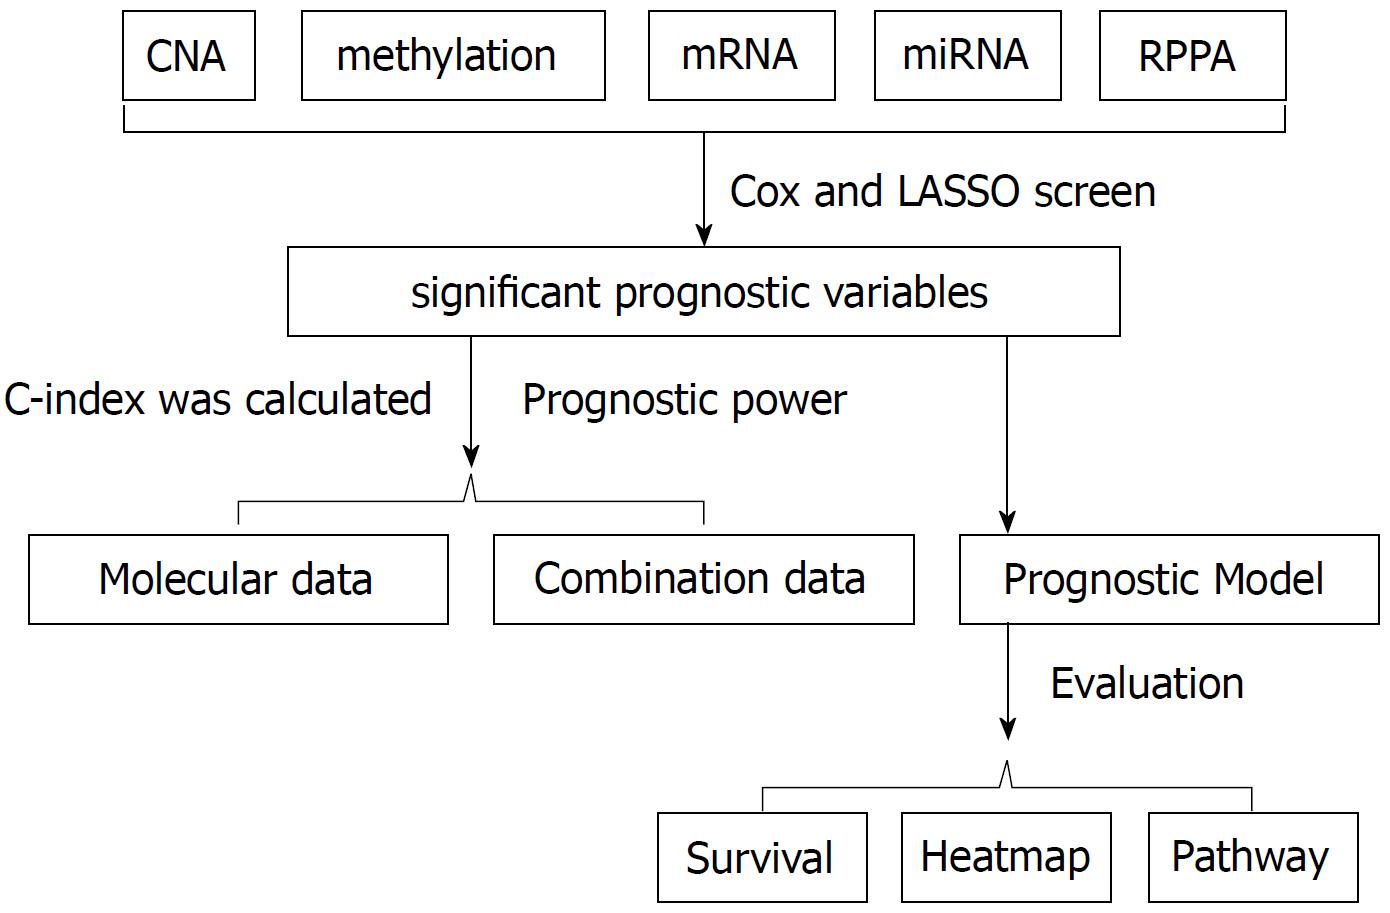
To evaluate the prognostic power among different omics data, we built a core set of samples. The patients in the core sample set were able to provide complete information from clinical data and different molecular platforms, including CNV, methylation, mRNA, miRNA and protein data. The concordance index (c-index) was calculated according to the method suggested by Yuan et al[9]. Briefly, training group patients (80% of total patients) and testing group patients (20% of total patients) were randomly divided from the core set for 100 times. Then the cox regression screen was applied to the training group with the R package “survival”, in order to select significant prognostic variables. To better converge the training model, least absolute shrinkage and selection operator (LASSO) was performed with the R package “glmnet”. Then the produced models were applied to the testing group for prediction. The C-index was calculated 100 times with the R package “survcomp”. The Wilcoxon test was utilized to calculate the P value (P < 0.05 as significant). For the combination data of clinical information and molecular features, clinical variables that were prognostic significant were used to build the cox model. Molecular features that better fit the model were then combined to build a new cox model. Similarly, the c-index was then calculated (Figure 1).
To establish the prognostic models, we performed the cox regression analysis and LASSO for all the cancer patients (including both training group and testing group) with complete data. After the significant prognostic variables were identified, we selected the significant variables to build the scoring model. To simplify the process and make it easier to apply in clinic, if the variable value in one patient was higher than the median value, we deemed it to be positive, with the score 1 or -1. Otherwise, the score was 0. The score of 1 or -1 was determined by the corresponding coefficient in the cox regression analysis. If the coefficient was positive, the score was 1. If the coefficient was negative, the score was -1. Normally, the higher the score was, the higher the risk of poor prognosis. When we divided the patients into the high risk group and low risk group based on the prognostic score, the Kaplan-Meier survival curve was performed to evaluate the overall survival. At the same time, the log-rank test was applied to evaluate the survival difference.
With respect to the gene expression analysis, the R package “limma” was utilized to detect the differentially expressed genes. Afterwards, the top 100 highly expressed genes and top 100 lowly expressed genes were selected to build the heatmap using the R package “gplots”. For the pathway analysis, we performed gene set enrichment analysis (GSEA) proposed by the Broad Institute (http://broadinstitute.org/gsea/downloads.jsp), with the gene sets downloaded from the MSigDB collections (software.broadinstitute.org/gsea/msigdb/collections.jsp).
Data of the liver cancer patients were downloaded from the TCGA repository (http://gdac.broadinstitute.org/). The platform information and sample size for each data type are shown in Table 1. The mean age of the liver cancer patients was 59 years old. They were 68% male and 32% female. In all of the included patients, 50% were in stage I, 25% were in stage II, 24% were in stage III, and the other 1% were in stage IV. To evaluate the prognostic power among the different omics data, we also built a core sample set of 171 patients, which only included patients with complete data of all five omics platforms, namely, copy number variation (CNV), methylation, mRNA, miRNA and protein level.
| CNV | Methylation | mRNA | miRNA | Protein | |
| Platform information | SNP_6 | 450K | HiSeq | HiSeq | RPPA |
| Sample size | 371 | 377 | 371 | 372 | 184 |
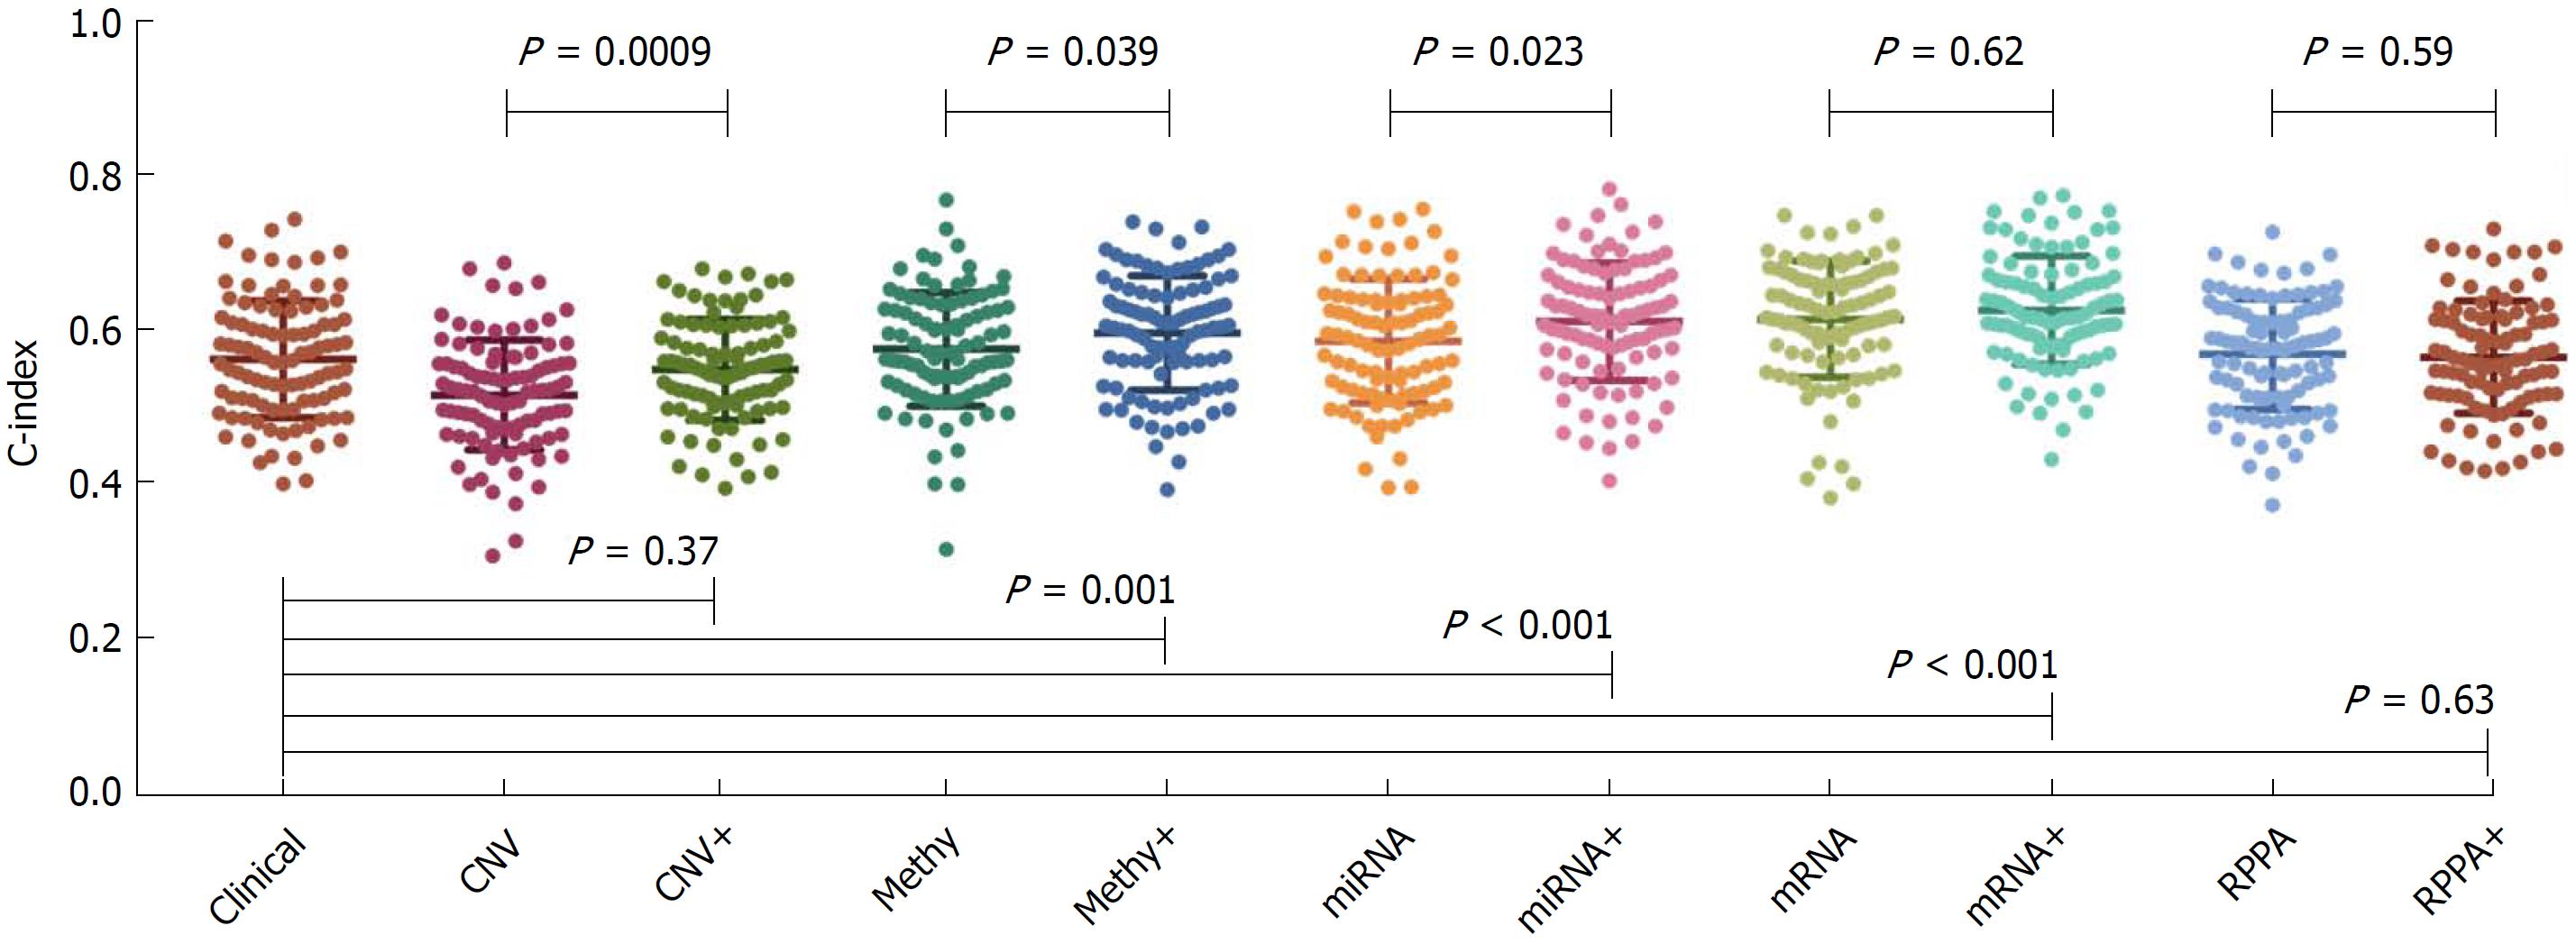
The concordance index (C-index) calculated from clinical data and each type of molecular data are shown in Figure 2. The average C-index of clinical data, CNV, methylation, miRNA, mRNA and protein was 0.56, 0.51, 0.57, 0.58, 0.61 and 0.57, respectively. For the molecular data alone, the mRNA data seemed to be the most informative predictors among all molecular data, with the highest C-index of 0.61. The C-index calculated from the combination of clinical data and molecular data was 0.55, 0.59, 0.61, 0.62 and 0.56 for the CNV, methylation, miRNA, mRNA and protein data, respectively. In the CNV, methylation and miRNA data, the combination of molecular data with clinical data could significantly boost the prediction accuracy of the molecular data alone (P < 0.05). On the other hand, the combination of clinical data with methylation, miRNA and mRNA data could significantly boost the prediction accuracy of the clinical data itself (P < 0.05).
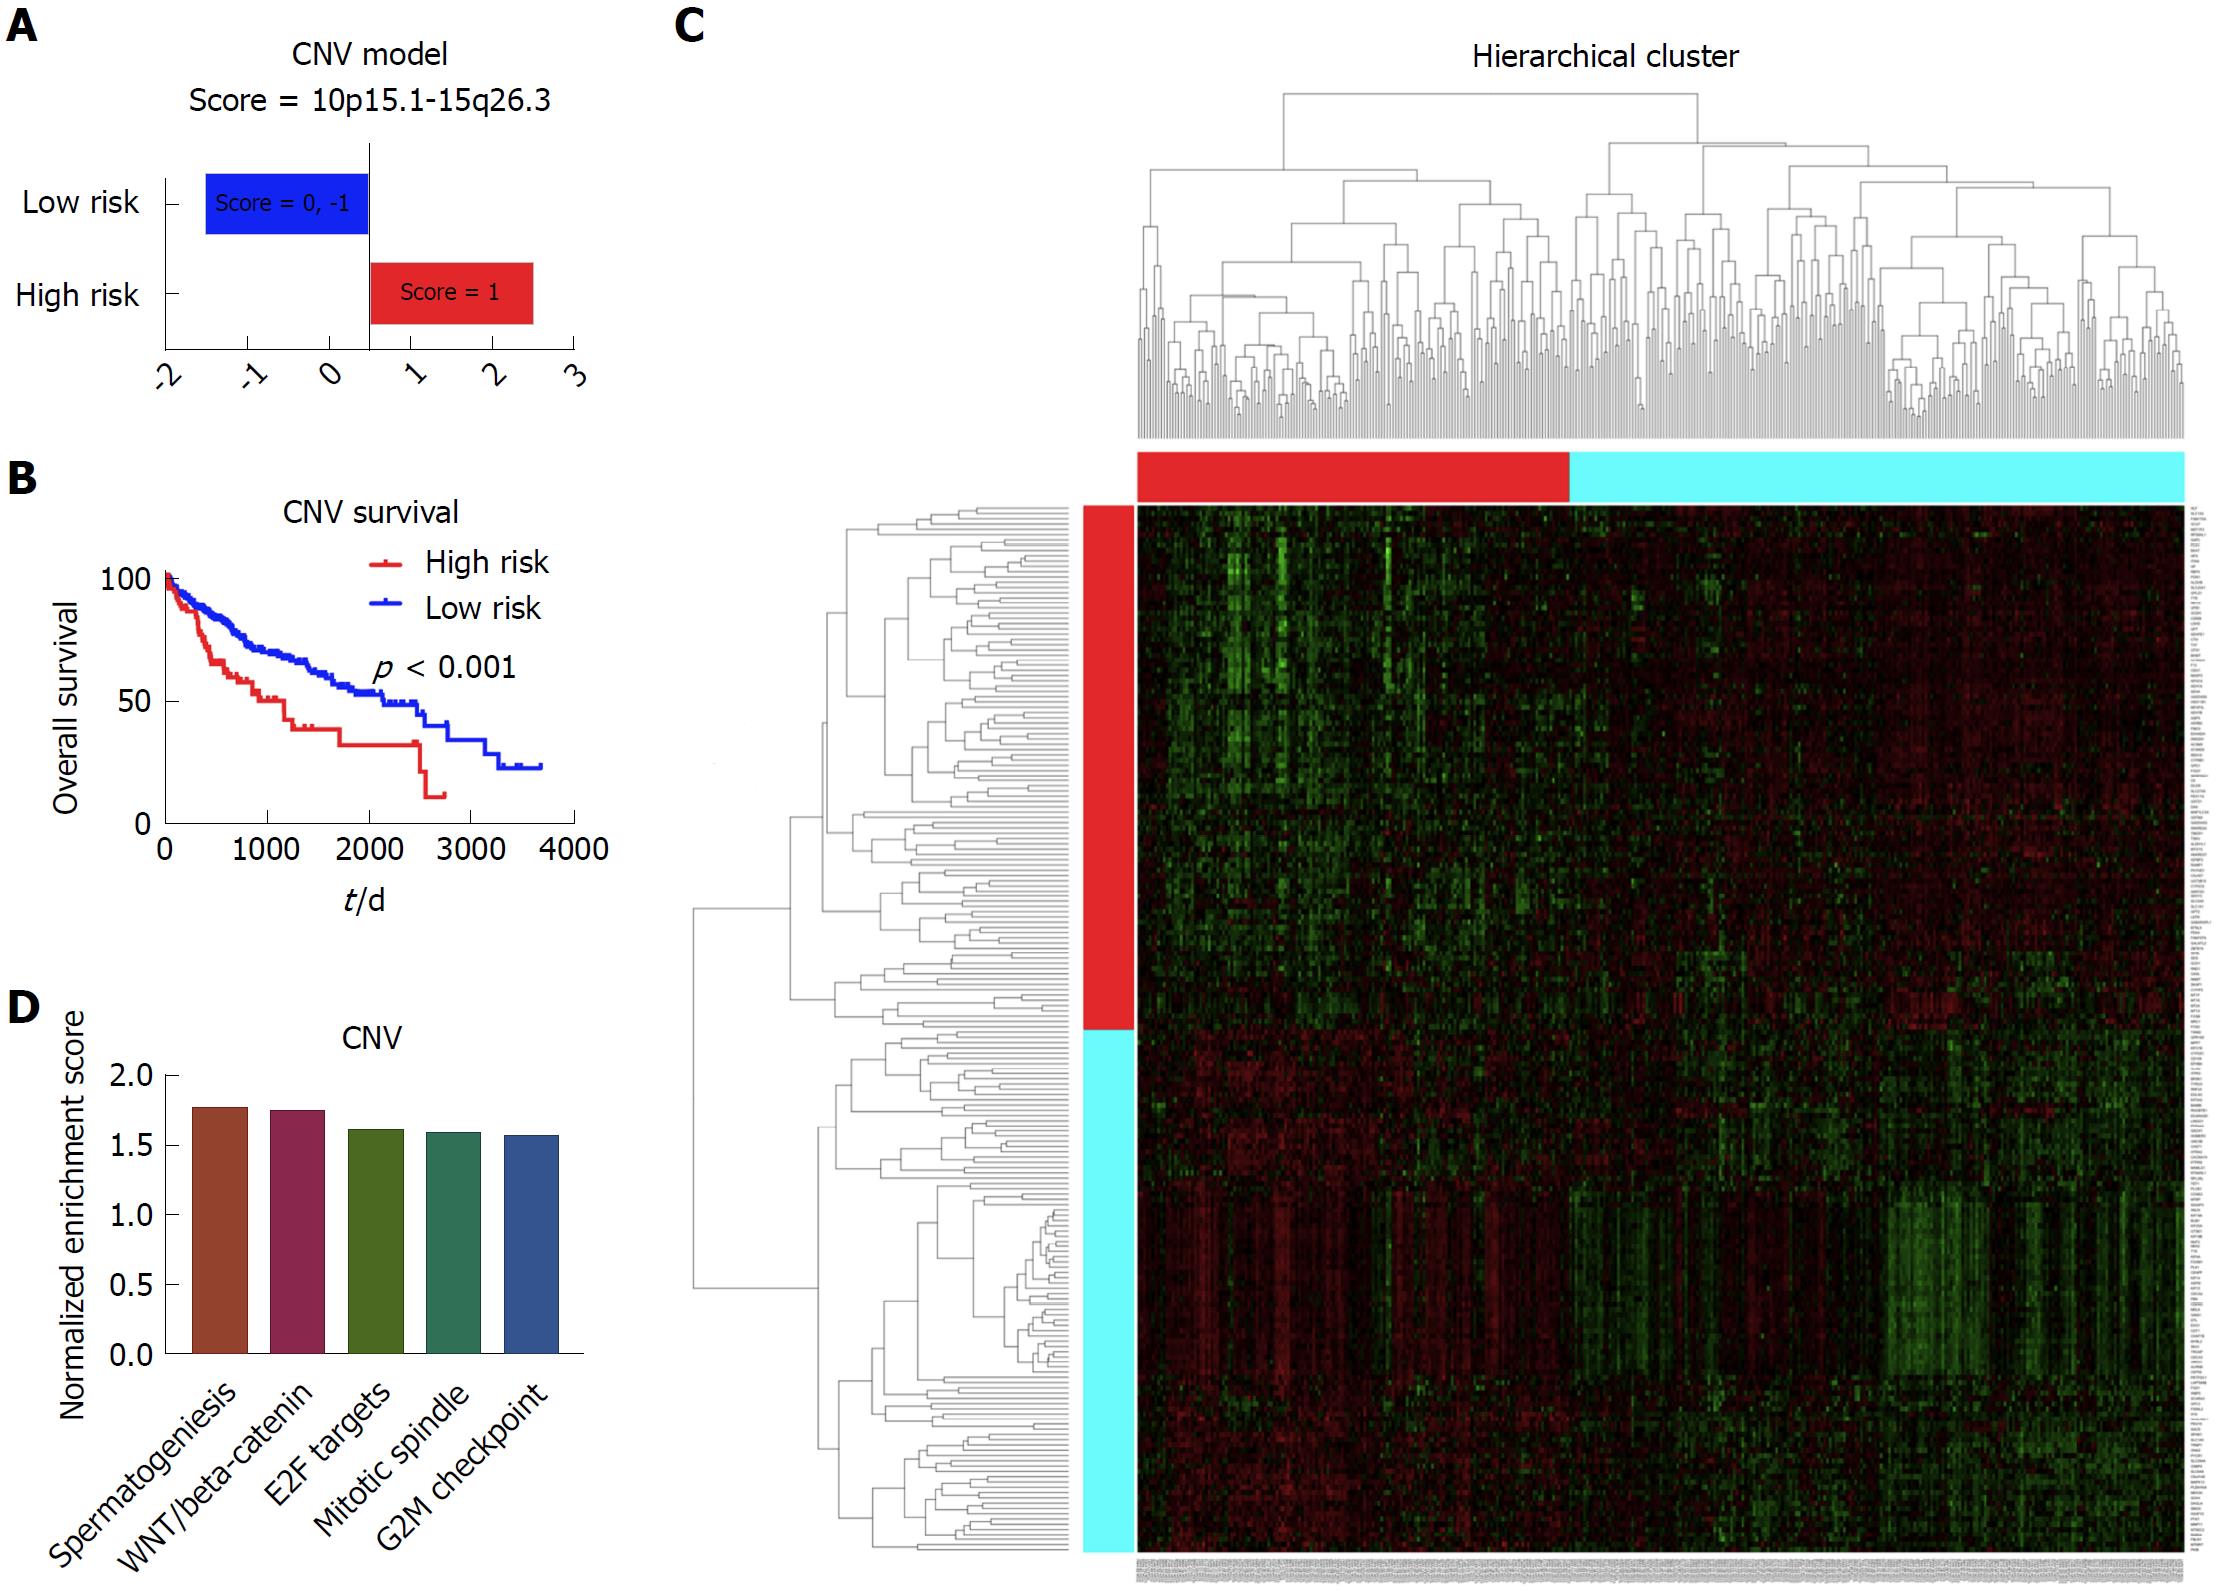
To establish the prognostic model based on the copy number data, we included all 371 patients with complete copy number variation data and clinical data. After the cox regression screen and LASSO, the 10p15.1 and 15q26.3 were identified to be the independent prognostic factors for the liver cancer. Afterwards, the prognostic model based on the significant copy number variation was built, which was able to divide the patients into the high risk group and low risk group (Figure 3A). Kaplan-Meier survival curve showed that there was significant difference with respect to the overall survival between these two group patients (Figure 3B). Afterwards, the limma and GSEA were performed to evaluate the different gene expression and pathways between these two groups. The heatmap showed that there was a distinct gene expression pattern between the high risk group and low risk group (Figure 3C). The GSEA showed that the spermatogenesis, WNT/beta-catenin, E2F targets, mitotic spindle and G2M checkpoint were the top five enriched pathways in the high risk group patients (Figure 3D).
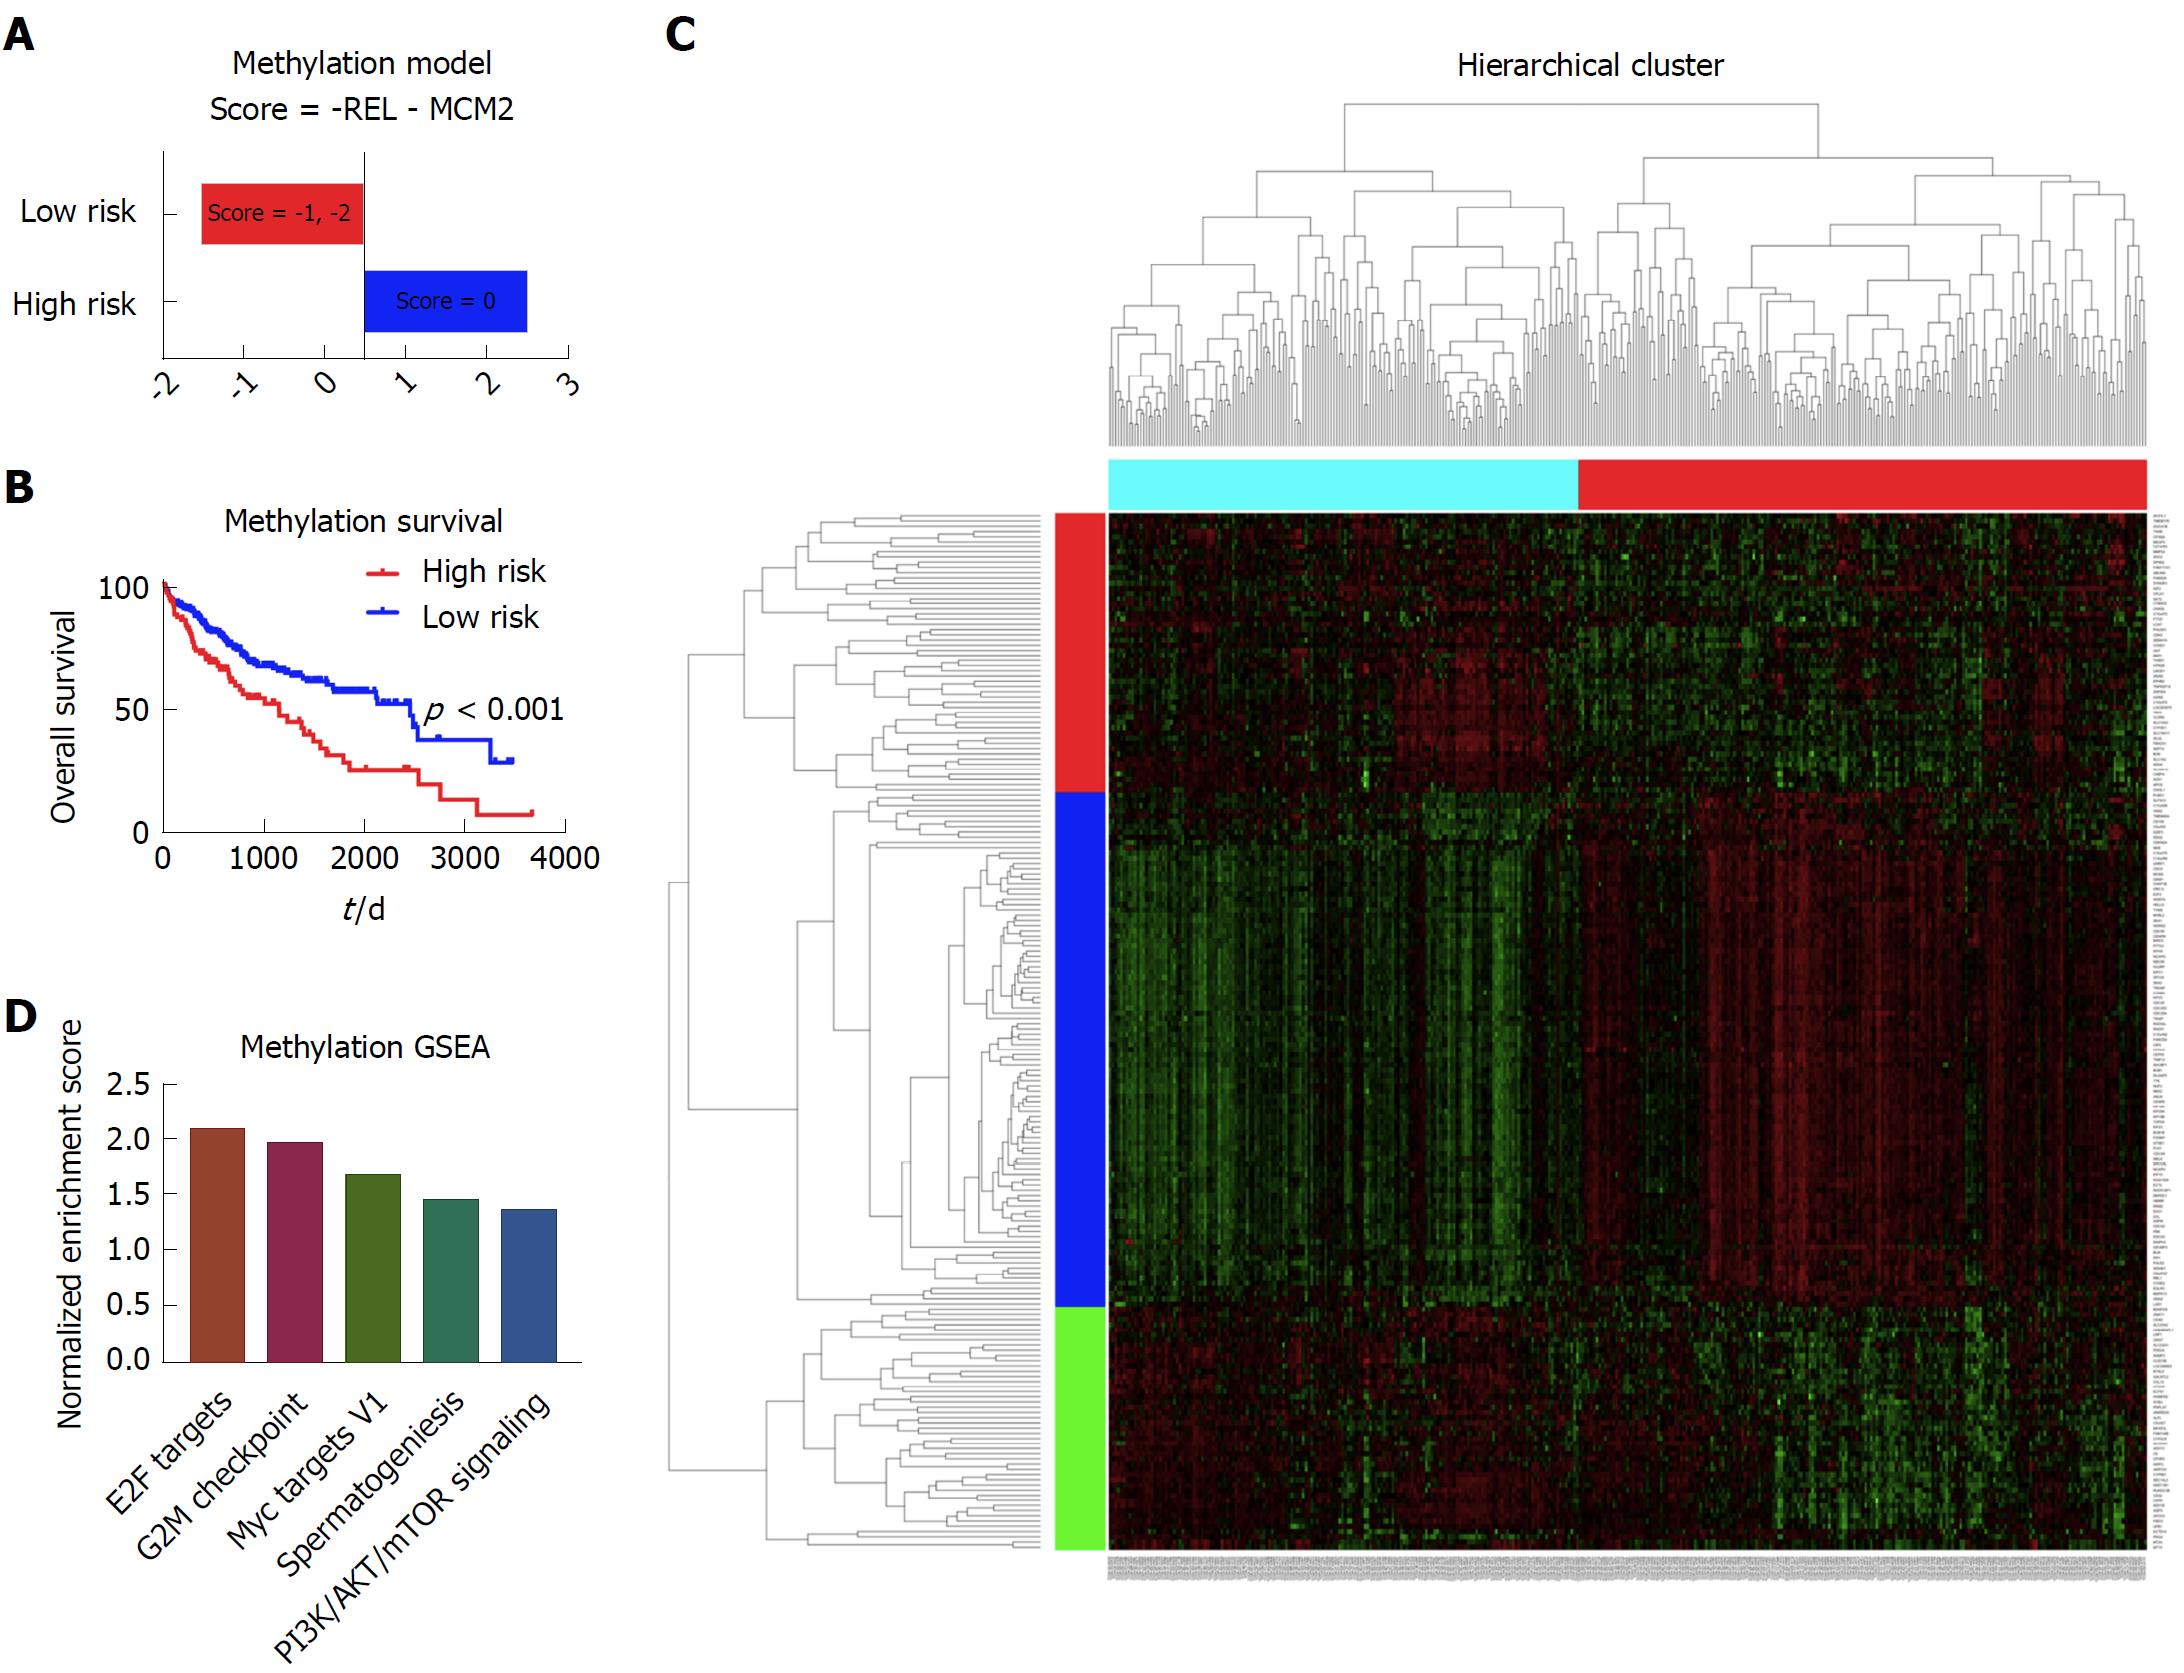
There were 377 patients with complete methylation data and clinical data that were included in the methylation model. With cox screen and LASSO, REL and MCM2 were shown to be independent prognostic factors. With a similar method to the copy number variation model, we built the prognostic model based on the methylation data (Figure 4A). Patients with different survival could be distinguished by the prognostic model, as shown in the Kaplan-Meier survival curve (Figure 4B). With respect to the mechanisms leading to the different outcomes, limma and GSEA were performed to show the different gene expression pattern and enriched pathways between the high risk patients and low risk patients (Figure 4C and D). The E2F targets, G2M checkpoint, Myc targets V1, spermatogenesis and PI3K/AKT/mTOR pathway signaling were among the top five enriched pathways in the high risk group of patients (Figure 4D).
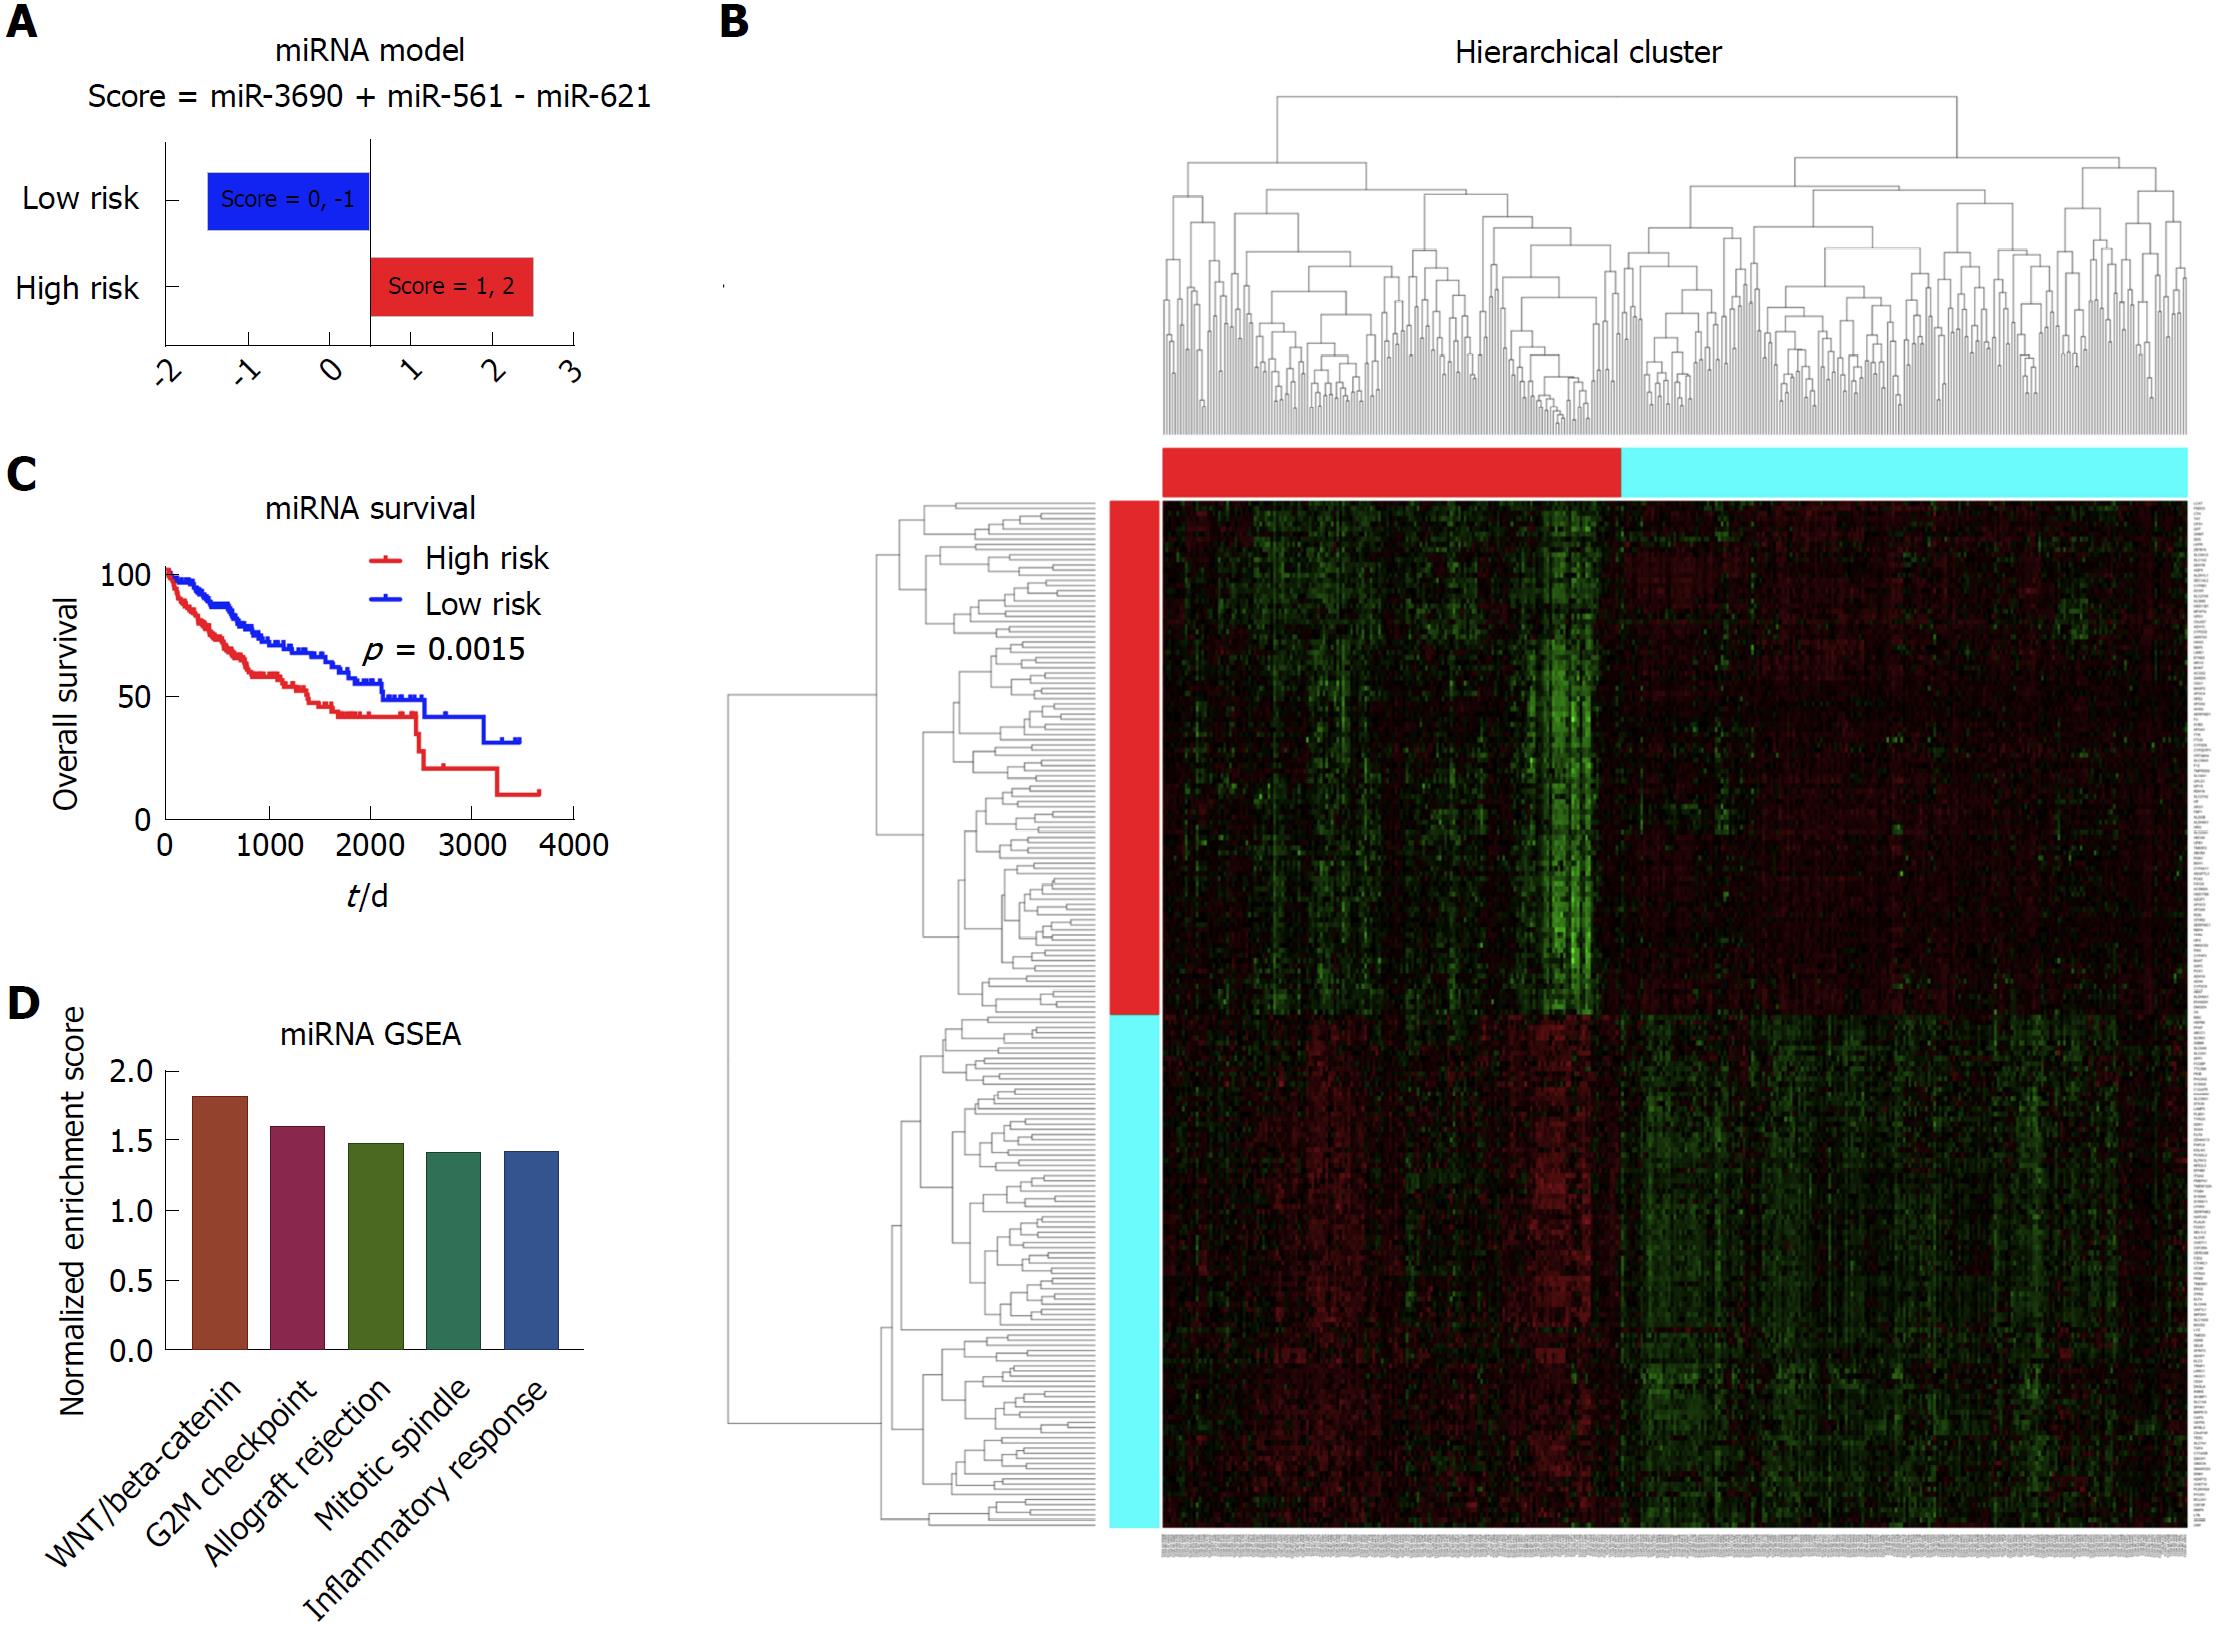
In the establishment of the miRNA model, there were 372 patients with complete miRNA data and clinical data in the analysis. The cox regression and LASSO were performed to screen the significant prognostic miRNAs. Results showed that miR-3690, miR-561 and miR-621 were independent prognostic factors for the liver cancer patients. Based on these three markers, the prognostic model was built, as shown in Figure 5A. Depending on the scores calculated from the miRNA model, the patients were divided into the high risk group and low risk group. As shown in the Kaplan-Meier survival curve, there was a significant survival difference between these two group patients (Figure 5B). According to the heatmap, it shows distinct gene expression patterns between these group patients (Figure 5C). In addition, GSEA showed that WNT/beta-catenin, G2M checkpoint, allograft rejection, mitotic spindle, and inflammatory response were among the top five enriched pathways in the high risk group patients (Figure 5D).
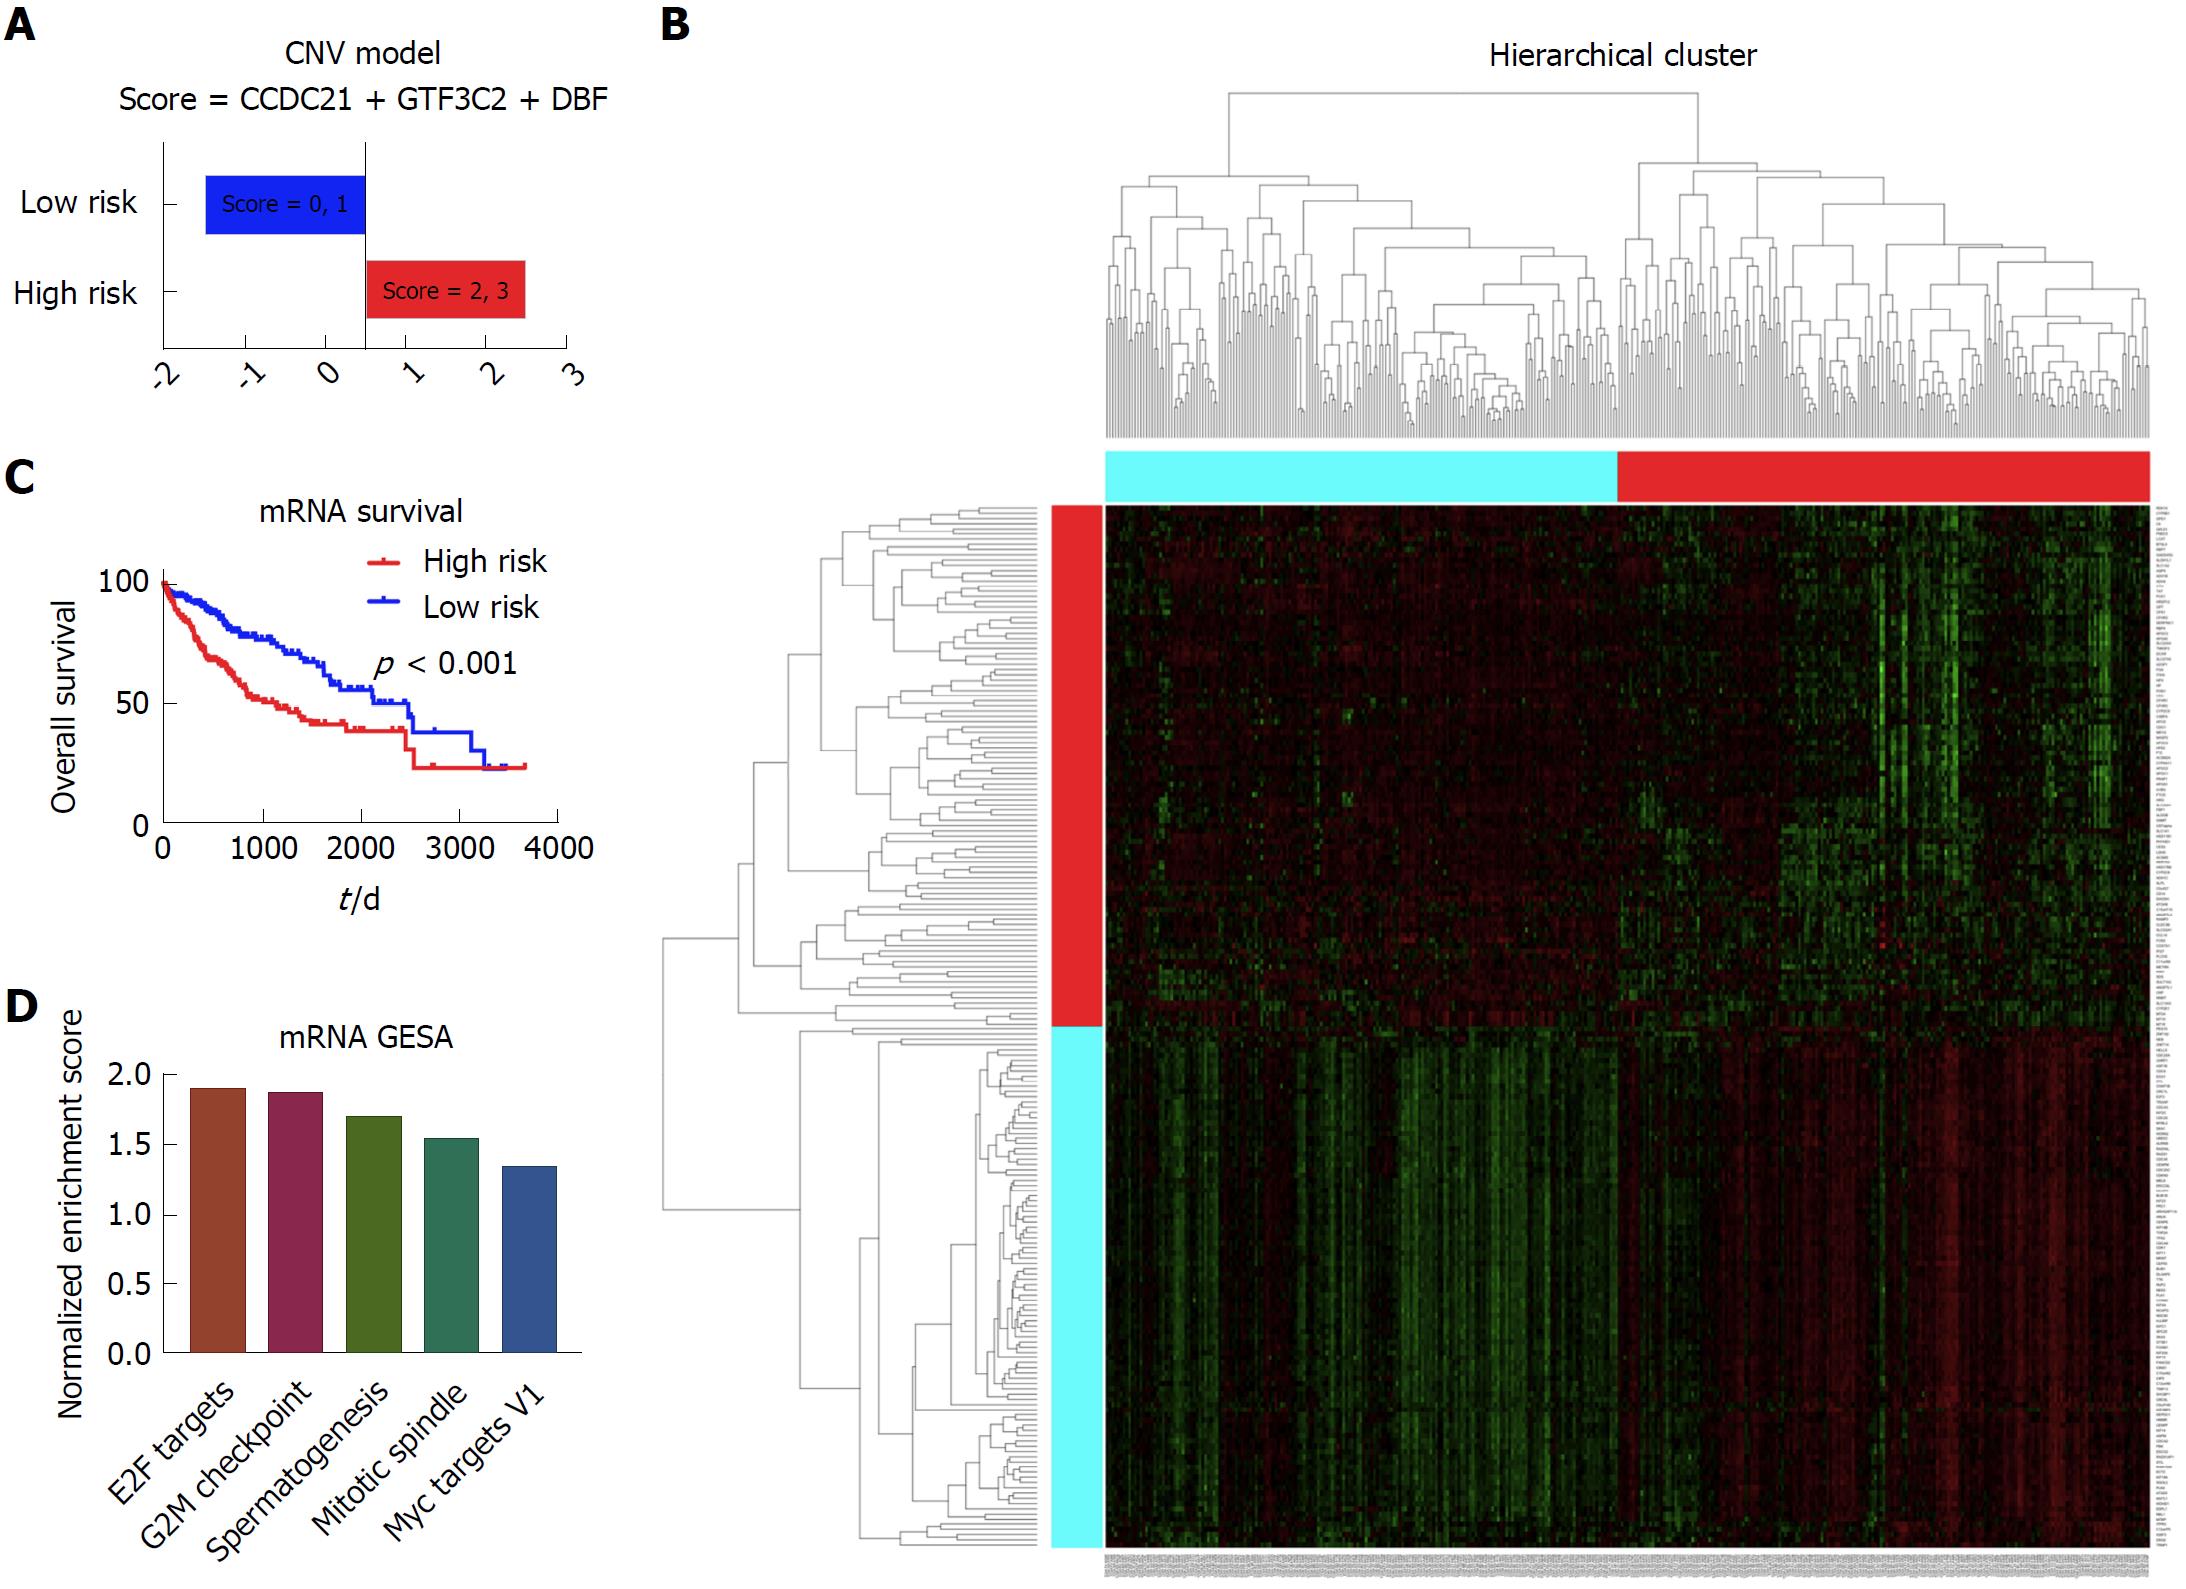
In this section, we included 371 patients with complete mRNA data and clinical data to build the prognostic model. After the cox regression screen and LASSO, CCDC21, GTF3C2, and DBF4 were selected to build the prognostic model, which divided the patients into the high risk group and low risk group based on each patient’s prognostic score (Figure 6A). According to the Kaplan-Meier survival curve and log-rank test, there was significant survival difference between these two patient groups (Figure 6B). The heatmap showing different expression patterns of these two group patients is shown in Figure 6C. With respect to the gene set enrichment analysis, the E2F targets, G2M checkpoint, spermatogenesis, mitotic spindle, and Myc targets v1 were significantly enriched in the high risk group patients (Figure 6D).
Several months after the publication of liver cancer TCGA, we systemically evaluated the prognostic power of different omics data of liver cancer[8]. We also explored whether additive prognostic power could be gained by the combination of molecular data with clinical data. In addition, based on the significant prognostic variables identified from the cox regression and LASSO analysis in different omics data, we also built the prognostic models.
In the evaluation of different omics data, we did not include the mutation data from DNA sequencing platform, since the mutation gene and hot-spot mutation site varied a lot among different patients, and it is difficult to divide the patients into a high risk group and low risk group. In addition, it might also need some complicated bioinformatical algorithm to evaluate the prognostic power.
Our results showed that the mRNA data alone seemed to be the most informative prognostic variable (C-index = 0.61) among all the molecular platforms. Consistently, by analyzing breast cancer, glioblastoma multiforme, myeloid leukemia and lung squamous cell carcinoma data, Zhao demonstrated that molecular variables evaluated at the transcription level could reflect patient survival more effectively than those evaluated at the DNA/epigenetic level. There have been several studies focusing on the mRNA prognostic models of liver cancer. For example, Chen et al[10] combined three mRNA markers to build the prognostic model and demonstrated it to be useful. Nault et al[11] built a 5-gene score associated with overall survival of liver cancer patients after resection. Zhang et al[12] defined a hepatic stellate cell 122-gene signature to identify liver cancer patients with poor prognosis. Although with lower prognostic power, some prognostic models based on the CNV, methylation, miRNA and protein data have also widely attracted attention[13-16].
Boulesteix et al[17] claimed that little attention was paid to the assessment of the added prognostic power of a molecular signature, given that the clinical predictors or an established model were available. Thus in this study, we showed that the combination of molecular data with clinical data could significantly boost the prediction accuracy of the molecular data alone in the CNV, methylation and miRNA data. On the other hand, the combination of clinical data with methylation, miRNA and mRNA data could significantly boost the prediction accuracy of the clinical data itself. Consistently, Yuan et al[9] summarized that incorporating molecular features with clinical data yielded significantly increased predictions (FDR < 0.05) for kidney cancer, glioblastoma multiforme and ovarian cancer, but the quantitative gains were limited. Some complicated bioinformatical algorithms might be needed to further improve the prognostic power of the combination data.
With respect to the prognostic models based on different omics data, we did not include the protein model, since no significant prognostic variable passed through the cox screen and LASSO analysis. We suppose that one reason is the relative sample size of the patients with protein data. The other reason is due to the complexity of the proteome data. In the copy number model, the 10p15.1 and 15q26.3 were included in our study. Previous studies showed that a telomerase repressor gene might be located on 10p15.1, thus relating it to the prognosis of liver cancer[18]. Meanwhile, genomic copy number variations of 15q26.3 were deemed to be predictive markers for the systemic recurrence of breast cancer[19].
In the analysis of methylation data, REL and MCM2 were demonstrated to be independent prognostic factors. Previous studies showed that REL was involved in apoptosis, inflammation, immune response, and oncogenic processes. Constitutive activation of the Rel/NF-κB pathway could lead to oncogenesis by driving proliferation, enhancing cell survival, or promoting angiogenesis or metastasis[20]. There were also studies reporting that MCM2 was closely related to tumor grade and overall survival in renal cancer[21]. However, this is the first study to demonstrate the methylation of these two markers as prognostic factors in liver cancer.
miRNA alterations were reported to participate in the initiation and progression of human cancer[22]. In our study, miR-3690, miR-561, and miR-621 were included in the prognostic model. This is the first time that we identified miR-3690 as the prognostic variable in cancer prognosis. On the other hand, Qian et al[23] reported that miR-561 inhibited cellular proliferation and invasion by targeting c-Myc in gastric cancer. MiR-621 was supposed to sensitize breast cancer to chemotherapy by inhibiting FBXO11 and increasing p53 activity[24]. Thus, it was not difficult to comprehend that they were all involved in the prognosis of liver cancer.
With respect to the mRNA model, CCDC21, GTF3C2 and DBF4 were demonstrated to be independent prognostic factors in liver cancer. CCD21, also called Cep85, is an antagonist of Nek2A that suppresses centrosome disjunction[25]. GTF3C2 is essential for RNA polymerase III-mediated transcription. Until now, there are few studies relating CCD21 and GTF3C2 to cancer progression or prognosis. With respect to DBF4, the CDC7-DBF4 kinase, which was correlated with p53 inactivation, was reported to be overexpressed in multiple cancers[26]. Thus, it is the first study to correlate these markers with patient survival in liver cancer.
Interestingly, most prognostic variables identified in our study seemed to be novel markers in cancer study. Probably due to the strict screen procedure, a lot of traditional prognostic markers were ignored, such as P53 and FOXM1. However, on the other hand, it also demonstrates that our prognostic markers might be more robust and more stable after the strict screening procedure. In summary, the major goal of our study was to evaluate the prognostic power of different omics data in liver cancer. For the first time, we showed that the mRNA data was the most informative prognostic variables in all kinds of omics data in liver cancer. In addition, we also revealed that the combination of clinical data with molecular data might be the future direction for cancer prognosis and prediction. Larger sample size and more mature bioinformatic algorithms were needed to predict the cancer prognosis more precisely in the future.
Liver cancer is the fourth most common digestive cancer worldwide. Prognostic markers can help to make better clinical decision by selecting patients who respond well to some specific treatment. Besides traditional clinical markers, genetic biomarkers are emerging as novel indicators in cancer diagnosis and prognosis. The Cancer Genome Atlas (TCGA) is funded by the National Institute of Health (NIH) to describe the genomic alterations across cancer types. It provides tremendous amount of “omics” data, including mRNA sequencing, miRNA sequencing, reverse phase protein arrays, copy number change and DNA sequencing.
Although there seems to be great potential value of the clinical and genetic markers, there is no consensus on the predictive power of these indicators, especially the molecular markers.
By utilizing the TCGA data, we aimed to evaluate the prognostic power of liver cancer by molecular markers, and also to assess the predictive power of liver cancer by combining molecular markers and clinical data.
Cox regression screen and least absolute shrinkage and selection operator (LASSO) were performed to select significant prognostic variables. Then the concordance index was calculated to evaluate the prognostic power. For the combination data, based on the clinical cox model, molecular features that better fit the model were combined to calculate the concordance index. Prognostic models were built based on the arithmetic summation of the significant variables. Kaplan-Meier survival curve and log-rank test were performed to compare the survival difference. Then the heatmap was constructed and gene set enrichment analysis was performed for pathway analysis.
The mRNA data was the most informative prognostic variables in all kinds of omics data in liver cancer. In the copy number variation (CNV), methylation and miRNA data, the combination of molecular data with clinical data could significantly boost the prediction accuracy of the molecular data alone. On the other hand, the combination of clinical data with methylation, miRNA and mRNA data could significantly boost the prediction accuracy of the clinical data itself. Based on the significant prognostic variables, several prognostic models were built. For the CNV data, score = 10p15.1 - 15q26.3. For the methylation data, score = - REL - MCM2. For the miRNA data, score = miR-3690 + miR-561 - miR-621. For the mRNA data, score = CCDC21 + GTF3C2 + DBF4.
In all kinds of omics data in liver cancer, the mRNA data might be the most informative prognostic variables.
The combination of clinical data with molecular data might be the future direction for cancer prognosis and prediction.
Manuscript source: Unsolicited manuscript
Specialty type: Gastroenterology and hepatology
Country of origin: China
Peer-review report classification
Grade A (Excellent): 0
Grade B (Very good): B, B
Grade C (Good): C
Grade D (Fair): 0
Grade E (Poor): 0
P- Reviewer: Corrales FJ, Fujita T, Grassi G S- Editor: Wang XJ L- Editor: Filipodia E- Editor: Yin SY
| 1. | Siegel RL, Miller KD, Jemal A. Cancer statistics, 2018. CA Cancer J Clin. 2018;68:7-30. [RCA] [PubMed] [DOI] [Full Text] [Cited by in Crossref: 11573] [Cited by in RCA: 13158] [Article Influence: 1879.7] [Reference Citation Analysis (4)] |
| 2. | Maluccio M, Covey A. Recent progress in understanding, diagnosing, and treating hepatocellular carcinoma. CA Cancer J Clin. 2012;62:394-399. [RCA] [PubMed] [DOI] [Full Text] [Cited by in Crossref: 577] [Cited by in RCA: 698] [Article Influence: 53.7] [Reference Citation Analysis (0)] |
| 3. | Xu XS, Qu K, Liu C, Zhang YL, Liu J, Song YZ, Zhang P, Liu SN, Chang HL. Highlights for α-fetoprotein in determining prognosis and treatment monitoring for hepatocellular carcinoma. World J Gastroenterol. 2012;18:7242-7250. [RCA] [PubMed] [DOI] [Full Text] [Full Text (PDF)] [Cited by in CrossRef: 10] [Cited by in RCA: 12] [Article Influence: 0.9] [Reference Citation Analysis (0)] |
| 4. | Borzio M, Dionigi E, Rossini A, Marignani M, Sacco R, De Sio I, Bertolini E, Francica G, Giacomin A, Parisi G. External validation of the ITA.LI.CA prognostic system for patients with hepatocellular carcinoma: A multicenter cohort study. Hepatology. 2018;67:2215-2225. [RCA] [PubMed] [DOI] [Full Text] [Cited by in Crossref: 41] [Cited by in RCA: 41] [Article Influence: 5.9] [Reference Citation Analysis (0)] |
| 5. | Zucman-Rossi J, Villanueva A, Nault JC, Llovet JM. Genetic Landscape and Biomarkers of Hepatocellular Carcinoma. Gastroenterology. 2015;149:1226-1239.e4. [RCA] [PubMed] [DOI] [Full Text] [Cited by in Crossref: 744] [Cited by in RCA: 951] [Article Influence: 95.1] [Reference Citation Analysis (0)] |
| 6. | Scaggiante B, Kazemi M, Pozzato G, Dapas B, Farra R, Grassi M, Zanconati F, Grassi G. Novel hepatocellular carcinoma molecules with prognostic and therapeutic potentials. World J Gastroenterol. 2014;20:1268-1288. [RCA] [PubMed] [DOI] [Full Text] [Full Text (PDF)] [Cited by in CrossRef: 58] [Cited by in RCA: 60] [Article Influence: 5.5] [Reference Citation Analysis (0)] |
| 7. | Tomczak K, Czerwińska P, Wiznerowicz M. The Cancer Genome Atlas (TCGA): an immeasurable source of knowledge. Contemp Oncol (Pozn). 2015;19:A68-A77. [RCA] [PubMed] [DOI] [Full Text] [Full Text (PDF)] [Cited by in Crossref: 908] [Cited by in RCA: 2034] [Article Influence: 203.4] [Reference Citation Analysis (0)] |
| 8. | Cancer Genome Atlas Research Network. Cancer Genome Atlas Research Network. Comprehensive and Integrative Genomic Characterization of Hepatocellular Carcinoma. Cell. 2017;169:1327-1341.e23. [RCA] [PubMed] [DOI] [Full Text] [Cited by in Crossref: 1578] [Cited by in RCA: 1729] [Article Influence: 216.1] [Reference Citation Analysis (1)] |
| 9. | Yuan Y, Van Allen EM, Omberg L, Wagle N, Amin-Mansour A, Sokolov A, Byers LA, Xu Y, Hess KR, Diao L. Assessing the clinical utility of cancer genomic and proteomic data across tumor types. Nat Biotechnol. 2014;32:644-652. [RCA] [PubMed] [DOI] [Full Text] [Full Text (PDF)] [Cited by in Crossref: 206] [Cited by in RCA: 211] [Article Influence: 19.2] [Reference Citation Analysis (0)] |
| 10. | Chen SS, Yu KK, Ling QX, Huang C, Li N, Zheng JM, Bao SX, Cheng Q, Zhu MQ, Chen MQ. The combination of three molecular markers can be a valuable predictive tool for the prognosis of hepatocellular carcinoma patients. Sci Rep. 2016;6:24582. [RCA] [PubMed] [DOI] [Full Text] [Full Text (PDF)] [Cited by in Crossref: 14] [Cited by in RCA: 14] [Article Influence: 1.6] [Reference Citation Analysis (0)] |
| 11. | Nault JC, De Reyniès A, Villanueva A, Calderaro J, Rebouissou S, Couchy G, Decaens T, Franco D, Imbeaud S, Rousseau F. A hepatocellular carcinoma 5-gene score associated with survival of patients after liver resection. Gastroenterology. 2013;145:176-187. [RCA] [PubMed] [DOI] [Full Text] [Cited by in Crossref: 251] [Cited by in RCA: 266] [Article Influence: 22.2] [Reference Citation Analysis (0)] |
| 12. | Zhang DY, Goossens N, Guo J, Tsai MC, Chou HI, Altunkaynak C, Sangiovanni A, Iavarone M, Colombo M, Kobayashi M. A hepatic stellate cell gene expression signature associated with outcomes in hepatitis C cirrhosis and hepatocellular carcinoma after curative resection. Gut. 2016;65:1754-1764. [RCA] [PubMed] [DOI] [Full Text] [Cited by in Crossref: 87] [Cited by in RCA: 103] [Article Influence: 11.4] [Reference Citation Analysis (0)] |
| 13. | Kawaguchi K, Honda M, Yamashita T, Okada H, Shirasaki T, Nishikawa M, Nio K, Arai K, Sakai Y, Yamashita T. Jagged1 DNA Copy Number Variation Is Associated with Poor Outcome in Liver Cancer. Am J Pathol. 2016;186:2055-2067. [RCA] [PubMed] [DOI] [Full Text] [Cited by in Crossref: 13] [Cited by in RCA: 16] [Article Influence: 1.8] [Reference Citation Analysis (0)] |
| 14. | Villanueva A, Portela A, Sayols S, Battiston C, Hoshida Y, Méndez-González J, Imbeaud S, Letouzé E, Hernandez-Gea V, Cornella H. DNA methylation-based prognosis and epidrivers in hepatocellular carcinoma. Hepatology. 2015;61:1945-1956. [RCA] [PubMed] [DOI] [Full Text] [Full Text (PDF)] [Cited by in Crossref: 355] [Cited by in RCA: 324] [Article Influence: 32.4] [Reference Citation Analysis (0)] |
| 15. | Barry CT, D’Souza M, McCall M, Safadjou S, Ryan C, Kashyap R, Marroquin C, Orloff M, Almudevar A, Godfrey TE. Micro RNA expression profiles as adjunctive data to assess the risk of hepatocellular carcinoma recurrence after liver transplantation. Am J Transplant. 2012;12:428-437. [RCA] [PubMed] [DOI] [Full Text] [Cited by in Crossref: 41] [Cited by in RCA: 39] [Article Influence: 3.0] [Reference Citation Analysis (0)] |
| 16. | Tan GS, Lim KH, Tan HT, Khoo ML, Tan SH, Toh HC, Ching Ming Chung M. Novel proteomic biomarker panel for prediction of aggressive metastatic hepatocellular carcinoma relapse in surgically resectable patients. J Proteome Res. 2014;13:4833-4846. [RCA] [PubMed] [DOI] [Full Text] [Cited by in Crossref: 34] [Cited by in RCA: 37] [Article Influence: 3.4] [Reference Citation Analysis (0)] |
| 17. | Boulesteix AL, Sauerbrei W. Added predictive value of high-throughput molecular data to clinical data and its validation. Brief Bioinform. 2011;12:215-229. [RCA] [PubMed] [DOI] [Full Text] [Cited by in Crossref: 32] [Cited by in RCA: 32] [Article Influence: 2.3] [Reference Citation Analysis (0)] |
| 18. | Leuraud P, Aguirre-Cruz L, Hoang-Xuan K, Crinière E, Tanguy ML, Golmard JL, Kujas M, Delattre JY, Sanson M. Telomerase reactivation in malignant gliomas and loss of heterozygosity on 10p15.1. Neurology. 2003;60:1820-1822. [RCA] [PubMed] [DOI] [Full Text] [Cited by in Crossref: 4] [Cited by in RCA: 4] [Article Influence: 0.2] [Reference Citation Analysis (0)] |
| 19. | Hwang KT, Han W, Cho J, Lee JW, Ko E, Kim EK, Jung SY, Jeong EM, Bae JY, Kang JJ. Genomic copy number alterations as predictive markers of systemic recurrence in breast cancer. Int J Cancer. 2008;123:1807-1815. [RCA] [PubMed] [DOI] [Full Text] [Cited by in Crossref: 32] [Cited by in RCA: 36] [Article Influence: 2.1] [Reference Citation Analysis (0)] |
| 20. | Gilmore T, Gapuzan ME, Kalaitzidis D, Starczynowski D. Rel/NF-kappa B/I kappa B signal transduction in the generation and treatment of human cancer. Cancer Lett. 2002;181:1-9. [RCA] [PubMed] [DOI] [Full Text] [Cited by in Crossref: 78] [Cited by in RCA: 84] [Article Influence: 3.7] [Reference Citation Analysis (0)] |
| 21. | Dudderidge TJ, Stoeber K, Loddo M, Atkinson G, Fanshawe T, Griffiths DF, Williams GH. Mcm2, Geminin, and KI67 define proliferative state and are prognostic markers in renal cell carcinoma. Clin Cancer Res. 2005;11:2510-2517. [RCA] [PubMed] [DOI] [Full Text] [Cited by in Crossref: 116] [Cited by in RCA: 130] [Article Influence: 6.5] [Reference Citation Analysis (0)] |
| 22. | Calin GA, Croce CM. MicroRNA signatures in human cancers. Nat Rev Cancer. 2006;6:857-866. [RCA] [PubMed] [DOI] [Full Text] [Cited by in Crossref: 5705] [Cited by in RCA: 6030] [Article Influence: 317.4] [Reference Citation Analysis (0)] |
| 23. | Qian K, Mao B, Zhang W, Chen H. MicroRNA-561 inhibits gastric cancercell proliferation and invasion by downregulating c-Myc expression. Am J Transl Res. 2016;8:3802-3811. [PubMed] |
| 24. | Xue J, Chi Y, Chen Y, Huang S, Ye X, Niu J, Wang W, Pfeffer LM, Shao ZM, Wu ZH. MiRNA-621 sensitizes breast cancer to chemotherapy by suppressing FBXO11 and enhancing p53 activity. Oncogene. 2016;35:448-458. [RCA] [PubMed] [DOI] [Full Text] [Full Text (PDF)] [Cited by in Crossref: 74] [Cited by in RCA: 92] [Article Influence: 9.2] [Reference Citation Analysis (0)] |
| 25. | Chen C, Tian F, Lu L, Wang Y, Xiao Z, Yu C, Yu X. Characterization of Cep85 - a new antagonist of Nek2A that is involved in the regulation of centrosome disjunction. J Cell Sci. 2015;128:3290-3303. [RCA] [PubMed] [DOI] [Full Text] [Cited by in Crossref: 8] [Cited by in RCA: 14] [Article Influence: 1.4] [Reference Citation Analysis (0)] |
| 26. | Bonte D, Lindvall C, Liu H, Dykema K, Furge K, Weinreich M. Cdc7-Dbf4 kinase overexpression in multiple cancers and tumor cell lines is correlated with p53 inactivation. Neoplasia. 2008;10:920-931. [RCA] [PubMed] [DOI] [Full Text] [Cited by in Crossref: 90] [Cited by in RCA: 107] [Article Influence: 6.7] [Reference Citation Analysis (0)] |


