Copyright
©The Author(s) 2018.
World J Gastroenterol. Jul 28, 2018; 24(28): 3145-3154
Published online Jul 28, 2018. doi: 10.3748/wjg.v24.i28.3145
Published online Jul 28, 2018. doi: 10.3748/wjg.v24.i28.3145
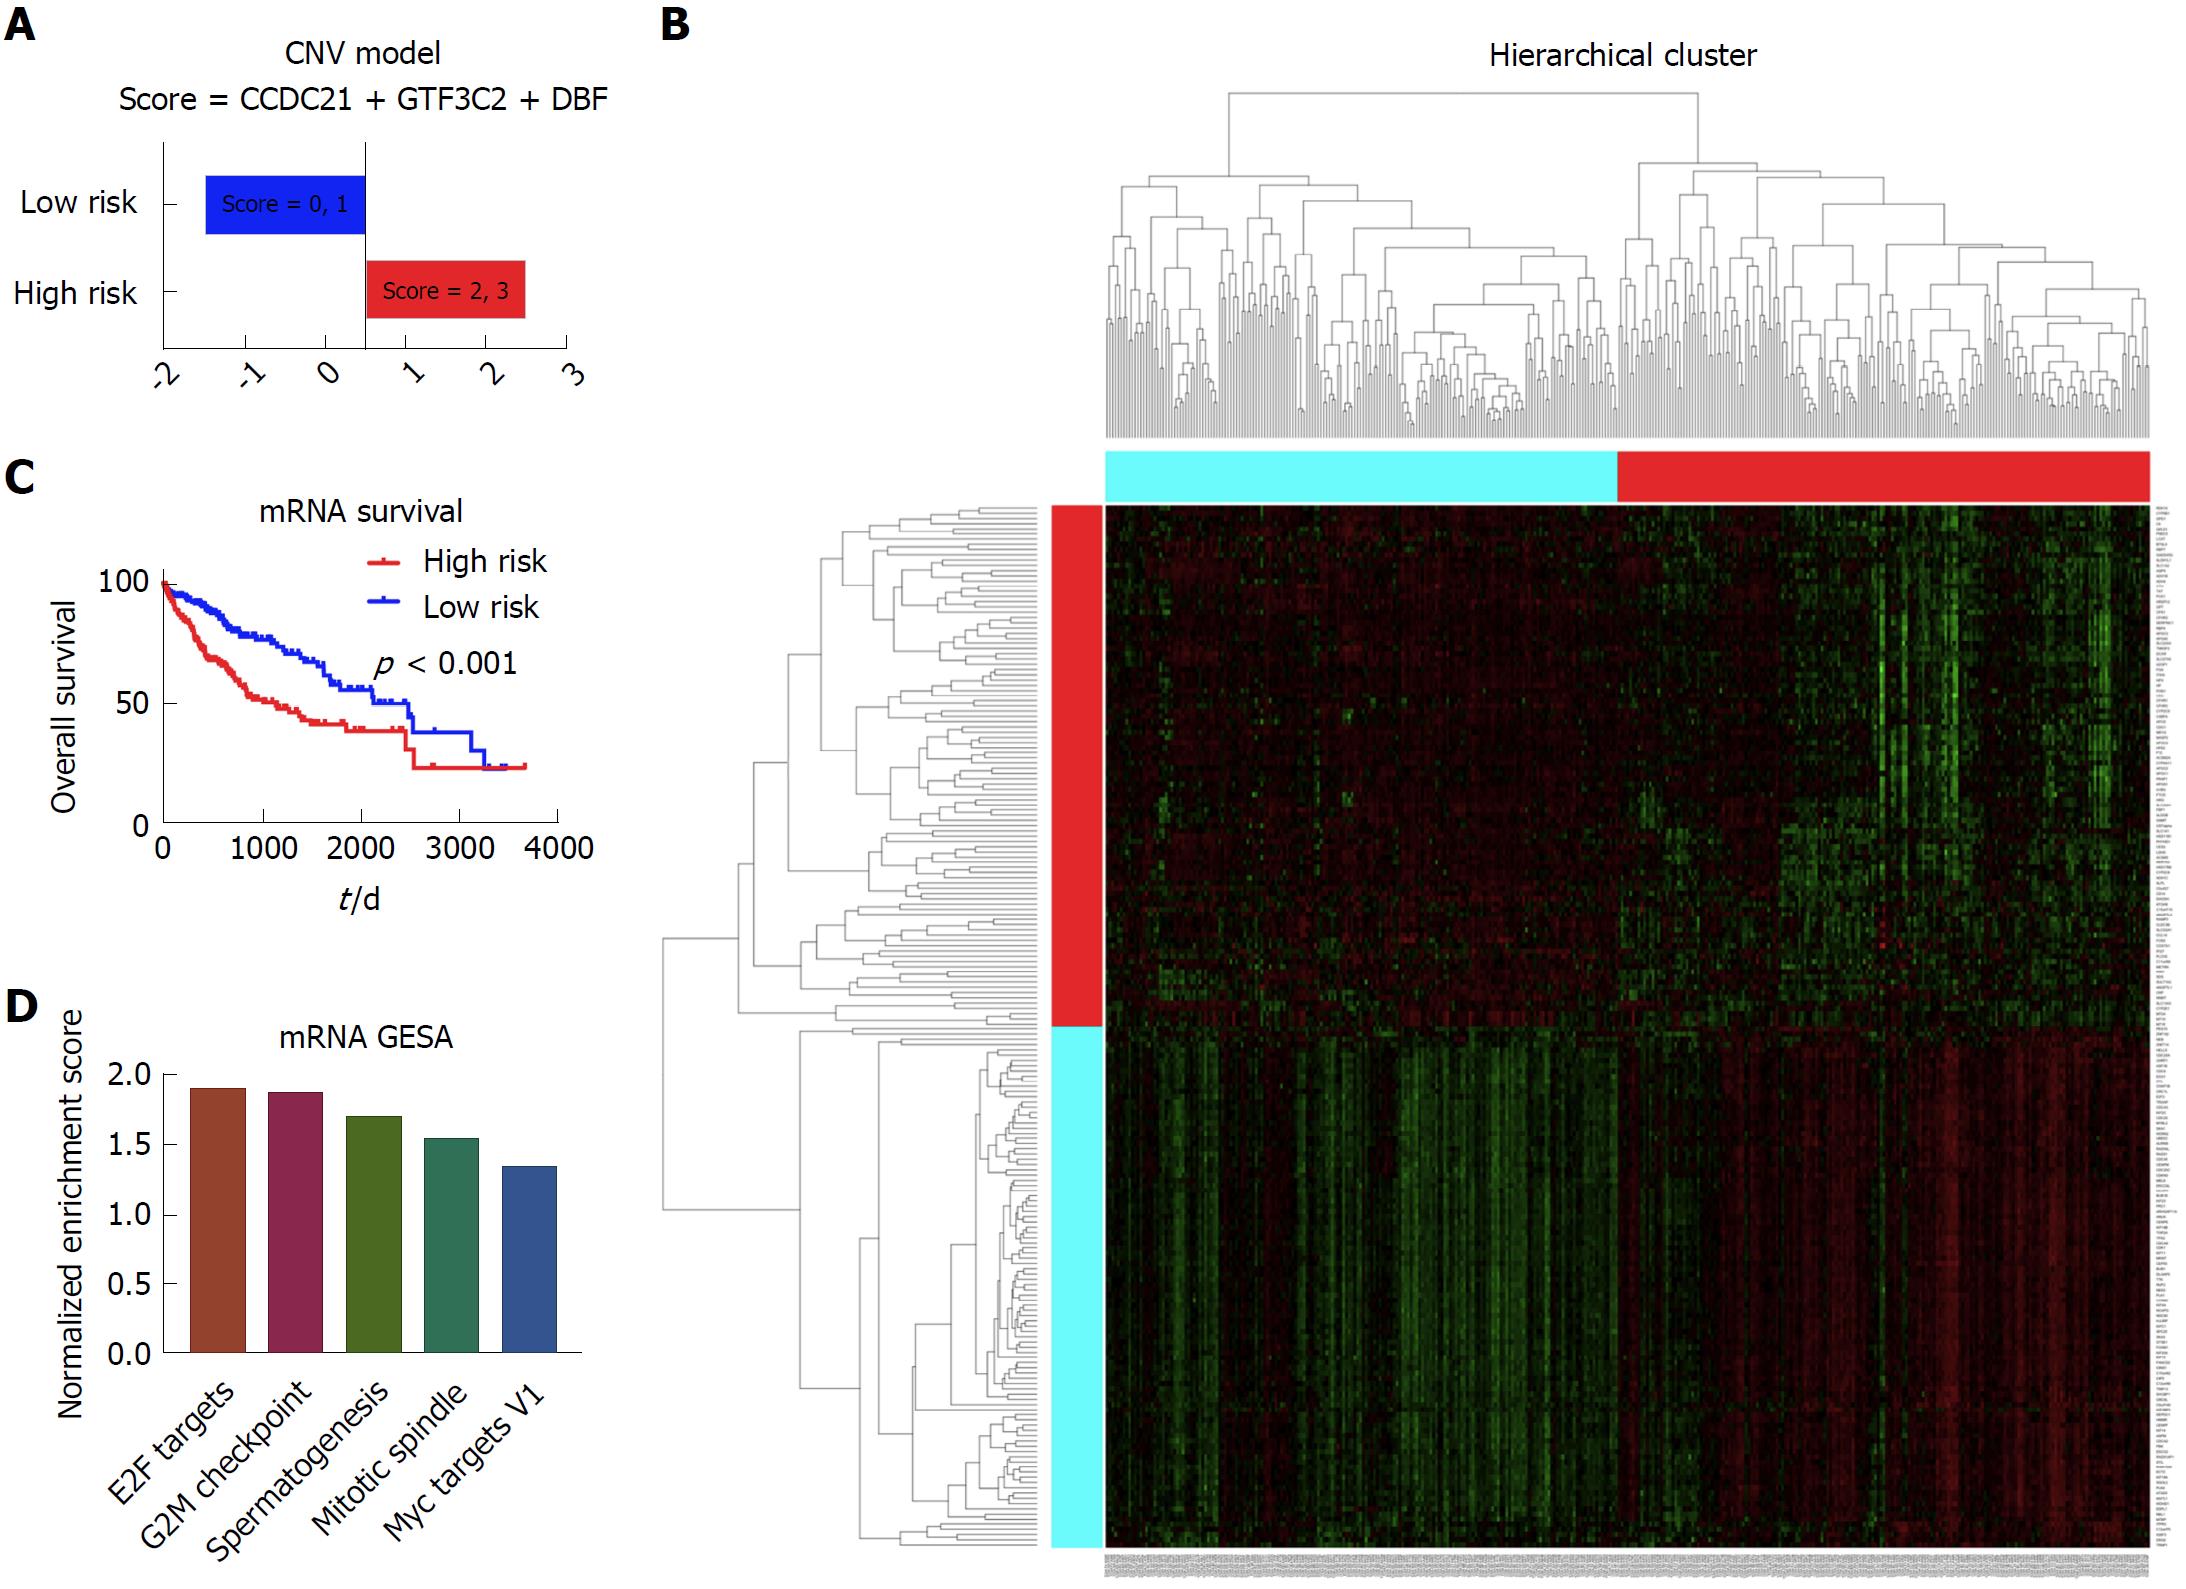
Figure 6 Establishment of the prognostic model based on the mRNA data.
A: The high risk group and low risk group based on the prognostic score. The patients with the score of 2 and 3 were considered as high risk, and patients with the score of 0 and 1 were considered as low risk; B: The Kaplan-Meier survival curves of the high risk group and low risk group, which showed that there was significant difference of survival between the high risk patients and low risk patients; C: The heatmap showing the different gene expression patterns of the high risk group and low risk group. It showed that the gene expression patterns of high risk group and low risk group were obviously distinct. D: The top enriched pathways in the high risk group, as indicated by the gene set enrichment analysis. It showed that the E2F targets, G2M checkpoint, spermatogenesis, mitotic spindle, and Myc targets V1 were significantly enriched in the high risk group patients.
- Citation: Song YZ, Li X, Li W, Wang Z, Li K, Xie FL, Zhang F. Integrated genomic analysis for prediction of survival for patients with liver cancer using The Cancer Genome Atlas. World J Gastroenterol 2018; 24(28): 3145-3154
- URL: https://www.wjgnet.com/1007-9327/full/v24/i28/3145.htm
- DOI: https://dx.doi.org/10.3748/wjg.v24.i28.3145


