Published online Jan 7, 2018. doi: 10.3748/wjg.v24.i1.23
Peer-review started: September 13, 2017
First decision: October 24, 2017
Revised: November 7, 2017
Accepted: November 27, 2017
Article in press: November 27, 2017
Published online: January 7, 2018
Processing time: 116 Days and 1 Hours
To explore the expression profiles of microRNAs (miRNAs), long non-coding RNAs (lncRNAs), and mRNAs in oesophageal squamous cell carcinoma (ESCC) in order to construct an oesophageal cancer-specific competing endogenous RNA (ceRNA) network.
In this work, the expression data of miRNAs, lncRNAs, and mRNAs in ESCC were obtained. An oesophageal cancer-specific ceRNA network was then constructed and investigated.
CeRNAs have the ability to reduce the targeting activity of miRNAs, leading to the de-repression of specific mRNAs with common miRNA response elements. CeRNA interactions have a critical effect in gene regulation and cancer development.
This study suggests a novel perspective on potential oesophageal cancer mechanisms as well as novel pathways for modulating ceRNA networks for treating cancers.
Core tip: Competing endogenous RNAs (ceRNAs) may play a critical role in tumourigenesis, and perturbations to ceRNA networks would result in the progression of oesophageal squamous cell carcinoma (ESCC). However, the role of ceRNAs in ESCC has not been comprehensively explored. This study was designed to investigate the expression profiles of microRNAs, long non-coding RNAs, and mRNAs in ESCC to elucidate an oesophageal cancer-specific ceRNA network. Our report reveals potential molecular mechanisms of oesophageal cancer progression and suggests a novel approach to cancer therapeutics in the regulation of ceRNA networks.
- Citation: Xue WH, Fan ZR, Li LF, Lu JL, Ma BJ, Kan QC, Zhao J. Construction of an oesophageal cancer-specific ceRNA network based on miRNA, lncRNA, and mRNA expression data. World J Gastroenterol 2018; 24(1): 23-34
- URL: https://www.wjgnet.com/1007-9327/full/v24/i1/23.htm
- DOI: https://dx.doi.org/10.3748/wjg.v24.i1.23
Oesophageal squamous cell carcinoma (ESCC) is the sixth leading death reason of cancer[1]. According to the official statistics in America, more than 18000 cases were newly diagnosed with 15000 deaths from oesophageal cancer in 2014, representing 5% of all cancer deaths[2]. Recently, the incidence and mortality rate of ESCC have decreased in North America and Europe[3]. However, ESCC has a significant ethnic and geographic distribution and it has been highly prevalent in China and other Asia countries. The presence of familial aggregation suggests that the risk factors for ESCC include environmental and genetic factors[4]. When ESCC is diagnosed, most patients have already progressed to be advanced or metastatic. Thus, as there is no longer an opportunity for radical surgery, radiation and chemotherapy become the major palliative treatments[5].
Tumourigenesis and cancer development have been closely associated with the aberrant expression of protein coding mRNAs and non-coding RNAs[6]. Approximately 98% of the human genome are non-coding RNAs, suggesting their promising effects on physiological and pathological processes[7]. MicroRNAs (miRNAs) suppress the translation and induces the degradation of mRNA, thus modulating gene expression and function[8]. MiRNAs have been proved to have critical effects in tumourigenesis, and the role of miRNAs has been relatively well understood[9]. Long non-coding RNAs (lncRNAs) are newly found non-coding RNAs which were proved to participate in many diseases[10]. However, the functional role of the large number of lncRNAs in ESCC remains unclear.
Many studies have confirmed that competing endogenous RNAs (ceRNAs) are able to act as sponges for miRNAs. The activity of miRNAs could be modulated with the variation of ceRNA abundance from individual genes[11]. Interactions between ceRNAs through sharing miRNAs indicate a new pathway of gene regulation, which has key effects in the cancer progression[12-14]. CeRNAs act as molecular sponges of miRNAs through binding with miRNAs (also known as miRNA response elements, MRE), thus inhibiting miRNA targeted genes[15]. The discovery of ceRNAs requires reassessing our understanding of gene regulatory networks and raising the probability of proposing a new molecular mechanism. Both of them may be the potential targets for gene treatment[16-18].
Lately, complex and multidimensional molecular maps of large cancer crowd were uncovered by research alliance such as The Cancer Genome Atlas (TCGA). With these information, a synthetic analysis could be performed on the association between molecular alterations and certain cancer type[19-21]. Many ceRNAs were revealed in various cancer types. Until now, few studies have been performed on clarifying the association among lncRNAs, miRNAs, and mRNAs in ESCC. Therefore, in this study, a ceRNA network in ESCC was constructed, which may help to elucidate the specific biological mechanisms of ESCC progression.
The expression data of miRNAs and mRNAs in 101 oesophageal cancer patients were collected from the National Center for Biotechnology Information Gene Expression Omnibus (NCBI) with login numbers of GSE45670[22] (38 patients, http://www.ncbi.nlm.nih.gov/geo/query/acc.cgi?acc=GSE45670), GSE26886[23] (28 patients, http://www.ncbi.nlm.nih.Gov/geo/query/acc.cgi?acc=GSE26886), GSE17351 (10 samples, http://www.ncbi.nlm.nih.gov/geo/query/acc.cgi?acc=GSE17351), GSE55856[24] (216 patients, http://www.ncbi.nlm.nih.gov/geo/query/acc.cgi?acc=GSE55856), and GSE66274[25] (60 patients, http://www.ncbi.nlm.nih.Gov/geo/query/acc.cgi?acc=GSE66274). Various miRNA targets and oesophageal cancer data sets were also applied for assessing the reliability of this approach, aimed to construct a ceRNA network. Under these circumstances, we also implanted the expression profiles of 170 matched miRNAs and mRNAs in oesophageal cancer patients from TCGA[26]. Annotation information of lncRNAs was obtained with Affymetrix Human Genome U133 Plus 2.0 arrays. The network of protein-protein interactions was constructed using STRING database system.
DAVID (Databases for Annotation, Visualization and Integrated Discovery) was included to determine the pathways of KEGG (Kyoto Encyclopedia of Genes and Genomes) and Gene Ontology (GO) Term biological processes were enriched with central genes recommunities in the ceRNA network. P values < 0.05 indicated enriched gene sets[27].
The miRNA-lncRNA-mRNA interaction network was visualised with Cytoscape Software, and topology analysis was performed with network analyser plugin. MCODE plugin was also applied (with its default parameters) to figure out the communities (dense clusters) in the network[28].
The single-stranded miRNAs would bind the mRNA transcripts, thus the post-transcriptional regulation of mRNA has been set up according to the relationships among miRNAs, lncRNAs, and mRNAs[29,30]. First, the miRNAs, lncRNAs, and mRNAs which were differentially expressed between ESCC specimens and corresponding normal tissues were chosen. The differential expression of miRNAs, lncRNAs, and mRNAs was identified with standard selection criteria, which were set at P < 0.05 and fold change > 2. In addition, the co-expression network of miRNAs, lncRNAs, and mRNAs was constructed according to the connections among the differentially expressed miRNAs, lncRNAs, and mRNAs.
Data are expressed as the mean ± SD. Student’s t-test and analysis of variance were applied in the statistical analysis for comparing results of two groups and multiple groups, respectively[31]. The fold change and Student’s t-test were applied to analyse the significance of microarray analysis. P < 0.05 indicated a statistically significant difference. P value was corrected with false discovery rate. The differentially expressed lncRNAs, miRNAs, and mRNAs are expressed as fold change values (P < 0.05).
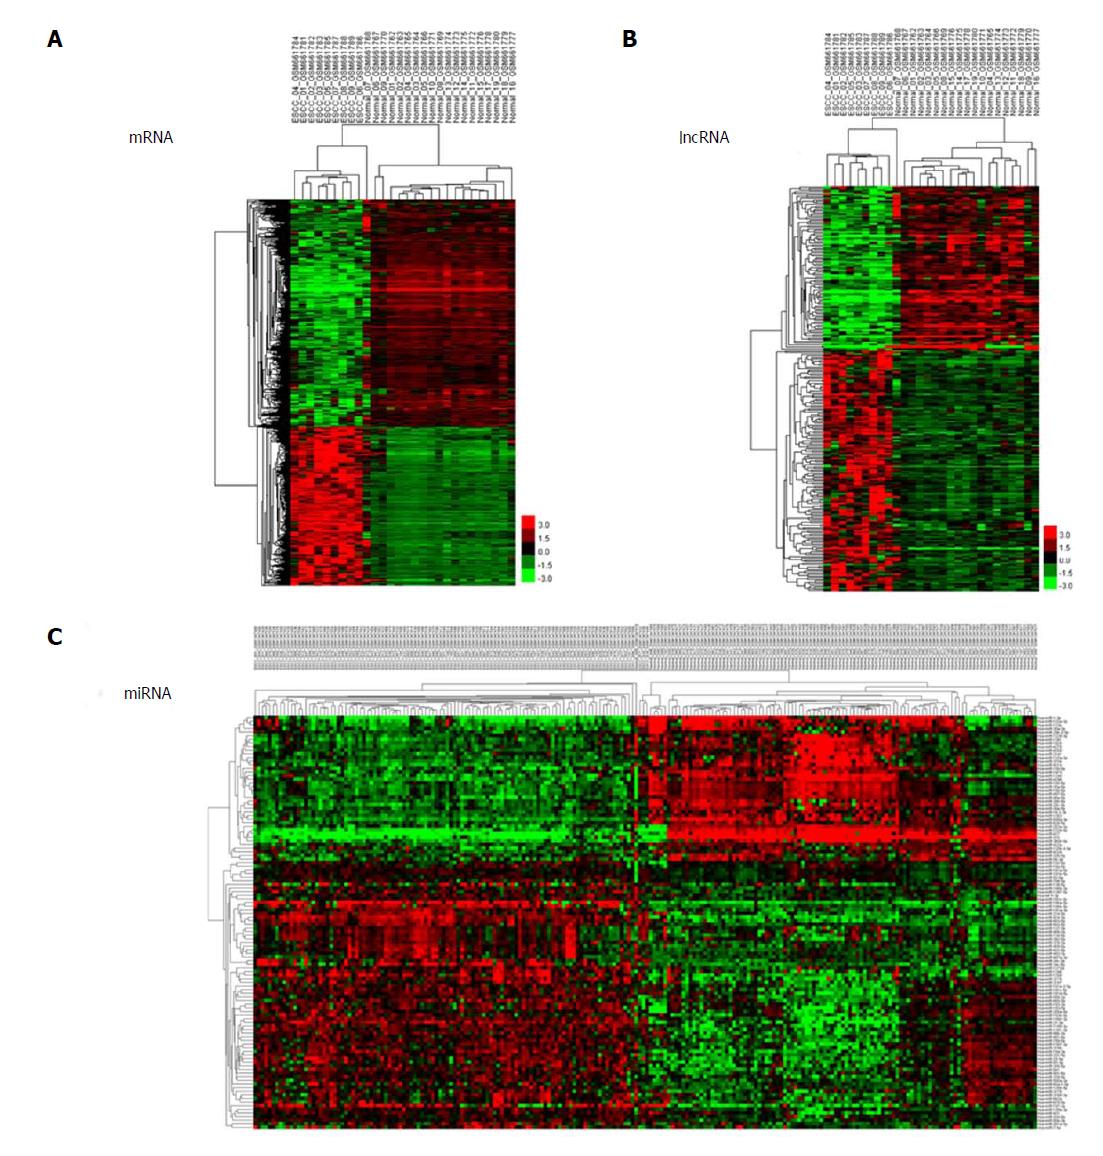
We used unsupervised hierarchical clustering analysis in this study. Cases were organized by clustering analysis on the basis of immunostaining profiles, and cases were placed together with similar immune profiles as neighbouring rows in a clustergram. The dendrogram was applied to demonstrate the relationship among cases and immune markers. The branch length of dendrogram indicated the correlations in immunostaining results. The unsupervised hierarchical cluster analysis demonstrated the correlation of expression maps between biological replicates and group conditions (Figure 1A-C).
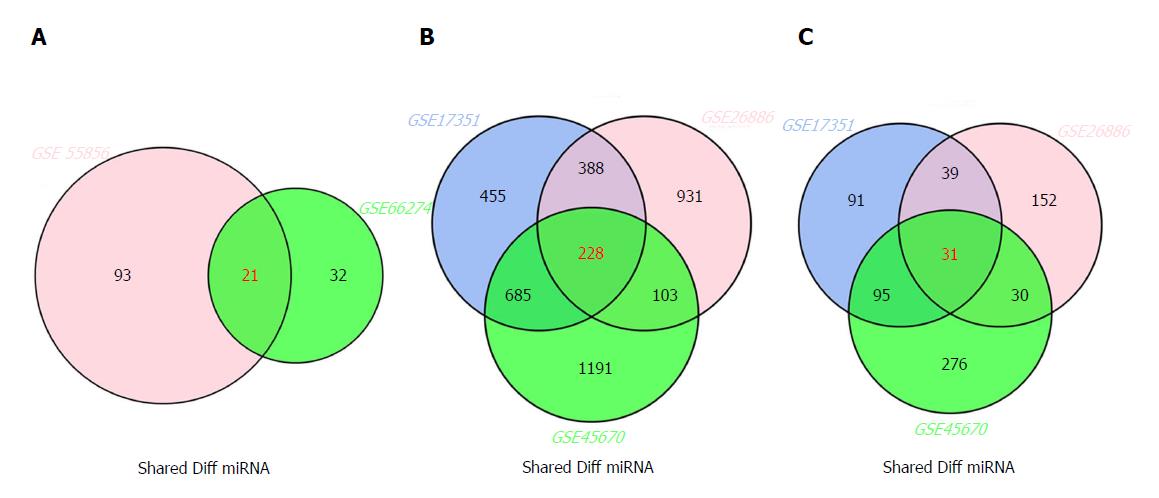
The inter-connected complexity of physiological, cellular, and molecular functions has increasingly grown, thus novel approaches are required to simultaneously demonstrate multiple datasets[32]. There are multiple intersecting regions (generally as circles) in Venn diagram, which enables the description of all logical relations among various data sets[33]. Here, we selected 21 miRNAs from GSE66274 and GSE55856; 228 mRNAs from GSE26886, GSE17351, and GSE45670; and 31 lncRNAs from GSE26886, GSE17351, and GSE45670 (Figure 2A-C).
In the GO database, there are structured, controlled vocabularies and classifications covering several molecular and cellular biology domains. GO has been applied for the annotation of genes and sequences[34].
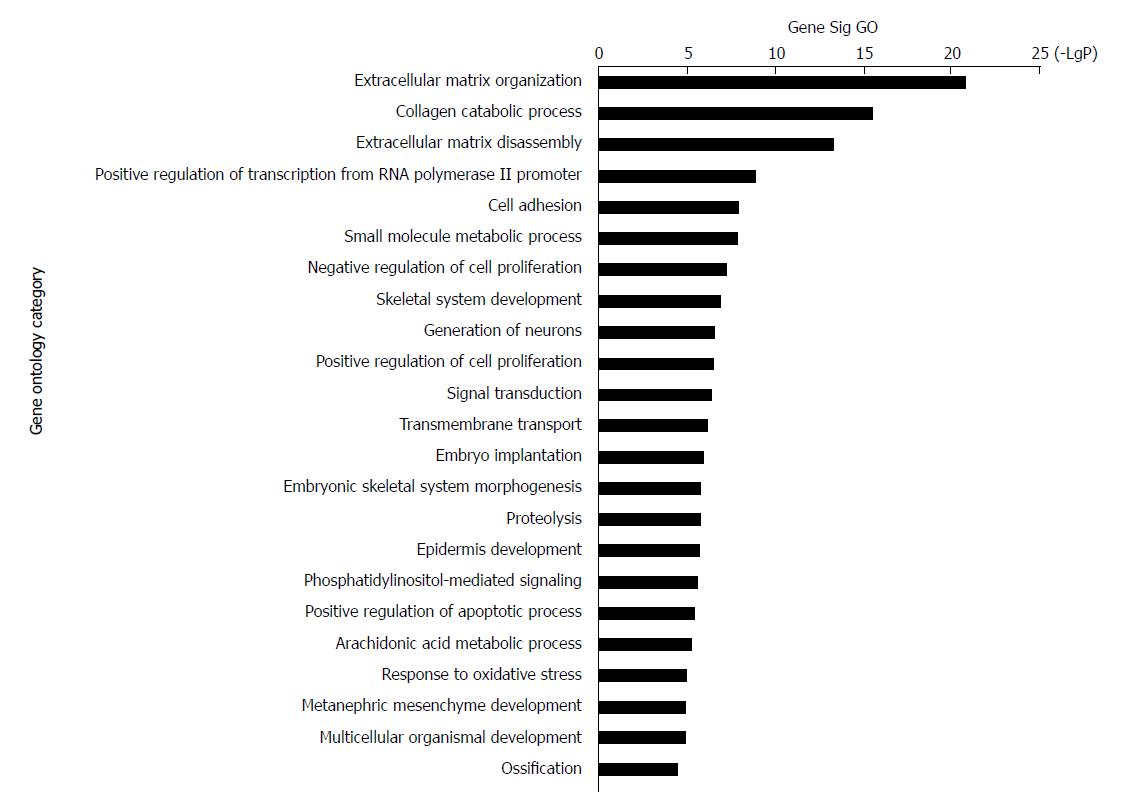
The 228 genes with differential expression were analysed with the GO database. The enrichment of these genes was analysed in specific pathways. Enrichment analysis is used to evaluate the significance of the function, which helps provide GO terms with a more definitive function demonstration[35]. As shown in Table 1, the most highly enriched GO path was ‘extracellular matrix organization’. The genes in ‘extracellular matrix organization’ path were MMP3, MMP10, LAMA3, MMP9, MMP13, COL11A1, BMP7, MMP12, LAMC2, COL27A1, ITGB4, PDGFRA, ADAMTS2, IBSP, COL10A1, COL7A1, MMP11, MFAP2, MMP1, and COL1A1. The second most highly enriched GO path was ‘collagen catabolic process’ (Figure 3).
| Goid | GO name | GO diffgene count | GO gene count | Enrichment | P value | FDR |
| GO:0030198 | Extracellular matrix organization | 20 | 210 | 25.11013216 | 1.54276E-21 | 1.68623E-18 |
| GO:0030574 | Collagen catabolic process | 12 | 72 | 43.94273128 | 3.32314E-16 | 1.8161E-13 |
| GO:0022617 | Extracellular matrix disassembly | 11 | 79 | 36.71164892 | 5.27621E-14 | 1.9223E-11 |
| GO:0045944 | Positive regulation of transcription | 18 | 708 | 6.7031285 | 1.3435E-09 | 3.6711E-07 |
| GO:0007155 | Cell adhesion | 14 | 454 | 8.130373188 | 1.16162E-08 | 2.30356E-06 |
| GO:0044281 | Small molecule metabolic process | 23 | 1363 | 4.449080643 | 1.26454E-08 | 2.30356E-06 |
| GO:0008285 | Negative regulation of cell prolifer | 12 | 358 | 8.837644279 | 6.42989E-08 | 1.00398E-05 |
| GO:0001501 | Skeletal system development | 8 | 127 | 16.60827639 | 1.37682E-07 | 1.88108E-05 |
| GO:0048699 | Generation of neurons | 4 | 11 | 95.87505006 | 2.60527E-07 | 3.16396E-05 |
| GO:0008284 | Positive regulation of cell prolifera | 12 | 411 | 7.69799672 | 2.89703E-07 | 3.16645E-05 |
| GO:0007165 | Signal transduction | 18 | 1030 | 4.607587357 | 4.19668E-07 | 4.16997E-05 |
| GO:0055085 | Transmembrane transport transmembrane transport | 13 | 538 | 6.370879256 | 7.27191E-07 | 6.6235E-05 |
| GO:0007566 | Embryo implantation | 5 | 37 | 35.62924158 | 1.18601E-06 | 9.97159E-05 |
| GO:0048704 | Embryonic skeletal system morph | 5 | 40 | 32.95704846 | 1.77383E-06 | 0.000131776 |
| GO:0006508 | Proteolysis | 12 | 488 | 6.483353795 | 1.80845E-06 | 0.000131776 |
| GO:0008544 | Epidermis development | 6 | 76 | 20.81497797 | 1.95203E-06 | 0.000133348 |
| GO:0048015 | Phosphatidylinositol-mediated sign | 7 | 129 | 14.30693576 | 2.77867E-06 | 0.000178652 |
| GO:0043065 | Positive regulation of apoptotic pr | 8 | 197 | 10.70685838 | 3.9876E-06 | 0.000242136 |
| GO:0019369 | Arachidonic acid metabolic process | 5 | 50 | 26.36563877 | 5.53803E-06 | 0.000318583 |
| GO:0006979 | Response to oxidative stress | 6 | 101 | 15.6627557 | 1.04573E-05 | 0.000571494 |
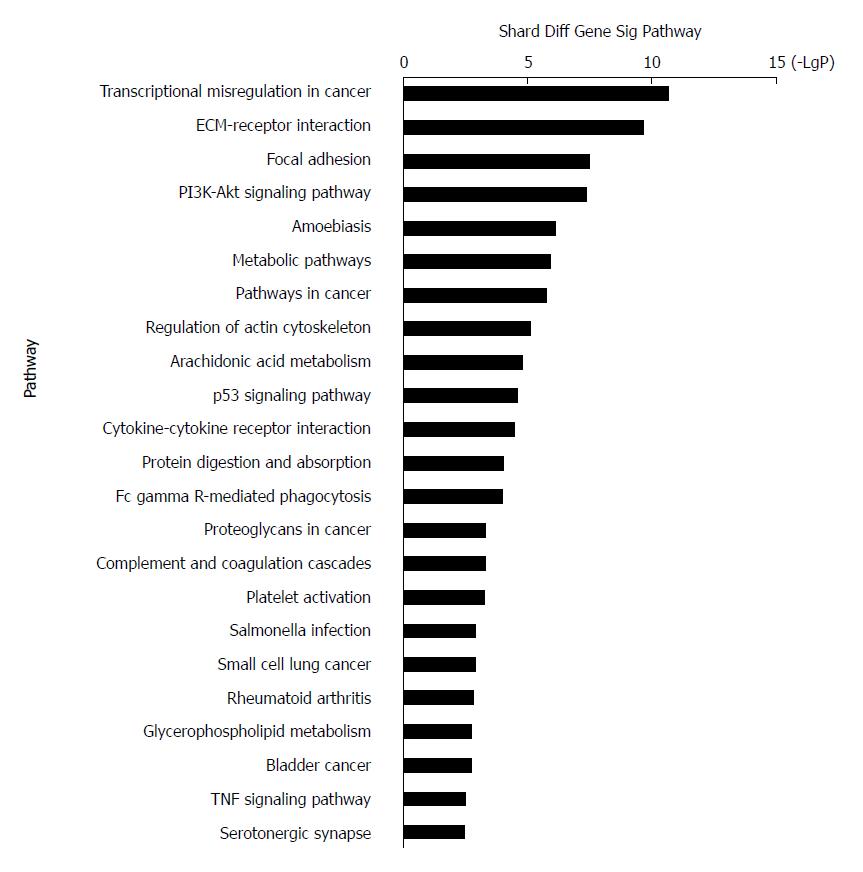
KEGG systematically interprets sequence data by computerizing biochemical pathways and other types of molecular interactions[36-38]. The results showed that the most highly enriched pathway was ‘transcriptional misregulation in cancer’ (Table 2). The genes in ‘transcriptional misregulation in cancer’ pathway were TCF3, CXCL8, SIX1, IGFBP3, MLF1, PLAU, MEIS1, HOXA10, MMP9, SIX4, HPGD, and MMP3. The second most highly enriched pathway was ‘ECM-receptor interaction’ (Figure 4). The genes in ‘ECM-receptor interaction’ pathway were ITGB4, COL1A1, COL11A1, ITGA3, LAMC2, SPP1, LAMB3, and IBSP.
| Path_id | Path_name | Path_diffgene_count | Path_gene_count | Enrichment | P value | FDR |
| 05202 | Transcriptional misregulation in cancer | 12 | 179 | 17.67528856 | 2.34961E-11 | 3.94734E-09 |
| 04512 | ECM-receptor interaction | 9 | 87 | 27.27479872 | 2.19839E-10 | 1.84664E-08 |
| 04510 | Focal adhesion | 10 | 207 | 12.73702356 | 3.3619E-08 | 1.79605E-06 |
| 04151 | PI3K-Akt signalling pathway | 12 | 345 | 9.170656962 | 4.27632E-08 | 1.79605E-06 |
| 05146 | Amoebiasis | 7 | 108 | 17.08883994 | 8.29201E-07 | 2.78612E-05 |
| 01100 | Metabolic pathways | 19 | 1234 | 4.059539194 | 1.27125E-06 | 3.5595E-05 |
| 05200 | Pathways in cancer | 11 | 397 | 7.305340716 | 1.71545E-06 | 4.11707E-05 |
| 04810 | Regulation of actin cytoskeleton | 8 | 214 | 9.856313558 | 7.4028E-06 | 0.000155459 |
| 00590 | Arachidonic acid metabolism | 5 | 62 | 21.26261191 | 1.62994E-05 | 0.000304255 |
| 04115 | p53 signalling pathway | 5 | 68 | 19.38649909 | 2.57756E-05 | 0.00043303 |
| 04060 | Cytokine-cytokine receptor interaction | 8 | 265 | 7.959438118 | 3.5607E-05 | 0.000543816 |
| 04974 | Protein digestion and absorption | 5 | 90 | 14.64757709 | 0.000101556 | 0.001421784 |
| 04666 | Fc gamma R-mediated phagocytosis | 5 | 92 | 14.3291515 | 0.000112939 | 0.001459525 |
| 05205 | Proteoglycans in cancer | 6 | 203 | 7.792799635 | 0.000540094 | 0.006142299 |
| 04610 | Complement and coagulationcasc | 4 | 69 | 15.28442827 | 0.000574387 | 0.006142299 |
| 04611 | Platelet activation | 5 | 130 | 10.14063029 | 0.000584981 | 0.006142299 |
| 05132 | Salmonella infection | 4 | 86 | 12.2630878 | 0.001341668 | 0.01252223 |
| 05222 | Small cell lung cancer | 4 | 86 | 12.2630878 | 0.001341668 | 0.01252223 |
| 05323 | Rheumatoid arthritis | 4 | 89 | 11.84972529 | 0.001529001 | 0.01351959 |
| 00564 | Glycerophospholipid metabolism | 4 | 95 | 11.10132159 | 0.001958567 | 0.016451962 |
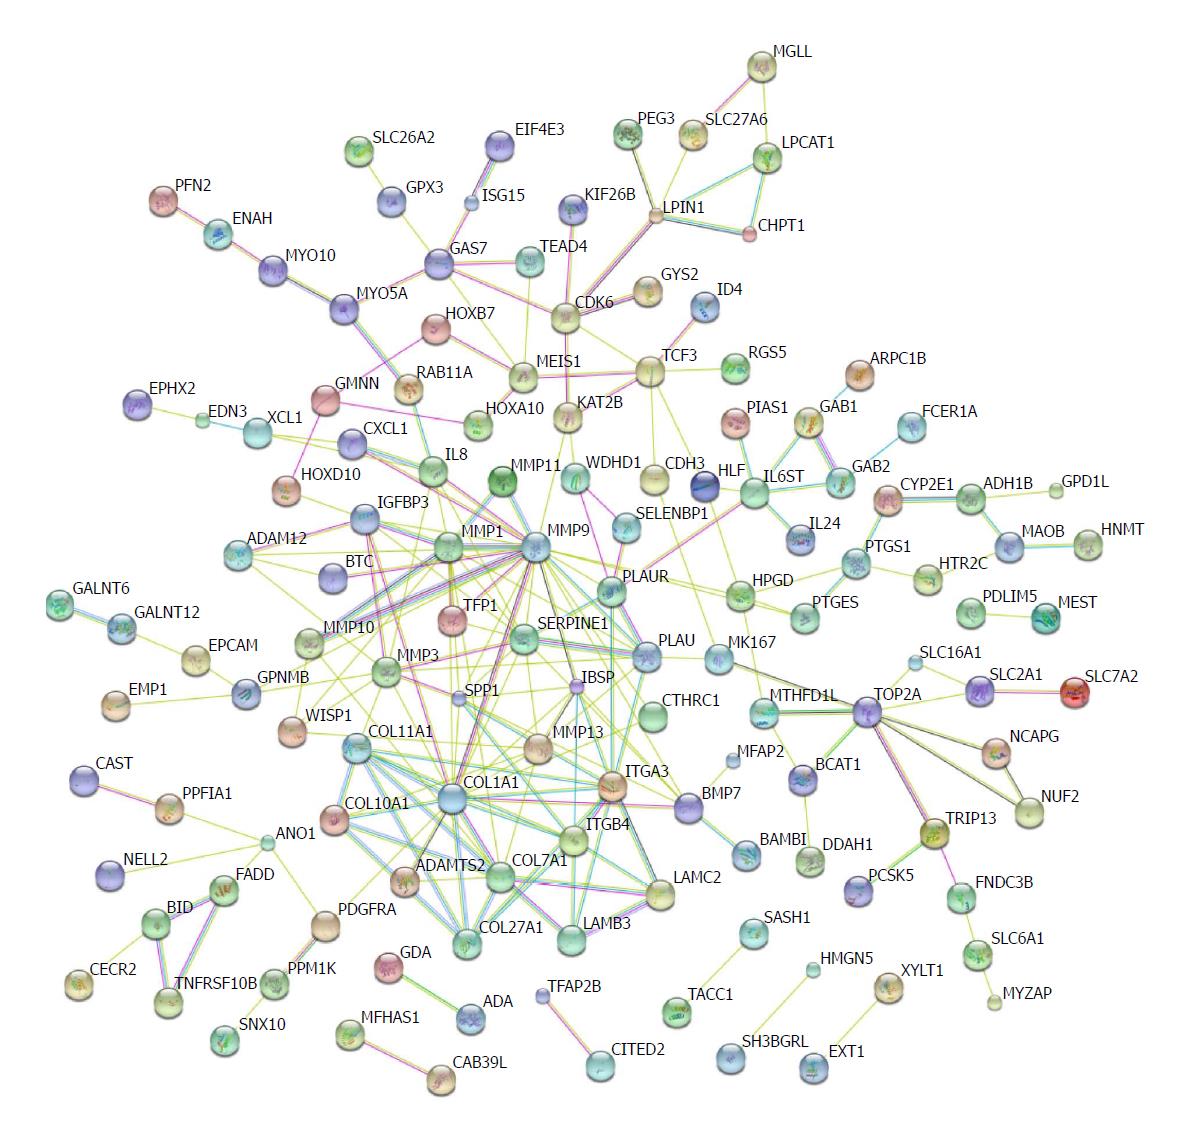
Protein-protein interactions have been not only direct binding, but also indirect actions[39]. Genomic associations between protein-coding genes are provided for interring functional links between proteins. Genes that have the same function are often located in close to each other and tend to participate in gene-fusion events[40-42]. The database STRING has been used to analyse these associations[43]. We input the shared differential mRNAs from GSE45670, GSE26886, and GSE17351 into the STRING database. Several nodes with high degrees were COL27A1, COL7A1, COL1A1, ITGB4, ITGA3, SERPINE1, MMP1, MMP9, and MMP10 (Figure 5).
CeRNAs share common MRE and hence regulate RNA transcripts by competitively binding with general miRNA molecules[44]. CeRNAs could be relieved from miRNA-mediated repression and their expression levels could be positively modulated[45]. The discovery of ceRNAs provides many implications for cancer, which have already been extensively discussed[46].
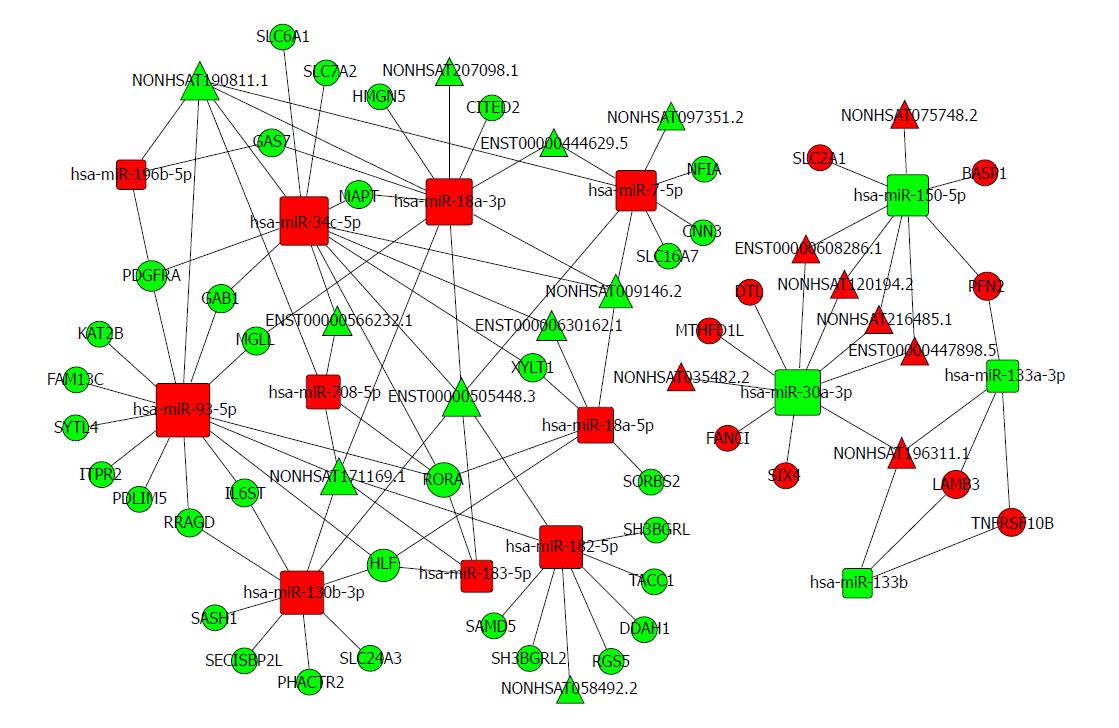
Based on the expression profiles of specific miRNAs, lncRNAs, and mRNAs in patients with oesophageal cancer, a ceRNA network was constructed using a computational method proposed for this study (Figure 6) and it was drawn with Cytoscape 3.0[47]. The ceRNA network has integrated the miRNA-lncRNA-mRNA interactions by negative regulation.
There are 74 nodes in the oesophageal cancer-specific ceRNA network. The degrees of the hsa-miR-93-5p, hsa-miR-34c-5p, and hsa-miR-18a-3p nodes were 14, 12, and 11, respectively. The density of our ceRNA network was confirmed with the high degree of nodes, suggesting common competitions among RNAs for oesophageal cancer. The modes degree was also observed to follow power law distribution. For miRNAs, the expression of hsa-miR-196b-5p, has-miR-34c-5p, and has-miR-18a-3p were up-regulated. However, the expression levels were down-regulated for has-miR-30a-3p, has-miR-150-5p, and has-miR-133a-3p. All these analysis results suggest the scale-free ceRNA network in oesophageal cancer and the biological significance may be reflected by the topological structures including the hubs, nodes, and communities.
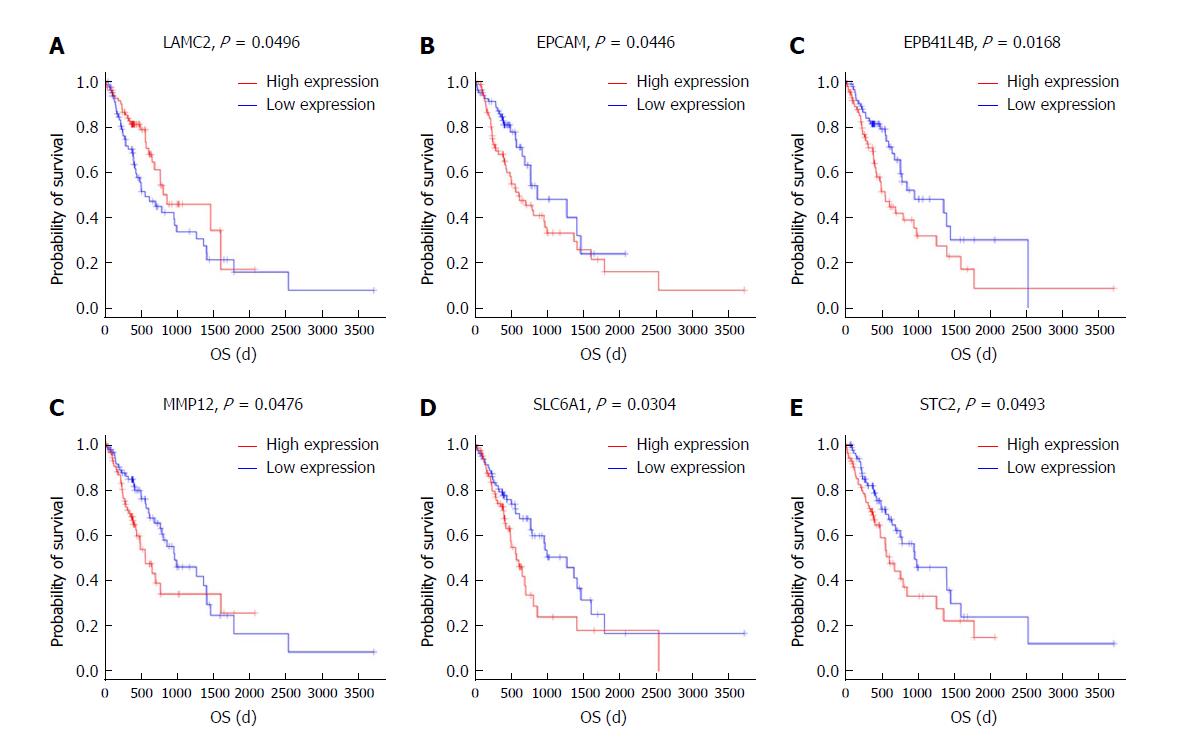
To further identify the key mRNAs that were associated with prognostic characteristics in 170 ESCC patients, the overall survival was profiled with the univariate Cox proportional hazards regression model (P < 0.05). Among the six significant mRNAs, the overall survival was negatively related to five mRNA transcripts (STC2, SLC6A1, MMP12, EPCAM, and EPB411L4B) (P < 0.05) while positively associated with the remaining mRNA transcript (LAMC2) (P < 0.05) (Figure 7A-F).
It is necessary to explore ceRNA cross-talk across multiple cancer types[48]. TCGA was formed to meet these needs and its vast data sets provide us with an unprecedented opportunity to systematically analyse the ceRNA network in cancer. These interesting findings led us to construct an oesophageal cancer-specific ceRNA network.
In this work, clustering analysis, mRNA GO analysis, mRNA pathway analysis, and protein regulation network analysis in ESCC were conducted to construct the ceRNA network. The results showed that the most highly enriched GO path was ‘extracellular matrix organization’. The genes in ‘extracellular matrix organization’ path were MMP3, MMP10, LAMA3, MMP9, MMP13, COL11A1, BMP7, MMP12, LAMC2, COL27A1, ITGB4, PDGFRA, ADAMTS2, IBSP, COL10A1, COL7A1, MMP11, MFAP2, MMP1, and COL1A1. Advances in structural genomics will make it possible to reveal the complete genome sequence of hundreds of organisms. The ceRNA network analysis indicated that the degree of has-miR-93-5p as an up-regulated gene was 14. All these results are relevant to the further development of treatments for oesophageal cancer.
Based on Kaplan-Meier analysis, overall survival was negatively related to five mRNA transcripts (STC2, SLC6A1, MMP12, EPCAM, and EPB41L4B) (P < 0.05) and it was positively associated with the remaining mRNA transcript (LAMC2) (P < 0.05). These mRNAs could be candidate and specific biomarkers for the diagnosis, prognosis, and classification of ESCC.
In this research, a computational approach has been proposed for the construction of ceRNA network based on existing data of esophageal cancer. In this network, the junction nodes indicate paired gene pair in competing mRNA library. We observed that the ESCC-specific ceRNA network is scale-free, and the dense clusters in the network are associated with promising markers. The results of mRNA pathway analysis showed that the most highly enriched pathway was transcriptional misregulation in cancer. In addition, overall survival was negatively related to the genes STC2, SLC6A1, MMP12, EPCAM, and EPB41L4B, while it was positively associated with LAMC2. These confirmed results suggested that the biological mechanism of ESCC could be discovered with the constructed ceRNA network. Importantly, a simple framework has been provided in our work for the construction of a ceRNA network, which can be used to a variety of biological issues, such as ESCC and its biological processes. In short, cancer-specific miRNAs, lncRNAs, and mRNAs in ESCC can be successfully identified in the present study by bioinformatics analysis from large scale samples. Moreover, understanding the ceRNA network in ESCC may reveal potential intended targets for cancer sub-populations or across cancers. This work suggests new approaches for studying the role and mechanism of ceRNAs in human cancers using publicly available genomic data.
Oesophageal squamous cell carcinoma (ESCC) is one of the most prevalent forms of oesophageal cancer, and its development is closely related to the abnormal expression of not only protein-encoding mRNAs, but also non-coding RNAs. Competitive endogenous RNAs (ceRNAs) regulatory networks include mRNAs, miRNAs, lncRNAs, and circular RNAs, which participate in the cancer pathogenesis by regulating each other’s expression. However, their function has not been clarified in ESCC. Therefore, construction of a ceRNA network for ESCC may help to study the biological mechanisms of this malignancy.
It is necessary to explore the CeRNA cross-talk across multiple cancer types. These issues have been addressed by TCGA, which provides large data sets enabling us with an unprecedented opportunity to synthetically explore the ceRNA network for various cancers. These findings led us to construct an oesophageal cancer-specific ceRNA network. The present study found that there were mRNAs, miRNAs, and lncRNAs in the ceRNA regulatory network, which might play a critical role in ESCC, and the abnormality in ceRNA regulatory networks would lead to the initiation and progression of ESCC.
Clustering analysis, mRNA GO analysis, mRNA pathway analysis, and protein regulation network analysis in oesophageal squamous cell carcinoma were conducted to construct a ceRNA network. These confirmed results suggested that the biological mechanisms in the development of ESCC may be indeed associated with the ceRNA network. Importantly, a simple framework was proposed in this study for constructing ceRNA networks in various biological processes including the study on ESCC.
The expression data of miRNAs and mRNAs in 101 patients with esophageal cancer were obtained from the National Center for Biotechnology Information Gene Expression (NCBI). The expression profiles of 170 matched miRNAs and mRNAs in esophageal cancer patients were also obtained from TCGA (The Cancer Genome Atlas). The KEGG pathway and GO Term biological processes were identified with DAVID. The results were drawn with Cytoscape software, and were topologically analysed by Cytoscape’s network analyzer plugin. In addition, communities (dense clusters) in the network was found with Cycloscape, using the MCODE plug-in (the default). Based on the relationship between miRNAs, lncRNAs, and mRNAs, strands of stranded miRNAs have been established following transcriptional regulation of single nucleotide sequence-associated mRNA transcripts.
The results showed that the most highly enriched Gene Ontology path was ‘extracellular matrix organization’. The genes in ‘extracellular matrix organization’ path were MMP3, MMP10, LAMA3, MMP9, MMP13, COL11A1, BMP7, MMP12, LAMC2, COL27A1, ITGB4, PDGFRA, ADAMTS2, IBSP, COL10A1, COL7A1, MMP11, MFAP2, MMP1, and COL1A1. The advances in structural genomics may reveal the complete genomic sequence of thousands of organisms. The ceRNA network analysis indicated that the degree of has-miR-93-5p as an up-regulated gene was 14. All these results are meaningful for further development of treatments for oesophageal cancer. The overall survival was negatively associated with five mRNAs (STC2, SLC6A1, MMP12, EPCAM, and EPB41L4B), and it was positively related to the remaining mRNA (LAMC2). These mRNAs can be applied as promising specific biomarkers for ESCC. The significantly dysregulated mRNAs and miRNAs need to be validated in the future.
A ceRNA network was identified in ESCC. The overall survival was negatively related to five mRNAs (STC2, SLC6A1, MMP12, EPCAM, and EPB41L4B). The ceRNA network has a significant effect in gene regulation and cancer development in ESCC. This study provides potential mechanisms for the development of oesophageal cancer and suggests new methods to modulate ceRNA networks for cancer treatment. CeRNA networks are implicated in the development of ESCC. A relationship between lncRNAs, miRNAs, and mRNAs in oesophageal squamous cell carcinoma was constructed by bioinformatics analysis. Cytoscape software showed the miRNA-lncRNA-mRNA interaction network and the Cytoscape network analyzer plug-in was used for topology analysis. In addition, the communities (dense clusters) in the network were found with the MCODE plug-in (with the default parameters). The bioinformatics analysis was performed on the co-expression of lncRNAs, miRNA, and mRNAs. The results showed that the most highly enriched GO path was ‘extracellular matrix organization’, which was associated with ESCC. By examining the ceRNA network, the node degrees were observed to follow a power law distribution. The expression of hsa-miR-196b-5p, has-miR-34c-5p, and has-miR-18a-3p was up-regulated. However, the levels of has-miR-30a-3p, has-miR-150-5p, and has-miR-133a-3p were down-regulated. The ceRNA network is associated with cancer progression. The understanding of ceRNA networks in ESCC may help uncover unexpected potential therapeutic targets that would be available in cancer sub-populations or across cancers.
Understanding the ceRNA network is of significance in identifying potential therapeutic targets for ESCC. Our study focuses on the function and mechanism of ceRNAs in ESCC using publicly available genomic data.
Manuscript source: Unsolicited manuscript
Specialty type: Gastroenterology and hepatology
Country of origin: China
Peer-review report classification
Grade A (Excellent): 0
Grade B (Very good): 0
Grade C (Good): C
Grade D (Fair): D
Grade E (Poor): 0
P- Reviewer: DincT, Ono T S- Editor: Chen K L- Editor: Wang TQ E- Editor: Huang Y
| 1. | Chen J, Kwong DL, Cao T, Hu Q, Zhang L, Ming X, Chen J, Fu L, Guan X. Esophageal squamous cell carcinoma (ESCC): advance in genomics and molecular genetics. Dis Esophagus. 2015;28:84-89. [RCA] [PubMed] [DOI] [Full Text] [Cited by in Crossref: 42] [Cited by in RCA: 53] [Article Influence: 5.3] [Reference Citation Analysis (0)] |
| 2. | Coleman HG, Murray LJ, Hicks B, Bhat SK, Kubo A, Corley DA, Cardwell CR, Cantwell MM. Dietary fiber and the risk of precancerous lesions and cancer of the esophagus: a systematic review and meta-analysis. Nutr Rev. 2013;71:474-482. [RCA] [PubMed] [DOI] [Full Text] [Cited by in Crossref: 52] [Cited by in RCA: 43] [Article Influence: 3.6] [Reference Citation Analysis (0)] |
| 3. | Inoue K, Ozeki Y, Suganuma T, Sugiura Y, Tanaka S. Vascular endothelial growth factor expression in primary esophageal squamous cell carcinoma. Association with angiogenesis and tumor progression. Cancer. 1997;79:206-213. [PubMed] |
| 4. | Abbaszadegan MR, Raziee HR, Ghafarzadegan K, Shakeri MT, Afsharnezhad S, Ghavamnasiry MR. Aberrant p16 methylation, a possible epigenetic risk factor in familial esophageal squamous cell carcinoma. Int J Gastrointest Cancer. 2005;36:47-54. [RCA] [PubMed] [DOI] [Full Text] [Cited by in Crossref: 33] [Cited by in RCA: 36] [Article Influence: 1.9] [Reference Citation Analysis (0)] |
| 5. | Kano M, Seki N, Kikkawa N, Fujimura L, Hoshino I, Akutsu Y, Chiyomaru T, Enokida H, Nakagawa M, Matsubara H. miR-145, miR-133a and miR-133b: Tumor-suppressive miRNAs target FSCN1 in esophageal squamous cell carcinoma. Int J Cancer. 2010;127:2804-2814. [RCA] [PubMed] [DOI] [Full Text] [Cited by in Crossref: 351] [Cited by in RCA: 393] [Article Influence: 28.1] [Reference Citation Analysis (0)] |
| 6. | Lin DC, Du XL, Wang MR. Protein alterations in ESCC and clinical implications: a review. Dis Esophagus. 2009;22:9-20. [RCA] [PubMed] [DOI] [Full Text] [Cited by in Crossref: 65] [Cited by in RCA: 72] [Article Influence: 4.2] [Reference Citation Analysis (0)] |
| 7. | Zhang Y, Xu Y, Feng L, Li F, Sun Z, Wu T, Shi X, Li J, Li X. Comprehensive characterization of lncRNA-mRNA related ceRNA network across 12 major cancers. Oncotarget. 2016;7:64148-64167. [RCA] [PubMed] [DOI] [Full Text] [Full Text (PDF)] [Cited by in Crossref: 128] [Cited by in RCA: 162] [Article Influence: 23.1] [Reference Citation Analysis (1)] |
| 8. | Gaidatzis D, van Nimwegen E, Hausser J, Zavolan M. Inference of miRNA targets using evolutionary conservation and pathway analysis. BMC Bioinformatics. 2007;8:69. [RCA] [PubMed] [DOI] [Full Text] [Full Text (PDF)] [Cited by in Crossref: 235] [Cited by in RCA: 252] [Article Influence: 14.0] [Reference Citation Analysis (0)] |
| 9. | Zhu S, Si ML, Wu H, Mo YY. MicroRNA-21 targets the tumor suppressor gene tropomyosin 1 (TPM1). J Biol Chem. 2007;282:14328-14336. [RCA] [PubMed] [DOI] [Full Text] [Cited by in Crossref: 808] [Cited by in RCA: 817] [Article Influence: 45.4] [Reference Citation Analysis (0)] |
| 10. | Arun G, Diermeier S, Akerman M, Chang KC, Wilkinson JE, Hearn S, Kim Y, MacLeod AR, Krainer AR, Norton L. Differentiation of mammary tumors and reduction in metastasis upon Malat1 lncRNA loss. Genes Dev. 2016;30:34-51. [RCA] [PubMed] [DOI] [Full Text] [Full Text (PDF)] [Cited by in Crossref: 485] [Cited by in RCA: 469] [Article Influence: 52.1] [Reference Citation Analysis (0)] |
| 11. | Noorbakhsh J, Lang AH, Mehta P. Intrinsic noise of microRNA-regulated genes and the ceRNA hypothesis. PLoS One. 2013;8:e72676. [RCA] [PubMed] [DOI] [Full Text] [Full Text (PDF)] [Cited by in Crossref: 27] [Cited by in RCA: 25] [Article Influence: 2.1] [Reference Citation Analysis (0)] |
| 12. | Xu J, Li Y, Lu J, Pan T, Ding N, Wang Z, Shao T, Zhang J, Wang L, Li X. The mRNA related ceRNA-ceRNA landscape and significance across 20 major cancer types. Nucleic Acids Res. 2015;43:8169-8182. [RCA] [PubMed] [DOI] [Full Text] [Full Text (PDF)] [Cited by in Crossref: 126] [Cited by in RCA: 149] [Article Influence: 14.9] [Reference Citation Analysis (0)] |
| 13. | Jin J, Chu Z, Ma P, Meng Y, Yang Y. Long non-coding RNA SPRY4-IT1 promotes proliferation and invasion by acting as a ceRNA of miR-101-3p in colorectal cancer cells. Tumour Biol. 2017;39:1010428317716250. [RCA] [PubMed] [DOI] [Full Text] [Cited by in Crossref: 28] [Cited by in RCA: 37] [Article Influence: 4.6] [Reference Citation Analysis (0)] |
| 14. | Luan T, Zhang X, Wang S, Song Y, Zhou S, Lin J, An W, Yuan W, Yang Y, Cai H. Long non-coding RNA MIAT promotes breast cancer progression and functions as ceRNA to regulate DUSP7 expression by sponging miR-155-5p. Oncotarget. 2017;8:76153-76164. [RCA] [PubMed] [DOI] [Full Text] [Full Text (PDF)] [Cited by in Crossref: 77] [Cited by in RCA: 98] [Article Influence: 12.3] [Reference Citation Analysis (0)] |
| 15. | Ventura A, Young AG, Winslow MM, Lintault L, Meissner A, Erkeland SJ, Newman J, Bronson RT, Crowley D, Stone JR. Targeted deletion reveals essential and overlapping functions of the miR-17 through 92 family of miRNA clusters. Cell. 2008;132:875-886. [RCA] [PubMed] [DOI] [Full Text] [Full Text (PDF)] [Cited by in Crossref: 1370] [Cited by in RCA: 1310] [Article Influence: 77.1] [Reference Citation Analysis (1)] |
| 16. | Martirosyan A, De Martino A, Pagnani A, Marinari E. ceRNA crosstalk stabilizes protein expression and affects the correlation pattern of interacting proteins. Sci Rep. 2017;7:43673. [RCA] [PubMed] [DOI] [Full Text] [Full Text (PDF)] [Cited by in Crossref: 20] [Cited by in RCA: 22] [Article Influence: 2.8] [Reference Citation Analysis (0)] |
| 17. | Liu Q, Guo X, Que S, Yang X, Fan H, Liu M, Li X, Tang H. LncRNA RSU1P2 contributes to tumorigenesis by acting as a ceRNA against let-7a in cervical cancer cells. Oncotarget. 2017;8:43768-43781. [RCA] [PubMed] [DOI] [Full Text] [Full Text (PDF)] [Cited by in Crossref: 57] [Cited by in RCA: 68] [Article Influence: 9.7] [Reference Citation Analysis (0)] |
| 18. | Conte F, Fiscon G, Chiara M, Colombo T, Farina L, Paci P. Role of the long non-coding RNA PVT1 in the dysregulation of the ceRNA-ceRNA network in human breast cancer. PLoS One. 2017;12:e0171661. [RCA] [PubMed] [DOI] [Full Text] [Full Text (PDF)] [Cited by in Crossref: 78] [Cited by in RCA: 89] [Article Influence: 11.1] [Reference Citation Analysis (0)] |
| 19. | Karreth FA, Tay Y, Perna D, Ala U, Tan SM, Rust AG, DeNicola G, Webster KA, Weiss D, Perez-Mancera PA. In vivo identification of tumor- suppressive PTEN ceRNAs in an oncogenic BRAF-induced mouse model of melanoma. Cell. 2011;147:382-395. [RCA] [PubMed] [DOI] [Full Text] [Cited by in Crossref: 548] [Cited by in RCA: 555] [Article Influence: 39.6] [Reference Citation Analysis (0)] |
| 20. | Stratton MR, Campbell PJ, Futreal PA. The cancer genome. Nature. 2009;458:719-724. [RCA] [PubMed] [DOI] [Full Text] [Full Text (PDF)] [Cited by in Crossref: 2798] [Cited by in RCA: 2423] [Article Influence: 151.4] [Reference Citation Analysis (0)] |
| 21. | Cancer Genome Atlas Research Network. Weinstein JN, Collisson EA, Mills GB, Shaw KR, Ozenberger BA, Ellrott K, Shmulevich I, Sander C, Stuart JM. The Cancer Genome Atlas Pan-Cancer analysis project. Nat Genet. 2013;45:1113-1120. [RCA] [PubMed] [DOI] [Full Text] [Cited by in Crossref: 4788] [Cited by in RCA: 5548] [Article Influence: 462.3] [Reference Citation Analysis (0)] |
| 22. | Wen J, Yang H, Liu MZ, Luo KJ, Liu H, Hu Y, Zhang X, Lai RC, Lin T, Wang HY. Gene expression analysis of pretreatment biopsies predicts the pathological response of esophageal squamous cell carcinomas to neo-chemoradiotherapy. Ann Oncol. 2014;25:1769-1774. [RCA] [PubMed] [DOI] [Full Text] [Cited by in Crossref: 65] [Cited by in RCA: 77] [Article Influence: 7.0] [Reference Citation Analysis (0)] |
| 23. | Wang Q, Ma C, Kemmner W. Wdr66 is a novel marker for risk stratification and involved in epithelial-mesenchymal transition of esophageal squamous cell carcinoma. BMC Cancer. 2013;13:137. [RCA] [PubMed] [DOI] [Full Text] [Full Text (PDF)] [Cited by in Crossref: 42] [Cited by in RCA: 66] [Article Influence: 5.5] [Reference Citation Analysis (0)] |
| 24. | Jang HJ, Lee HS, Burt BM, Lee GK, Yoon KA, Park YY, Sohn BH, Kim SB, Kim MS, Lee JM. Integrated genomic analysis of recurrence-associated small non-coding RNAs in oesophageal cancer. Gut. 2017;66:215-225. [RCA] [PubMed] [DOI] [Full Text] [Cited by in Crossref: 32] [Cited by in RCA: 34] [Article Influence: 4.3] [Reference Citation Analysis (0)] |
| 25. | Hu N, Wang C, Clifford RJ, Yang HH, Su H, Wang L, Wang Y, Xu Y, Tang ZZ, Ding T. Integrative genomics analysis of genes with biallelic loss and its relation to the expression of mRNA and micro-RNA in esophageal squamous cell carcinoma. BMC Genomics. 2015;16:732. [RCA] [PubMed] [DOI] [Full Text] [Full Text (PDF)] [Cited by in Crossref: 16] [Cited by in RCA: 24] [Article Influence: 2.4] [Reference Citation Analysis (0)] |
| 26. | Song Y, Li L, Ou Y, Gao Z, Li E, Li X, Zhang W, Wang J, Xu L, Zhou Y. Identification of genomic alterations in oesophageal squamous cell cancer. Nature. 2014;509:91-95. [RCA] [PubMed] [DOI] [Full Text] [Cited by in Crossref: 721] [Cited by in RCA: 854] [Article Influence: 77.6] [Reference Citation Analysis (0)] |
| 27. | Huang da W, Sherman BT, Lempicki RA. Systematic and integrative analysis of large gene lists using DAVID bioinformatics resources. Nat Protoc. 2009;4:44-57. [RCA] [PubMed] [DOI] [Full Text] [Cited by in Crossref: 24735] [Cited by in RCA: 27969] [Article Influence: 1748.1] [Reference Citation Analysis (0)] |
| 28. | Assenov Y, Ramírez F, Schelhorn SE, Lengauer T, Albrecht M. Computing topological parameters of biological networks. Bioinformatics. 2008;24:282-284. [RCA] [PubMed] [DOI] [Full Text] [Cited by in Crossref: 1127] [Cited by in RCA: 1253] [Article Influence: 69.6] [Reference Citation Analysis (0)] |
| 29. | Liang C, Zhang X, Zou J, Xu D, Su F, Ye N. Identification of miRNA from Porphyra yezoensis by high-throughput sequencing and bioinformatics analysis. PLoS One. 2010;5:e10698. [RCA] [PubMed] [DOI] [Full Text] [Full Text (PDF)] [Cited by in Crossref: 75] [Cited by in RCA: 61] [Article Influence: 4.1] [Reference Citation Analysis (0)] |
| 30. | Zhang W, Liu Z, Xiaoxia HU, Zheng W, Zeng K. The expression of miRNA-497 and miRNA-195 cluster in cervical cancer tissues and bioinformatics analysis of predicted target genes. Zhongguo Yiyao Daobao. 2014;11:4-9. |
| 31. | Mercier G, Berthault N, Mary J, Peyre J, Antoniadis A, Comet JP, Cornuejols A, Froidevaux C, Dutreix M. Biological detection of low radiation doses by combining results of two microarray analysis methods. Nucleic Acids Res. 2004;32:e12. [RCA] [PubMed] [DOI] [Full Text] [Cited by in Crossref: 28] [Cited by in RCA: 29] [Article Influence: 1.4] [Reference Citation Analysis (0)] |
| 32. | Martin B, Chadwick W, Yi T, Park SS, Lu D, Ni B, Gadkaree S, Farhang K, Becker KG, Maudsley S. VENNTURE--a novel Venn diagram investigational tool for multiple pharmacological dataset analysis. PLoS One. 2012;7:e36911. [RCA] [PubMed] [DOI] [Full Text] [Full Text (PDF)] [Cited by in Crossref: 53] [Cited by in RCA: 54] [Article Influence: 4.2] [Reference Citation Analysis (0)] |
| 33. | Heberle H, Meirelles GV, da Silva FR, Telles GP, Minghim R. InteractiVenn: a web-based tool for the analysis of sets through Venn diagrams. BMC Bioinformatics. 2015;16:169. [RCA] [PubMed] [DOI] [Full Text] [Full Text (PDF)] [Cited by in Crossref: 998] [Cited by in RCA: 1558] [Article Influence: 155.8] [Reference Citation Analysis (0)] |
| 34. | Starkov AA, Fiskum G, Chinopoulos C, Lorenzo BJ, Browne SE, Patel MS, Beal MF. Mitochondrial alpha-ketoglutarate dehydrogenase complex generates reactive oxygen species. J Neurosci. 2004;24:7779-7788. [RCA] [PubMed] [DOI] [Full Text] [Cited by in Crossref: 513] [Cited by in RCA: 534] [Article Influence: 26.7] [Reference Citation Analysis (0)] |
| 35. | Mutowo P, Bento AP, Dedman N, Gaulton A, Hersey A, Lomax J, Overington JP. A drug target slim: using gene ontology and gene ontology annotations to navigate protein-ligand target space in ChEMBL. J Biomed Semantics. 2016;7:59. [RCA] [PubMed] [DOI] [Full Text] [Full Text (PDF)] [Cited by in Crossref: 24] [Cited by in RCA: 21] [Article Influence: 2.3] [Reference Citation Analysis (0)] |
| 36. | Kanehisa M, Goto S. KEGG: kyoto encyclopedia of genes and genomes. Nucleic Acids Res. 2000;28:27-30. [PubMed] |
| 37. | Altermann E, Klaenhammer TR. PathwayVoyager: pathway mapping using the Kyoto Encyclopedia of Genes and Genomes (KEGG) database. BMC Genomics. 2005;6:60. [RCA] [PubMed] [DOI] [Full Text] [Full Text (PDF)] [Cited by in Crossref: 213] [Cited by in RCA: 255] [Article Influence: 12.8] [Reference Citation Analysis (0)] |
| 38. | Du J, Yuan Z, Ma Z, Song J, Xie X, Chen Y. KEGG-PATH: Kyoto encyclopedia of genes and genomes-based pathway analysis using a path analysis model. Mol Biosyst. 2014;10:2441-2447. [RCA] [PubMed] [DOI] [Full Text] [Cited by in Crossref: 239] [Cited by in RCA: 283] [Article Influence: 28.3] [Reference Citation Analysis (0)] |
| 39. | Grahne G, Hakli R, Nykänen M, Tamm H, Ukkonen E. Design and implementation of a string database query language. Inform Syst. 2003;28:311-337. [RCA] [DOI] [Full Text] [Cited by in Crossref: 6] [Cited by in RCA: 1] [Article Influence: 0.0] [Reference Citation Analysis (0)] |
| 40. | Enright AJ, Iliopoulos I, Kyrpides NC, Ouzounis CA. Protein interaction maps for complete genomes based on gene fusion events. Nature. 1999;402:86-90. [RCA] [PubMed] [DOI] [Full Text] [Cited by in Crossref: 732] [Cited by in RCA: 700] [Article Influence: 26.9] [Reference Citation Analysis (0)] |
| 41. | Suhre K, Claverie JM. FusionDB: a database for in-depth analysis of prokaryotic gene fusion events. Nucleic Acids Res. 2004;32:D273-D276. [RCA] [PubMed] [DOI] [Full Text] [Cited by in Crossref: 147] [Cited by in RCA: 119] [Article Influence: 5.7] [Reference Citation Analysis (0)] |
| 42. | Makiuchi T, Nara T, Annoura T, Hashimoto T, Aoki T. Occurrence of multiple, independent gene fusion events for the fifth and sixth enzymes of pyrimidine biosynthesis in different eukaryotic groups. Gene. 2007;394:78-86. [RCA] [PubMed] [DOI] [Full Text] [Cited by in Crossref: 18] [Cited by in RCA: 16] [Article Influence: 0.9] [Reference Citation Analysis (0)] |
| 43. | Szklarczyk D, Franceschini A, Kuhn M, Simonovic M, Roth A, Minguez P, Doerks T, Stark M, Muller J, Bork P. The STRING database in 2011: functional interaction networks of proteins, globally integrated and scored. Nucleic Acids Res. 2011;39:D561-D568. [RCA] [PubMed] [DOI] [Full Text] [Full Text (PDF)] [Cited by in Crossref: 2562] [Cited by in RCA: 2634] [Article Influence: 188.1] [Reference Citation Analysis (0)] |
| 44. | Li X, Zheng L, Zhang F, Hu J, Chou J, Liu Y, Xing Y, Xi T. STARD13-correlated ceRNA network inhibits EMT and metastasis of breast cancer. Oncotarget. 2016;7:23197-23211. [RCA] [PubMed] [DOI] [Full Text] [Full Text (PDF)] [Cited by in Crossref: 65] [Cited by in RCA: 68] [Article Influence: 7.6] [Reference Citation Analysis (0)] |
| 45. | Chiu HS, Llobet-Navas D, Yang X, Chung WJ, Ambesi-Impiombato A, Iyer A, Kim HR, Seviour EG, Luo Z, Sehgal V. Cupid: simultaneous reconstruction of microRNA-target and ceRNA networks. Genome Res. 2015;25:257-267. [RCA] [PubMed] [DOI] [Full Text] [Full Text (PDF)] [Cited by in Crossref: 74] [Cited by in RCA: 87] [Article Influence: 7.9] [Reference Citation Analysis (0)] |
| 46. | Zhou M, Wang X, Shi H, Cheng L, Wang Z, Zhao H, Yang L, Sun J. Characterization of long non-coding RNA-associated ceRNA network to reveal potential prognostic lncRNA biomarkers in human ovarian cancer. Oncotarget. 2016;7:12598-12611. [RCA] [PubMed] [DOI] [Full Text] [Full Text (PDF)] [Cited by in Crossref: 184] [Cited by in RCA: 196] [Article Influence: 21.8] [Reference Citation Analysis (0)] |
| 47. | Lotia S, Montojo J, Dong Y, Bader GD, Pico AR. Cytoscape app store. Bioinformatics. 2013;29:1350-1351. [RCA] [PubMed] [DOI] [Full Text] [Full Text (PDF)] [Cited by in Crossref: 100] [Cited by in RCA: 131] [Article Influence: 10.9] [Reference Citation Analysis (0)] |
| 48. | Denzler R, Agarwal V, Stefano J, Bartel DP, Stoffel M. Assessing the ceRNA hypothesis with quantitative measurements of miRNA and target abundance. Mol Cell. 2014;54:766-776. [RCA] [PubMed] [DOI] [Full Text] [Cited by in Crossref: 471] [Cited by in RCA: 523] [Article Influence: 47.5] [Reference Citation Analysis (0)] |


