Published online Dec 14, 2011. doi: 10.3748/wjg.v17.i46.5110
Revised: August 4, 2011
Accepted: August 15, 2011
Published online: December 14, 2011
AIM: To validate the clinical relevance of autofluorescence imaging (AFI) endoscopy for the assessment of inflammatory ulcerative colitis (UC).
METHODS: A total of 572 endoscopic images were selected from 42 UC patients: 286 taken with white light imaging (WLI) and 286 with AFI from the same sites. WLI images were assessed for overall mucosal inflammation according to Mayo endoscopic subscore (MES), and for seven characteristic endoscopic features. Likewise, AFI photographs were scored according to relative abundance of red, green and blue color components within each image based on an RGB additive color model. WLI and AFI endoscopic scores from the same sites were compared. Histological evaluation of biopsies was according to the Riley Index.
RESULTS: Relative to red (r = 0.52, P < 0.01) or blue (r = 0.56, P < 0.01) color component, the green color component of AFI (r = -0.62, P < 0.01) corresponded more closely with mucosal inflammation sites. There were significant differences in green color components between MES-0 (0.396 ± 0.043) and MES-1 (0.340 ± 0.035) (P < 0.01), and between MES-1 and ≥ MES-2 (0.318 ± 0.037) (P < 0.01). The WLI scores for “vascular patterns” (r = -0.65, P < 0.01), “edema” (r = -0.62, P < 0.01), histology scores for “polymorphonuclear cells in the lamina propria” (r = -0.51, P < 0.01) and “crypt architectural irregularities” (r = -0.51, P < 0.01) showed correlation with the green color component of AFI. There were significant differences in green color components between limited (0.399 ± 0.042) and extensive (0.375 ± 0.044) (P = 0.014) polymorphonuclear cell infiltration within MES-0. As the severity of the mucosal inflammation increased, the green color component of AFI decreased. The AFI green color component was well correlated with the characteristic endoscopic and histological inflammatory features of UC.
CONCLUSION: AFI has application in detecting inflammatory lesions, including microscopic activity in the colonic mucosa of UC patients, based on the green color component of images.
- Citation: Osada T, Arakawa A, Sakamoto N, Ueyama H, Shibuya T, Ogihara T, Yao T, Watanabe S. Autofluorescence imaging endoscopy for identification and assessment of inflammatory ulcerative colitis. World J Gastroenterol 2011; 17(46): 5110-5116
- URL: https://www.wjgnet.com/1007-9327/full/v17/i46/5110.htm
- DOI: https://dx.doi.org/10.3748/wjg.v17.i46.5110
Ulcerative colitis (UC) activity is routinely assessed by a combination of clinical, endoscopic, and histological findings. However, systematic measurement of disease activity in UC patients is essential for determining the efficacy of treatment interventions. Endoscopy in particular is the most immediate and objective method for evaluating colonic mucosal damage. Furthermore, the severity of mucosal inflammation in UC is evaluated based on several disease activity indices, but there is no validated gold standard. To standardize the assessment of disease activity for clinical trials, in 1987, Schroeder et al[1] described the Mayo Score, which includes endoscopic findings. This index includes the factors “erythema”, “vascular pattern”, “friability”, “erosion” and “spontaneous bleeding”. “Edema” and “granularity” are also factored in other endoscopic indices, such as Matts’ endoscopic activity index. These features are considered to be characteristic endoscopic findings in UC. However, inter- and intra-observer variations, and variations depending on the observer’s experience in the endoscopic assessment of UC based on conventional endoscopy, have been reported[2].
Histological activity generally shows strong correlation with the activity evaluated by endoscopy. However, microscopic evaluations reflect clinical symptoms more accurately than endoscopic evaluations[3]. Endoscopic appearance alone tends to underestimate the severity of disease activity as compared with histological evaluation, and is not able to detect microscopic activity[4-6]. The features of mucosal lesions in UC are considered to include the presence of polymorphonuclear leukocytes in the lamina propria, the formation of crypt abscesses, ulcers and mononuclear cell infiltrate in the lamina propria together with crypt architectural irregularities[7]. In the Riley Index, 6 histological features of UC are factored and each feature is graded on a four-point scale[8]; this index has been applied in some clinical trials.
Autofluorescence imaging (AFI) videoendoscopy produces real-time pseudocolor images based on tissue autofluorescence emitted by excitation of endogenous tissue fluorophores, which mainly consist of collagen type-I[9]. If the change of hue on AFI indicated the extent and severity of UC activity, the analysis would be an objective and reproducible method regardless of the observer’s experience. With this in mind, the aim of this study was to evaluate the correlations between the results of analysis of the change in hue on AFI with the results of white light imaging (WLI), together with histological findings on UC activity, to better understand the clinical relevance of AFI.
This study included 42 patients with a diagnosis of UC, 31 male and 11 female, aged 36.2 ± 11.0 (mean ± SD) years who underwent colonoscopic examinations with a CF-FH260AZL/I colonovideoscope (Olympus Inc., Tokyo Japan). This endoscopic system comprised a high resolution white-light endoscope with optical zoom (magnification 75 ×) equipped with an AFI and narrow band imaging (NBI). The same sites were observed by WLI and AFI. Stored images were retrieved from the computerized database of the Endoscopy Centre at Juntendo University Hospital (Tokyo, Japan) by using an endoscopic filing system, Scope Reader M1 (AZ Co., Ltd., Sendai, Japan). A total of 572 endoscopic images, 286 with WLI and 286 with AFI, from the same sites where tissue biopsy specimens were subsequently taken were selected. The diagnosis of UC was based on the following criteria: history of recurrent bloody and mucous stools, endoscopic findings of ulceration, mucosal friability, loss of vascular architecture or presence of diffuse lesions increasing in severity towards the rectum, and no evidence of pathogenic micro-organisms in stool cultures. The images could be downloaded from the server in JPEG (Joint Photographic Experts Group) format without loss of quality. The file size of each downloaded image was about 100 kilobytes, with a pixel array of 640 × 480, and in 24-bit color.
Initially, all endoscopic examinations were done by one expert endoscopist. Subsequently, the images of WLI were provided for examination by two expert endoscopists (NS and TO), who discussed their assessments and reached a consensus view on the endoscopic activity. Each of these expert endoscopists had performed more than 5000 colonoscopy procedures, and was familiar with UC disease activity via endoscopy. Each WLI image was examined and graded for overall mucosal inflammation according to the Mayo endoscopic subscore (MES), scored on a scale of 0 to 3 (Table 1), and for seven endoscopic characteristic features of UC including vascular patterns, erythema, edema, granularity, erosions, ulcers and friability, scored on a scale of 0 to 10 (Table 2).
| Score | |
| 0 | Normal or inactive disease |
| 1 | Mild disease (erythema, decreased vascular pattern, mild friability) |
| 2 | Moderate disease (marked erythema, absent vascular pattern, friability, erosions) |
| 3 | Severe disease (spontaneous bleeding, ulceration) |
| Vascular pattern | 0 (normal) to 10 (absent) |
| Erythema | 0 (absent) to 10 (marked) |
| Edema | 0 (absent) to 10 (marked) |
| Granularity | 0 (absent) to 10 (marked) |
| Erosions | 0 (absent) to 10 (multiple) |
| Ulcerations | 0 (absent) to 10 (multiple) |
| Friability | 0 (absent) to 10 (marked) |
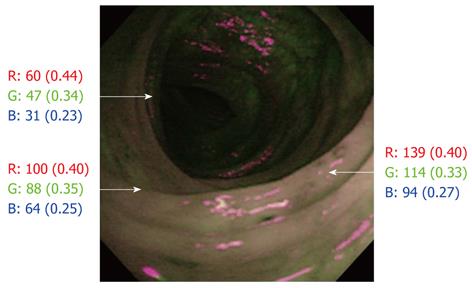
The optical findings with AFI colonoscopy were displayed as pseudocolored images, and laid over a composite image on the video display. All computer and video displays used the RGB additive color model in which red, green and blue lights are added together in various ways to produce a broad array of colors (256 × 256 × 256 = 16 million). AFI images were evaluated by analyzing the hue, and scored for the relative abundance of red [R/(R + G + B)], green [G/(R + G + B)] and blue (B/[R+G+B]) color components based on the RGB color model which involves the use of Adobe® Photoshop® Elements® 5.0. The color of the region on AFI, where tissue biopsy specimens were subsequently taken, was divided into red, green and blue color components. Although the actual count of each color varied as its brightness varied, the abundance of the actual count was fairly constant (Figure 1). All AFI and WLI images were displayed anonymously to the observers and revealed neither clinical data nor the date on which the images were taken.
Histological evaluations were done by two expert histopathologists (AA and HU) who were familiar with the histological activity in UC and had no knowledge of the clinical findings. They discussed their evaluation and determined the histological activity by using the Riley Index. Six histological features of UC were factored: acute inflammatory cell infiltrate (polymorphonuclear cells in the lamina propria), crypt abscesses, mucin depletion, surface epithelial integrity, chronic inflammatory cell infiltrate (round cells in the lamina propria), and crypt architectural irregularities. Each feature was graded on a four-point scale from 0 to 3 (Table 3).
| 1 | Round cells in the lamina propria |
| 2 | Polymorphonuclear cells in the lamina propria |
| 3 | Crypt abscesses |
| 4 | Mucin depletion |
| 5 | Surface epithelial integrity |
| 6 | Crypt architectural irregularities |
The outcomes of the AFI analysis using the RGB color model were compared with the endoscopic activity, endoscopic and histological features at the same sites. In addition, the ability of AFI to detect the microscopic inflammatory lesions which were extensively infiltrated by polymorphonuclear cells within MES-0 was evaluated.
The relative abundance of color components was expressed as the mean ± SD values. The relationships between endoscopic findings, histological evaluations, and the relative abundance of red, green and blue color components based on the RGB color model were determined by using the Spearman rank correlation coefficient (r). The Tukey-Kramer multiple comparison test was used for statistical analysis of the rate of color components based on the RGB color model among MES from 0 to 3. Before the Tukey-Kramer multiple comparison test, one-way analysis of variance (ANOVA) was performed. The Student’s t-test (unpaired) was applied to compare the green color components based on the RGB color model between limited (combined grades 0 and 1) and extensive (combined grades 2 and 3) polymorphonuclear cell infiltration. Differences with P values < 0.05 were considered to be statistically significant.
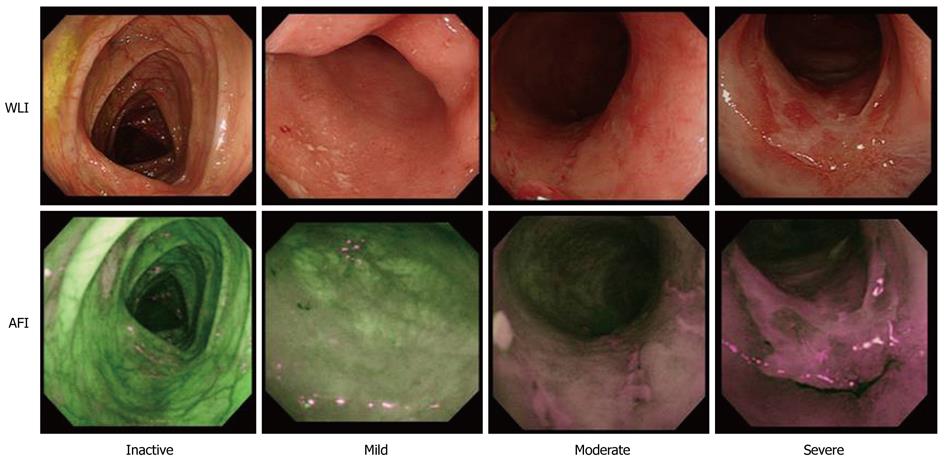
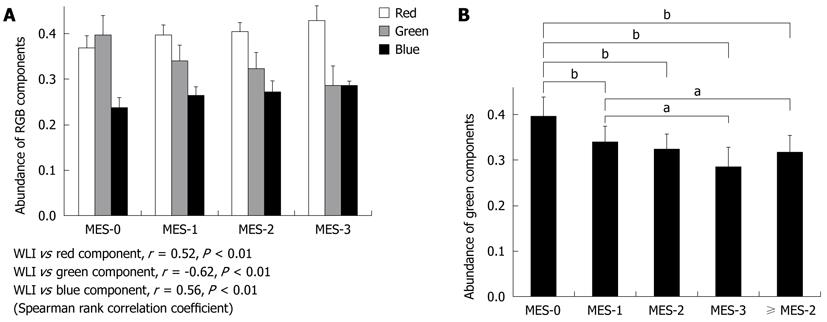
The relationships between the RGB color components of AFI and WLI findings were evaluated in 572 endoscopic images from a total of 286 sites (Figure 2). Relative to the red (r = 0.52, P < 0.01) or blue (r = 0.56, P < 0.01) color component, the green color component (r = -0.62, P < 0.01) corresponded most often with sites of mucosal inflammation in different colonoscopy images (Figure 3A). However, there was an inverse relationship between the green color components and mucosal inflammation, so that the green color components of AFI diminished as the mucosal inflammation became more severe.
The average number of green color components for images classified into each MES subscore was 0.396 ± 0.043 for MES-0, 0.340 ± 0.035 for MES-1, 0.324 ± 0.034 for MES-2, and 0.286 ± 0.043 for MES-3. There were significant differences in green color component values between MES-0 and MES-1 (P < 0.01), MES-0 and MES-2 (P < 0.01), MES-0 and MES-3 (P < 0.01), and MES-1 and MES-3 (P < 0.05), but not between MES-1 and MES-2, nor between MES-2 and MES-3. Likewise, there was a significant difference in green color component values between MES-1 and scores of ≥ MES-2 (0.318 ± 0.037) as a combined group of MES-2 and MES-3 (P < 0.01) (Figure 3B). As the severity of the mucosal inflammation increased, the green color component of AFI decreased. However, the value of the color did not alter much between moderate and severe inflammation.
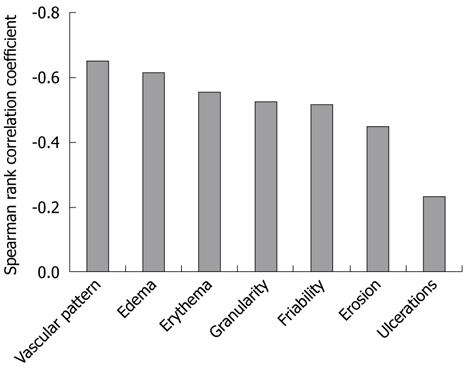
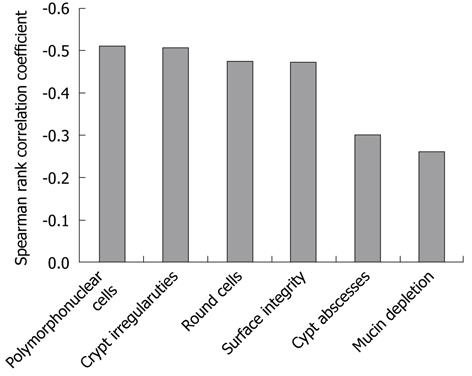
The relationships between the AFI green color component and WLI scores for the seven characteristic endoscopic features of UC are presented in Figure 4. The correlation coefficients for the AFI green color component with the scores of the seven characteristics were as follows: vascular pattern r = -0.65, P < 0.01; erythema r = -0.55, P < 0.01; edema r = -0.62, P < 0.01; granularity r = -0.53, P < 0.01; erosions r = -0.45, P < 0.01; ulcers r = -0.23, P < 0.01; and friability r = -0.52, P < 0.01. The AFI green color component was well correlated with the scores for vascular pattern and edema, but not with the score for ulcers. It also showed relatively good correlation with the other endoscopic features of UC. The relationships between the AFI green color component and histology scores of six histological characteristic features of UC are shown in Figure 5. The correlation coefficients for the AFI green color component with the scores for the histological features were as follows: polymorphonuclear cells in the lamina propria r = -0.51, P < 0.01; crypt abscesses r = -0.30, P < 0.01; mucin depletion r = -0.26, P < 0.01; surface epithelial integrity r = -0.47, P < 0.01; round cells in the lamina propria r = -0.48, P < 0.01; and crypt architectural irregularities r = -0.51, P < 0.01. The AFI green color component was relatively well correlated with the scores for polymorphonuclear cells in the lamina propria and with the crypt architectural irregularities, but not with the scores for crypt abscesses and mucin depletion.
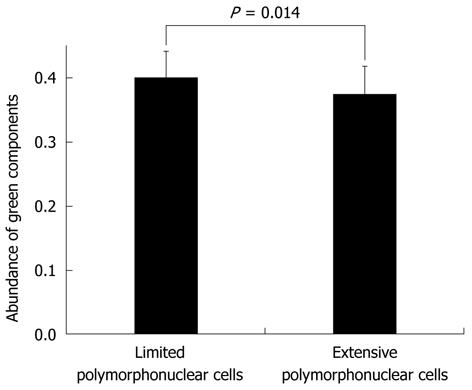
The relationship between limited (combined grades 0 and 1) and extensive (combined grades 2 and 3) polymorphonuclear cell infiltration based on the green color components within MES-0 based on WLI are shown in Figure 6. The mean numbers of green color components for images classified according to the level of polymorphonuclear cell infiltration within MES-0 were 0.399 ± 0.042 and 0.375 ± 0.044 for limited and extensive infiltration, respectively. There were significant differences in green color component values between limited and extensive polymorphonuclear cell infiltration within MES-0 (P = 0.014). The abundance of green color components of AFI was also significantly different between microscopic inflammatory sites and histologically-quiescent UC lesions.
AFI has been used to highlight neoplastic tissue[10], minimal change in reflux esophagitis[11], the extent of chronic atrophic fundal gastritis[12], and Barrett’s esophagus[13]. In all of these reports the lesions on the AFI are divided into two colors, such as green and magenta, green and pink, green and gray, green and purple, because investigators were concerned with the presence and the extent of the lesions, rather than with determining the severity of inflammation. In the present study, AFI pictures were scored according to the relative abundance of red, green and blue color components within each image based on an RGB additive model. Therefore, each component was expressed as a sequential variable number, and this facilitated evaluation of the severity of mucosal damage. Further, the analysis was convenient to perform by using the Adobe® Photoshop® Elements® 5.0 software. Among the three color components, the green color component corresponded most often (and inversely) with sites of mucosal inflammation. Although fluorophores exist in both the mucosa and the submucosa, collagen in the submucosa emits strong green autofluorescence[14]. Our impression is that the presence of mucosal inflammation caused a high cell density and thickened the mucosal layer, making it difficult for the autofluorescence from the submucosa to penetrate the inflamed mucosa. Therefore, the green color component was reduced. The degree of the green color component might be valuable for assessing the extent of inflammation in the large intestine.
The overall mucosal inflammation in WLI, as assessed by MES, and the green color component in the AFI were well correlated. Specifically, there were significant differences in green color component values between MES-0 and MES-1, and between MES-1 and ≥ MES-2, but not between MES-2 and MES-3. The degree of mucosal structural change around erosions and ulcers due to inflammation may differ only slightly between MES-2 and MES-3. Accordingly, the green color component of the AFI may not have been able to clearly distinguish moderate from severe inflammation.
Regarding the relationships between each of the seven characteristic endoscopic UC features on the WLI and the green color component of the AFI, vascular pattern and edema were well correlated with the green color component. These features are present from the early phase of UC, and decreased vascular pattern was particularly associated with MES-1, Baron score 1[15], modified Baron score 1[16], and Rachmilewitz index score 1[17]. This suggests that the green color component of the AFI is appropriate for detecting mucosal inflammation. In contrast, ulceration was not well correlated with the green color component of the AFI. The level of penetration of the green color component of the AFI from the submucosa through more than moderately inflamed mucosa might be constant regardless of the presence of ulcers. However, it was relatively simple to distinguish moderate from severe inflammation by using only WLI, based on the findings from spontaneous bleeding and multiple ulcers.
It has been reported that two measures of histological findings, such as architectural abnormalities including crypt architectural distortion and inflammatory features including large numbers of neutrophils, allow a distinction between inflammatory bowel disease and other causes of colorectal inflammation[18]. In our study, among six histological characteristic features of UC, polymorphonuclear cells in the lamina propria and crypt architectural irregularities were relatively well correlated with the green color component of the AFI. These two features are common in UC[19]. Polymorphonuclear cells in the lamina propria and crypt architectural irregularities are recognized in the active disease phase. The green color component of the AFI might reflect active mucosal inflammation. Other histological features of UC, especially mucin depletion and crypt abscesses, were not correlated with the green color component of the AFI. Although mucin depletion is a characteristic feature of UC, the degree of mucin depletion is not associated with the degree of inflammation. Crypt abscesses were observed in only about 7% of the biopsy specimens (26.2% of patients).
Although endoscopic remission was obtained after treatment, histological evidence of acute inflammatory cells often remained. The presence of microscopic inflammation contributed a 2- to 3-fold increase in the relapse rate[8]. The microscopic findings on inflammation were helpful in predicting relapse and for deciding on medical intervention. In this study, although the difference between microscopic inflammation and histological quiescence and the intensity of the green color components was relatively small, nevertheless the difference was significant. It is likely that microscopic inflammation was determined based on an evaluation of the green color component of the AFI.
In conclusion, the outcomes of the present investigation indicate that AFI is an appropriate new approach for detecting inflammatory regions and approximately estimating the severity of inflammation in UC patients, regardless of endoscopic experience. In particular, microscopic to moderate inflammation can be detected based on the green color component of the RGB additive color model. Further studies should strengthen our findings on the clinical relevance of AFI in patients with UC.
Endoscopic and histological findings define the degree of inflammatory activity in the clinical diagnosis of ulcerative colitis (UC). Although endoscopy is the most immediate method for assessing intestinal mucosal damage, the consistency of inter- and intra-observer findings and diagnoses have been reported to vary considerably. Substantial experience is necessary to accurately assess the disease activity in UC, particularly as microscopic inflammation cannot be detected by using conventional endoscopy.
Autofluorescence imaging (AFI) videoendoscopy produces real-time pseudocolor images based on tissue autofluorescence emitted by excitation of endogenous tissue fluorophores. AFI has been used to highlight various lesions. There is no report on the change of hue related to AFI indicating extent and severity of UC activity.
AFI images were evaluated by analyzing the hue, and were scored relative to the abundance of red, green and blue color components of the RGB color model. As the green color components of AFI diminished, the mucosal inflammation was indicated to be more severe.
AFI appears to be an appropriate new approach and should be valuable for detecting inflammatory regions and approximately estimating the severity of inflammation in UC patients regardless of endoscopic experience, but based on the green color components of the RGB additive color model.
AFI is a novel technique for detecting the autofluorescence emitted by the gastrointestinal tissues, mainly from collagen type-I in the submucosal layer, in real time. In an AFI mode, excitation light (395-475 nm) for inducing autofluorescence, together with green light (550 nm) and red light (610 nm) for obtaining reflection images, are generated by a light source equipped with a 300W xenon arc lamp through a rotating filter. An excitation light cut filter is incorporated in the CCD for the AFI mode to allow only 490-625 nm light to reach the CCD.
The present study demonstrates some technical progress when the AFI pictures were scored in a new way and the green color component correlated to the inflammatory changes on a significant level. However, the difference between mild inflammation and severe inflammation was small (about 10% in the abundance of green light components) and therefore our attitude to the results and conclusion should be cautious. As a preliminary and pioneering work this could be accepted for publication.
Peer reviewers: Arjuna De Silva, Professor in Medicine, Department of Medicine, Faculty of Medicine, University of Kelaniya, PO Box 6, Tallagolla Road, 11010 Ragama, Sri Lanka; Jukka-Pekka Mecklin, MD, PhD, Professor, Surgeon-in-Chief, Department of Surgery, Jyvaskyla Central Hospital, 40620 Jyvaskyla, Finland
S- Editor Tian L L- Editor Logan S E- Editor Zheng XM
| 1. | Schroeder KW, Tremaine WJ, Ilstrup DM. Coated oral 5-aminosalicylic acid therapy for mildly to moderately active ulcerative colitis. A randomized study. N Engl J Med. 1987;317:1625-1629. [PubMed] |
| 2. | Osada T, Ohkusa T, Yokoyama T, Shibuya T, Sakamoto N, Beppu K, Nagahara A, Otaka M, Ogihara T, Watanabe S. Comparison of several activity indices for the evaluation of endoscopic activity in UC: inter- and intraobserver consistency. Inflamm Bowel Dis. 2010;16:192-197. [RCA] [PubMed] [DOI] [Full Text] [Cited by in Crossref: 54] [Cited by in RCA: 71] [Article Influence: 4.7] [Reference Citation Analysis (0)] |
| 3. | Osada T, Ohkusa T, Okayasu I, Yoshida T, Hirai S, Beppu K, Shibuya T, Sakamoto N, Kobayashi O, Nagahara A. Correlations among total colonoscopic findings, clinical symptoms, and laboratory markers in ulcerative colitis. J Gastroenterol Hepatol. 2008;23 Suppl 2:S262-S267. [RCA] [PubMed] [DOI] [Full Text] [Cited by in Crossref: 66] [Cited by in RCA: 68] [Article Influence: 4.0] [Reference Citation Analysis (0)] |
| 4. | Korelitz BI, Sommers SC. Responses to drug therapy in ulcerative colitis. Evaluation by rectal biopsy and histopathological changes. Am J Gastroenterol. 1975;64:365-370. [PubMed] |
| 5. | Florén CH, Benoni C, Willén R. Histologic and colonoscopic assessment of disease extension in ulcerative colitis. Scand J Gastroenterol. 1987;22:459-462. [PubMed] |
| 6. | Fochios SE, Korelitz BI. The role of sigmoidoscopy and rectal biopsy in diagnosis and management of inflammatory bowel disease: personal experience. Am J Gastroenterol. 1988;83:114-119. [PubMed] |
| 7. | Goldman H. Interpretation of large intestinal mucosal biopsy specimens. Hum Pathol. 1994;25:1150-1159. [PubMed] |
| 8. | Riley SA, Mani V, Goodman MJ, Dutt S, Herd ME. Microscopic activity in ulcerative colitis: what does it mean? Gut. 1991;32:174-178. [PubMed] |
| 9. | DaCosta RS, Wilson BC, Marcon NE. Optical techniques for the endoscopic detection of dysplastic colonic lesions. Curr Opin Gastroenterol. 2005;21:70-79. [RCA] [PubMed] [DOI] [Full Text] [Cited by in RCA: 1] [Reference Citation Analysis (0)] |
| 10. | Nakaniwa N, Namihisa A, Ogihara T, Ohkawa A, Abe S, Nagahara A, Kobayashi O, Sasaki J, Sato N. Newly developed autofluorescence imaging videoscope system for the detection of colonic neoplasms. Digest Endosc. 2005;17:235-240. [RCA] [DOI] [Full Text] [Cited by in Crossref: 21] [Cited by in RCA: 18] [Article Influence: 0.9] [Reference Citation Analysis (0)] |
| 11. | Asaoka D, Nagahara A, Kurosawa A, Osada T, Kawabe M, Hojo M, Yoshizawa T, Otaka M, Ohkusa T, Ogihara T. Utility of autofluorescence imaging videoendoscopy system for the detection of minimal changes associated with reflux esophagitis. Endoscopy. 2008;40 Suppl 2:E172-E173. [RCA] [PubMed] [DOI] [Full Text] [Cited by in Crossref: 4] [Cited by in RCA: 5] [Article Influence: 0.3] [Reference Citation Analysis (0)] |
| 12. | Inoue T, Uedo N, Ishihara R, Kawaguchi T, Kawada N, Chatani R, Kizu T, Tamai C, Takeuchi Y, Higashino K. Autofluorescence imaging videoendoscopy in the diagnosis of chronic atrophic fundal gastritis. J Gastroenterol. 2010;45:45-51. [RCA] [PubMed] [DOI] [Full Text] [Cited by in Crossref: 27] [Cited by in RCA: 30] [Article Influence: 1.9] [Reference Citation Analysis (0)] |
| 13. | Asaoka D, Nagahara A, Oguro M, Kurosawa A, Osada T, Kawabe M, Hojo M, Yoshizawa T, Otaka M, Ogihara T. Utility of autofluorescence imaging videoendoscopy in screening for Barrett's esophagus. Endoscopy. 2009;41 Suppl 2:E113. [RCA] [PubMed] [DOI] [Full Text] [Cited by in Crossref: 3] [Cited by in RCA: 4] [Article Influence: 0.3] [Reference Citation Analysis (0)] |
| 14. | Uedo N, Iishi H, Ishihara R, Higashino K, Takeuchi Y. Novel autofluorescence videoendoscopy imaging system for diagnosis of cancers in the digestive tract. Dig Endosc. 2006;18:S131-S136. [RCA] [DOI] [Full Text] [Cited by in Crossref: 9] [Cited by in RCA: 8] [Article Influence: 0.4] [Reference Citation Analysis (0)] |
| 15. | BARON JH, CONNELL AM, LENNARD-JONES JE. VARIATION BETWEEN OBSERVERS IN DESCRIBING MUCOSAL APPEARANCES IN PROCTOCOLITIS. Br Med J. 1964;1:89-92. [PubMed] |
| 16. | Feagan BG, Greenberg GR, Wild G, Fedorak RN, Paré P, McDonald JW, Dubé R, Cohen A, Steinhart AH, Landau S. Treatment of ulcerative colitis with a humanized antibody to the alpha4beta7 integrin. N Engl J Med. 2005;352:2499-2507. [PubMed] |
| 17. | Rachmilewitz D. Coated mesalazine (5-aminosalicylic acid) versus sulphasalazine in the treatment of active ulcerative colitis: a randomised trial. BMJ. 1989;298:82-86. [RCA] [PubMed] [DOI] [Full Text] [Cited by in Crossref: 2] [Cited by in RCA: 3] [Article Influence: 0.1] [Reference Citation Analysis (0)] |
| 18. | Geboes K. Pathology of inflammatory bowel diseases (IBD): variability with time and treatment. Colorectal Dis. 2001;3:2-12. [RCA] [PubMed] [DOI] [Full Text] [Cited by in Crossref: 2] [Cited by in RCA: 3] [Article Influence: 0.1] [Reference Citation Analysis (0)] |
| 19. | Jenkins D, Balsitis M, Gallivan S, Dixon MF, Gilmour HM, Shepherd NA, Theodossi A, Williams GT. Guidelines for the initial biopsy diagnosis of suspected chronic idiopathic inflammatory bowel disease. The British Society of Gastroenterology Initiative. J Clin Pathol. 1997;50:93-105. [PubMed] |


