Published online Jan 21, 2009. doi: 10.3748/wjg.15.310
Revised: November 5, 2008
Accepted: November 12, 2008
Published online: January 21, 2009
AIM: To determine the cytological and molecular effects of peroxisome proliferation-activated receptor (PPAR)-γ and PPAR-γ agonists on stomach cancer cells.
METHODS: To determine the proliferation-suppressive effects of troglitazone and ciglitazone, SNU-216 and SNU-668 stomach cancer cells were plated in media containing 40 &mgr;mol/L troglitazone and ciglitazone at a density of 1 × 10⁴ cells/well. After 3, 5 and 7 d, the cells were counted with a hemocytometer. To assess the appearance of PPAR-γ, a reverse-transcription polymerase chain reaction analysis was performed. On day 7, Western blotting was used to determine the effects of troglitazone and ciglitazone on the expression of p21 and phosphorylated-ERK (pERK) genes. Flow cytometry analysis was used to determine which portion of the cell cycle was delayed when troglitazone was used to suppress cell proliferation. In order to clarify the mechanism underlying the activity of troglitazone, microarray analysis was conducted.
RESULTS: PPAR-γ was manifested in both SNU-216 and SNU-668 cells. Ciglitazone and troglitazone suppressed cell growth, and troglitazone was a stronger suppressor of stomach cancer cells than ciglitazone, an inducer of cell cycle arrest in the G1 phase. SNU-668 cells were also determined to be more sensitive to ciglitazone and troglitazone than SNU-216 cells. When troglitazone and ciglitazone were administered to stomach cancer cells, levels of p21 expression were increased, but ERK phosphorylation levels were reduced. When GW9662, an antagonist of PPAR-γ, was applied in conjunction with ciglitazone and troglitazone, the cell growth suppression effect was unaffected. The gene transcription program revealed a variety of alterations as the consequence of troglitazone treatment, and multiple troglitazone-associated pathways were detected. The genes whose expression was increased by troglitazone treatment were associated with cell development, differentiation, signal transmission between cells, and cell adhesion, and were also associated with reductions in cell proliferation, the cell cycle, nuclear metabolism, and phosphorylation.
CONCLUSION: Troglitazone and ciglitazone suppress the proliferation of stomach cancer cells via a PPAR-γ-independent pathway.
- Citation: Cheon CW, Kim DH, Kim DH, Cho YH, Kim JH. Effects of ciglitazone and troglitazone on the proliferation of human stomach cancer cells. World J Gastroenterol 2009; 15(3): 310-320
- URL: https://www.wjgnet.com/1007-9327/full/v15/i3/310.htm
- DOI: https://dx.doi.org/10.3748/wjg.15.310
The peroxisome proliferator-activated receptors (PPARs) are members of the family of nuclear receptors[1], which themselves constitute a group in the steroid/thyroid hormone/retinoid receptor superfamily. Their action mechanisms induce the formation of a heterodimer after PPAR unites with its ligand and retinoid X receptor (RXR) in the nucleus, which subsequently activates the manifestation of genetic DNA by working on the transcription factors of promoter sites. Thus far, three subtypes, α, β/δ, and γ, have been identified, and an increasing quantity of research into PPAR-γ has been conducted since the initial detection of the composed ligand[2]. According to the research conducted over the last 10 years, PPAR-γ has been associated with novel functions in cell division and differentiation, functions crucial to inflammation, tissue resuscitation, vascular biology, cancer formation, and apoptosis[3]. As a result of these functions, the PPARs have been implicated as a treatment factor for diabetes mellitus, metabolic syndrome, atherosclerosis, and certain types of cancer[24]. PPAR-γ has been detected in a broad variety of cancers, including colon, breast, lung and prostate cancer. Ligands of PPAR-γ have been demonstrated to suppress the propagation of these cancers in vitro[5–8]. The results of this study suggest that many human malignant cancers may eventually be cured using PPAR-γ ligands. One well-known category of ligands is the thiazolidinediones (TZDs), which includes rosiglitazone, troglitazone, ciglitazone and 15-deoxy-prostaglandin-J2 (15d-PGJ2)[9].
Stomach cancer is one of the most common cancers worldwide. The condition is not so common in America and Europe, but is relatively common in Asia, and specifically in South Korea. A great many drugs already exist for treatment of stomach cancer, and these have already brought great improvements in survival rates and quality of life. However, there is currently no standard protocol by which personal sensitivity or resistance to treatment can be predicted. Lu et al[10] has previously reported that troglitazone suppresses stomach cancer via the activation of PPAR-γ, and in another study, it has been reported that stomach cancer is suppressed by PPAR-γ-ligand-mediated apoptosis[11].
The PPAR-γ ligand has two different pathways, one of which is PPAR-γ-dependent, and one PPAR-γ-independent[1012–18]. The relationship between the independent pathway and stomach cancer has been confirmed, for example, by the finding that the 15d-PGJ2-induced suppression of colon cancer cells can be achieved via the manifestation of Kruppel-like factor 4 (KLF4)[16].
The principal objective of the present study was to determine the mechanism underlying the activity of PPAR-γ. After we confirmed the activation of PPAR-γ in two types of stomach cancer cells and administration of ciglitazone and troglitazone, both of which induce PPAR-γ activation, we were able to make an observation about cell proliferation, confirm the effects of PPAR-γ suppressors, and clarify any genetic alterations via the use of cDNA microarrays.
We utilized troglitazone, ciglitazone, GW9662, propidium iodide, and dimethyl sulfoxide (DMSO) obtained from Sigma Co. (St. Louis, MO, USA), RPMI 1640, fetal bovine serum (FBS), 0.05% trypsin/0.02% EDTA, penicillin/streptomycin from Invitrogen Co. (Grand Island, NY, USA) and total-ERK, phosphorylated-ERK, and p21 antibody from Cell Signaling Technology Co. (Beverly, MA, USA). Troglitazone and ciglitazone solution was added at a concentration of 40 &mgr;mol/L per well. When adding the materials, we utilized DMSO solution and ensured identical conditions and DMSO concentration between the control and experimental groups.
The SNU-216 and SNU-668 stomach cancer cell strains were obtained from the Korean Cell Bank (Seoul National University Hospital, Cancer Institute, Seoul, Korea) and were used as cultured. Cell culture was carried out at 37°C in an atmosphere of 5% CO2 in RPMI 1640 medium supplemented with 10% FBS, 100 U/mL penicillin, and 100 &mgr;g/mL streptomycin.
In order to determine the proliferation-suppressive effects of troglitazone and ciglitazone, after washing a growth phase cell strain, we separated cells with 0.05% trypsin/0.02% EDTA. These cells were mixed thoroughly and cultured for 24 h in six-well plates at a concentration of 1 × 10⁴ cells/well. We verified the attachment of the cells to the plates, and then added 40 &mgr;mol/L troglitazone and ciglitazone to each 10% FBS medium. After 3, 5 and 7 d, we separated the proliferated cells with 0.05% trypsin/0.02% EDTA. These cells were counted with a hemocytometer and compared with the control group to assess the suppressive effects on cell growth.
After washing the cultured cells with Hank’s Buffered (or Balanced) Salt Solution (HBSS), we briefly mixed them with TRI Reagent (Sigma) and maintained them for 15 min at 4°C. We then mixed them one additional time with 200 &mgr;L chloroform and maintained them for an additional 5 min at 4°C. We then subjected the samples to centrifugation at a rate of 12000 rpm at 4°C, transferred the upper layer to a new tube and added an equal volume of isopropanol. This tube was maintained for 5 min at 4°C, and then centrifuged. The samples were dried and dissolved in diethylpyrocarbonate (DEPC)/distilled water, after washing the centrifuged pellets with DEPC/70% ethanol. The RNA was quantitated after determining the optical density at 260 nm, after which the reverse transcription reaction was conducted. Distilled water was added and settled with buffer (Promega, MO, USA) with 20 &mgr;mol/L dNTP, 0.25 &mgr;g oligo (dT) 15 primer, 5 U Avian Myoblastosis Virus (Promega), reverse transcriptase (Promega) and 2 &mgr;g RNA and DEPC. We established the total quantity at 20 &mgr;L and the reaction was performed for 60 min at 42°C.
We used an AccuPower PCR Premix (BIONEER, Seoul, Korea) kit. After the reverse transcription reaction was finished, we added 1 &mgr;L RT product and 10 pmol sense and antisense primers into the tube provided in the kit. We established the total volume at 20 &mgr;L with distilled water and initiated the PCR.
After washing the cultured cells in HBSS, the cells were lysed in lysis buffer and then placed on ice for 30 min. The protein was extracted by centrifuging this solution. We then added 4 × loading buffer to the protein standard marker and to each protein (5 &mgr;g/&mgr;L), and then denatured them for 7 min at 95°C. Electrophoresis was conducted for 2 h at 100 V on 4% and 10% SDS-polyacrylamide gels. After electrophoresis, we placed the gel in transfer buffer (25 mmol/L Tris, 192 mmol/L glycine, 20% methanol) for 15 min, and then transferred it to nitrocellulose (NC) membrane for 1 h at 20 V. In order to prevent non-specific antibody binding, we placed the NC membrane in blocking solution, 5% non-fat milk dissolved in Tris-buffered saline (TBS), and incubated the reactions with slight shaking. We then placed them into prepared primary antibody diluted 1/1000 with TBS/Tween buffer (TBS buffer with 0.02% Tween 20) including 5% non-fat milk, and then added it to the NC membranes overnight at 4°C. The samples were washed three times for 10 min each. We diluted the secondary antibody, anti-rabbit IgG in 5% non-fat milk to dilute it 1/1000, immersed the NC membrane in this solution with shaking for 90 min, and then washed the samples three times with TBS/Tween buffer for 10 min each. We subjected the NC membranes to enhance chemiluminescence (Amersham, Buckinghamshire, UK) for 5 min, exposed them to light for 10 min in a darkroom, and then detected the signals on the films. After visual certification of the luminosity and intensity of the bands, we quantified the intensity of the bands using a Gel Image Analysis System (UVItec, Cambridge, UK).
We conducted flow cytometry analysis to determine which portion of the cell cycle was delayed when we used troglitazone to suppress the proliferation of SNU-216 and SNU-668 cells. Cultured SNU-216 and SNU-668 cell strains were washed in HBSS. We then added 40 &mgr;mol/L troglitazone, and fixed the cultures for 30 min with 70% ethanol at 4°C. After fixation, we degraded the RNA with RNase A (Sigma) and dyed the DNA with propidium iodide in order to prepare intercalated DNA. The cell cycles were compared and analyzed using a Becton-Dickinson FACStar Flow Cytometer and Becton-Dickinson Cell Fit Software (Becton-Dickinson, Erenbode, Belgium).
Microarray analysis was conducted using an Illumina BeadStation 500 X manual system, obtained from Microgen Co. (Seoul, Korea). We prepared the biotinylated cRNA with an Illumina Amplification Kit (Ambion, CA, USA), and refined it with an RNeasy Kit (Qiagen, CA, USA). Hybridization was conducted with a Sentrix HumanRef-8 Expression BeadChip system (Illumina, CA USA), which included approximately 24000 probes, and conducted lavation in accordance with the manufactures instructions, followed by scanning with a confocal laser scanner (Nikon Precision Korea, Yong-In, Korea). We then conducted statistical analysis using Avadis Prophetic software, version 3.3 (Strand Genomics, Bangalore, India).
One-way analysis of variance and Fisher’s LSD test were used to compare statistical differences between each group, and a P value < 0.05 was considered significant for all statistical analyses.
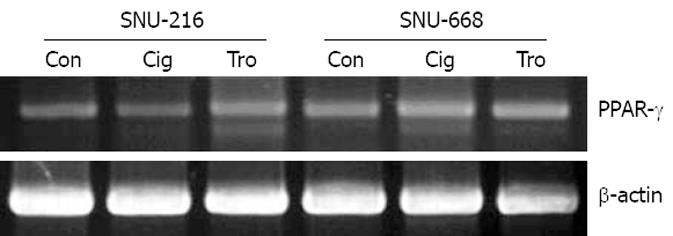
As a result of the manifestation of PPAR-γ in stomach cancer cells SNU-216 and SNU-668 using RT-PCR, both cells were confirmed to be positive, and no significant differences were detected (Figure 1). Additionally, the difference in the degree of manifestations was not significantly different when troglitazone and ciglitazone were applied at 40 &mgr;mol/L for 7 d, and the manifestations of PPAR-γ were assessed via RT-PCR (Figure 1).
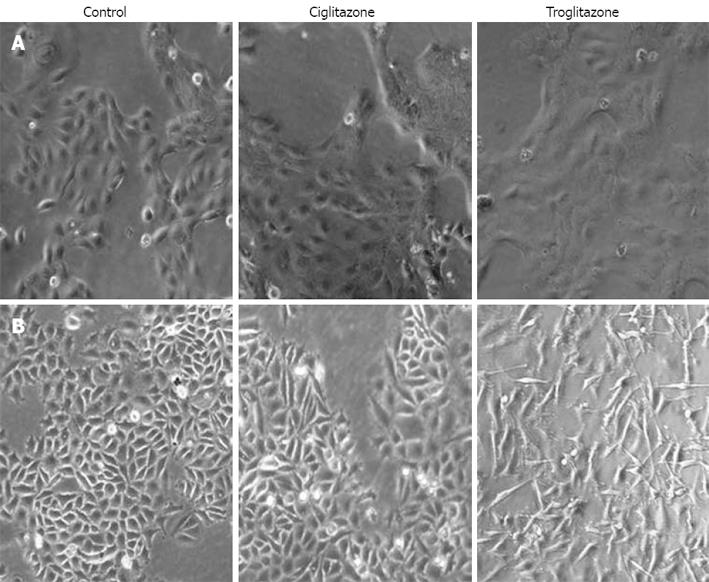
We observed cell morphology after exposing SNU-216 and SNU-668 cells to 40 &mgr;mol/L troglitazone and ciglitazone for 7 d. The SNU-216 cells showed no significant morphological changes after treatment with the two compounds. On the contrary, the SNU-668 cells demonstrated morphological changes after 2 d troglitazone, but not ciglitazone, treatment; the cells were lengthened at both ends, and assumed a spindle-type morphology (Figure 2).
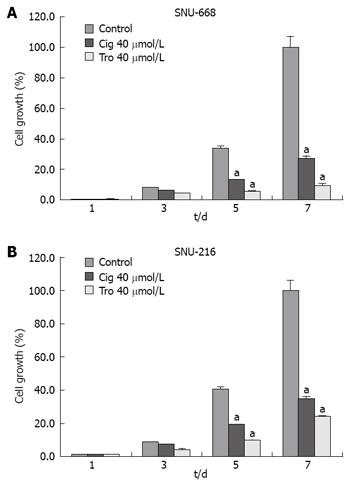
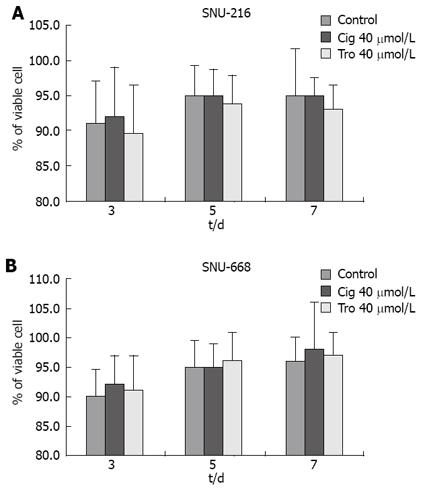
In order to assess the suppressive effects of troglitazone and ciglitazone on the proliferation of SNU-216 and SNU-668 cells, we cultured the cells for 24 h on six-well plates at 1 × 10⁴ cells/well. We added troglitazone and ciglitazone to the medium, and cultured the cells again. We counted the number of cells at 3, 5 and 7 d after culturing. The growth rate of the SNU-216 cells was reduced at 3, 5 and 7 d after troglitazone treatment, and the cell count percentages were 45%, 24% and 24%, as compared with the control group. The growth rate of the SNU-668 cells was reduced on the same days by troglitazone treatment, by 49%, 15% and 9%. However, with ciglitazone treatment, the growth rate of the SNU-688 strain was reduced less profoundly, and the percentages of the cell count were 77%, 38% and 27%. As a result, troglitazone appeared to exert a more profound suppressive effect than did ciglitazone (Figure 3). Ciglitazone and troglitazone treatment did not significantly affect SNU-216 and SNU-668 cell death (Figure 4).
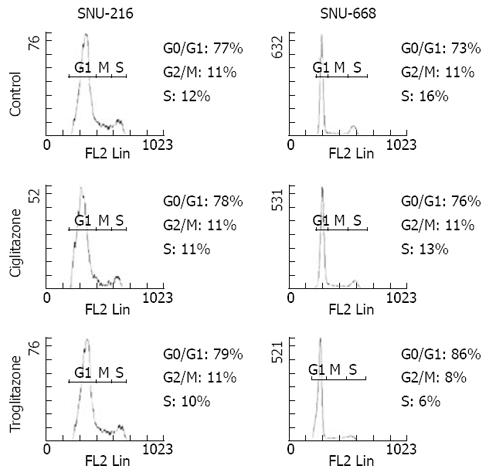
We assessed the cell cycles of the two groups. One group was SNU-216 and SNU-668 cells cultured in media to which 40 &mgr;mol/L troglitazone and ciglitazone was added, and the other group was a control group that was cultured without any drug treatment. In the SNU-216 cells, each of the G0/G1 phases were 77%, 78% and 79%, the S phases were all 11%, and the G2/M phases were 12%, 11% and 10%. However, in the SNU-668 cells, the G0/G1 phases of each group were 73%, 76% and 86%, the S phases were 11%, 11% and 8%, and the G2 phases were 16%, 12% and 6% (Figure 5).
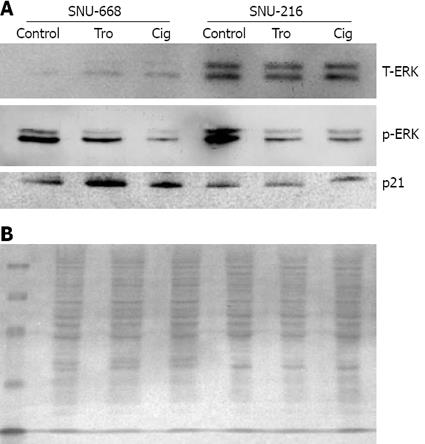
We cultured SNU-216 and SNU-668 cells at a concentration of 1 × 10⁴ cells/well on six-well plates for 24 h, and added troglitazone and ciglitazone at levels of up to 40 &mgr;mol/L for 7 d. On day 7, we conducted Western blotting after extracting the proteins with from the cultured cells for 7 d, and assessed the density of the bands via image analysis. As a result of the expression of p21, we noted no significant interval changes before and after drug treatment in SNU-216 cells. In SNU-668 cells, we noted an increase of approximately 2.8-fold with troglitazone, and a 1.6-fold increase with ciglitazone. Phosphorylation of ERK was significantly reduced by ciglitazone and troglitazone (Figure 6).
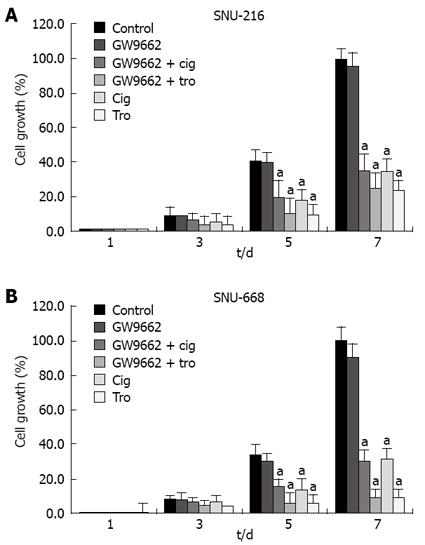
In order to evaluate the association between the suppressive effects of cell growth with identical levels of troglitazone, ciglitazone and PPAR-γ activation, we confirmed the effects of GW9662[19], which has been previously identified as a selective PPAR-γ suppressor. After culturing the solution at 1 × 10⁴ cells/well in six-well plates, we added antagonist 5 &mgr;mol/L GW9662, 5 &mgr;mol/L GW9662 + 40 &mgr;mol/L ciglitazone, 5 &mgr;mol/L GW9662 + 40 &mgr;mol/L troglitazone to each medium, and counted the cells 3, 5, and 7 d later. The suppressive effects of 40 &mgr;mol/L troglitazone and ciglitazone was not influenced by treatment with 5 &mgr;mol/L GW9662 (Figure 7).
To elucidate the mechanism underlying the activity of troglitazone, we evaluated the troglitazone-induced changes in gene expression, via the microarray technique. We verified these changes, and found that expression of 388 genes was increased by more than two-fold, and 466 were reduced by more than two-fold. According to the analysis of genetic functions with genetic manifestation by PANTHER (Protein Analysis Through Evolutionary Relationsips) Classification System (SRI international, CA, USA), cell cycle, DNA metabolism, somatic cell division, replication, and DNA repair were suppressed to a significant degree. However, signal transduction and homeostasis were increased (Table 1). In an effort to determine the categories of biological processes affected by troglitazone treatment, we conducted functional annotation analyses using DAVID bioinformatic tools[20], with the genes whose expression was altered more than two-fold. The results of this analysis reveal a distinct distribution of biological processes between these genes (Tables 2 and 3). The expression of genes associated with signal transmission for cell communication, growth, differentiation, and cell adhesion was increased. Additionally, expression of genes associated with cell proliferation, the cell cycle, nuclear metabolism and phosphorylation was also reduced. The functional differences between the increased and reduced genes were confirmed by the changes in the KEGG pathway, as detected by DAVID analysis. The pathway underlying the reductions in the levels of these genes was associated with the cell cycle, DNA polymerase, and purine and pyrimidine metabolism, the effects of which on the genes with increased expression was not confirmed (Table 4).
| Biological process | Number | Over/under | Pvalue |
| Cell cycle | 116 | - | 3.510E-13 |
| DNA metabolism | 57 | - | 1.150E-09 |
| Mitosis | 38 | - | 1.060E-07 |
| DNA replication | 38 | - | 7.350E-06 |
| DNA repair | 23 | - | 1.110E-03 |
| Cell surface receptor mediated signal transduction | 52 | + | 1.850E-03 |
| Cytokinesis | 10 | - | 3.280E-03 |
| Chromosome segregation | 14 | - | 3.300E-03 |
| Homeostasis | 14 | + | 9.100E-03 |
| Signal transduction | 133 | + | 1.230E-02 |
| Transport | 41 | + | 1.740E-02 |
| Nucleoside, nucleotide and nucleic acid metabolism | 165 | - | 1.800E-02 |
| Term | Count | Pvalue | Genes |
| Negative regulation of cellular process | 29 | 2.26E-04 | ANGPTL4, ZFHX1B, MXD4, CXCL1, GPNMB, CDKN1A, IRF1, SESN2, JAZF1, FTH1, IL6, SVIL, JARID1B, MN1, DDIT3, PPP1R15A, IER3, ARHGEF2, TNFAIP3, RHOB, PRDM1, QSCN6, BNIP3L, MAP4, NRG1, EREG, FAIM3, IL8, FST |
| Response to chemical stimulus | 20 | 1.91E-04 | CCL20, PLD1, STC2, APOE, DEFB1, PLAU, CXCL1, SEMA3C, SRXN1, CCL5, SOD2, HSPA6, STC1, CXCL2, NDRG1, DNAJB2, IL8, MVP, ECGF1, ARNT2 |
| Chemotaxis | 8 | 0.009882707 | CCL20, PLD1, CXCL2, CXCL1, PLAU, IL8, ECGF1, CCL5 |
| Negative regulation of cell proliferation | 9 | 0.009171778 | FTH1, IL6, MXD4, EREG, CXCL1, IL8, GPNMB, CDKN1A, QSCN6 |
| Programmed cell death | 22 | 0.002544517 | SQSTM1, TNFRSF21, PPP1R15A, APOE, ANGPTL4, IER3, TNFAIP3, RHOB, TNFRSF10A, ROCK1, HIPK2, CDKN1A, BNIP3L, C10orf97, IL6, RRAGC, APP, PHLDA2, RIPK2, FAIM3, IL24, TRIB3 |
| Development | 62 | 9.62E-06 | SERPINE2, CXCL1, PHGDH, EPC1, MSX1, IL6, SLC3A2, COL7A1, IFRD1, NAV1, LIF, IER3, ARHGEF2, RHOB, DHRS9, PKD1, VAT1, SEMA3C, QSCN6, ANPEP, LTBP4, EDG3, SOX9, SQSTM1, PTGS2, IGF2BP3, FBN1, DNER, IGFBP5, CTGF, ANGPTL4, APOE, ZFHX1B, CSPG2, IL11, KLF6, RRAGC, S100P, NDRG1, SVIL, PNMA1, DACT1, CYP1B1, WNT5A, MAFB, PDLIM7, LAMA4, CRMP1, PAPPA, CAMTA1, RUNX1, KRTHA4, EREG, GPR56, NRG1, FST, IL8, DCN, ECGF1, ARNT2, NRP1, ITGA2 |
| Organelle organization and biogenesis | 28 | 0.005845300 | WASPIP, APOE, HIST1H1C, CXCL1, EPC1, SVIL, MICAL1, H2BFS, HIST2H2AA, FMNL2, TINF2, PLEC1, TUBA1, HIST2H2BE, ARHGEF2, RHOF, ROCK1, TMOD1, HIST1H2BK, RHOB, SLC22A4, FSCN1, HIST1H2BD, ATG4A, KIF1A, MAP4, ECGF1, KLHL5 |
| Inflammatory response | 12 | 0.002509065 | CCL20, PTGS2, CXCL2, PLA2G4C, CEBPB, EDG3, CXCL1, RIPK2, IL8, TNFAIP6, IRAK2, CCL5 |
| Organ development | 21 | 0.003134980 | FBN1, ANGPTL4, PDLIM7, RHOB, PHGDH, IL11, ANPEP, MSX1, IL6, KLF6, SVIL, EREG, GPR56, SOX9, DCN, IL8, ECGF1, CYP1B1, NRP1, ITGA2, IFRD1 |
| Transcription from RNA polymerase II promoter | 17 | 0.024568720 | SQSTM1, TRAK1, TSC22D1, DDIT3, MAFF, MXD4, IRF1, PRDM1, ATBF1, JAZF1, SOD2, FOXF1, NFIL3, RUNX1, STAT5A, CEBPB, SOX9 |
| Cellular morphogenesis | 12 | 0.016732354 | KLF6, RRAGC, CTGF, IGFBP5, APOE, LTBP4, ARHGEF2, SLC3A2, VAT1, NRP1, QSCN6, EPC1 |
| Blood vessel morphogenesis | 7 | 0.002345097 | ANPEP, ANGPTL4, EREG, RHOB, IL8, ECGF1, NRP1 |
| Response to wounding | 20 | 2.23E-04 | CCL20, PTGS2, CTGF, PLA2G4C, PLAU, CXCL1, TNFAIP6, CCL5, SOD2, IL11, CXCL2, CEBPB, EREG, EDG3, RIPK2, FAIM3, IL8, SERPINE1, IRAK2, ITGA2 |
| Apoptosis | 22 | 0.002437855 | SQSTM1, TNFRSF21, PPP1R15A, APOE, ANGPTL4, IER3, TNFAIP3, RHOB, TNFRSF10A, ROCK1, HIPK2, CDKN1A, BNIP3L, C10orf97, IL6, RRAGC, APP, PHLDA2, RIPK2, FAIM3, IL24, TRIB3 |
| Cell-cell signaling | 24 | 2.63E-04 | CCL20, PBEF1, STC2, APOE, STX1A, LIF, GDF15, MAOA, TNFAIP6, GRB10, CCL5, IL11, STC1, GABARAPL1, IL6, LTBP4, EREG, GPR56, EFNA1, FST, IL8, ECGF1, NRP1, WNT5A |
| Response to stress | 35 | 0.003636369 | SQSTM1, CCL20, PTGS2, ERRFI1, PLA2G4C, CTGF, ANGPTL4, APOE, CXCL1, CD83, SRXN1, TNFAIP6, CCL5, IL11, SOD2, HSPA6, IL6, CD55, CEBPB, DNAJB2, SERPINE1, CFB, PPP1R15A, DDIT3, DEFB1, PLAU, CXCL2, EREG, EDG3, RIPK2, FAIM3, IL8, ARNT2, IRAK2, ITGA2 |
| Vasculature development | 7 | 0.002345097 | ANPEP, ANGPTL4, EREG, RHOB, IL8, ECGF1, NRP1 |
| Regulation of cell proliferation | 16 | 6.45E-04 | PBEF1, LIF, MXD4, ARHGEF2, CXCL1, GPNMB, CDKN1A, QSCN6, IL11, IRS2, FTH1, IL6, EREG, EDG3, IL8, NRP1 |
| Cell organization and biogenesis | 47 | 0.001133913 | SQSTM1, TRAK1, WASPIP, STX3A, IGFBP5, CTGF, APOE, HIST1H1C, CXCL1, DNAJC12, EPC1, GABARAPL1, KLF6, RRAGC, SVIL, LARP6, MICAL1, HIST2H2AA, H2BFS, SLC3A2, FMNL2, TINF2, PLEC1, STX1A, TUBA1, DUSP16, HIST2H2BE, STX11, RHOF, ARHGEF2, RHOB, HIST1H2BK, TMOD1, ROCK1, SLC22A4, VAT1, FSCN1, QSCN6, BET1, HIST1H2BD, ATG4A, KIF1A, LTBP4, MAP4, ECGF1, KLHL5, NRP1 |
| Cell differentiation | 21 | 0.001730483 | SQSTM1, PTGS2, APOE, ANGPTL4, PDLIM7, SERPINE2, RHOB, DHRS9, PAPPA, IL11, ANPEP, IL6, KLF6, NDRG1, LTBP4, EREG, NRG1, ECGF1, ARNT2, NRP1, IFRD1 |
| Behavior | 11 | 0.004559090 | CCL20, PLD1, CXCL2, APOE, MAOA, PI3, CXCL1, PLAU, IL8, ECGF1, CCL5 |
| Angiogenesis | 7 | 0.001885665 | ANPEP, ANGPTL4, EREG, RHOB, IL8, ECGF1, NRP1 |
| Nucleosome assembly | 7 | 0.007444314 | HIST1H2BD, HIST2H2AA, HIST2H2BE, H2BFS, HIST1H1C, HIST1H2BK, SLC22A4 |
| Cell adhesion | 24 | 0.00542196 | CLDN12, CTGF, LAMA4, CSPG2, RHOB, PKD1, CLDN1, TNFAIP6, CCL5, TPBG, KIAA0319, APP, ITGA5, LPP, GPR56, VTN, NID2, MYO10, IL8, COL7A1, MSLN, NRP1, ITGA3, ITGA2 |
| Morphogenesis | 27 | 8.06E-05 | IGF2BP3, IGFBP5, CTGF, ANGPTL4, APOE, EPC1, MSX1, KLF6, RRAGC, SLC3A2, WNT5A, IER3, ARHGEF2, DHRS9, PKD1, RHOB, VAT1, QSCN6, ANPEP, LTBP4, EREG, EDG3, IL8, DCN, ECGF1, NRP1, ITGA2 |
| Taxis | 8 | 0.009882707 | CCL20, PLD1, CXCL2, CXCL1, PLAU, IL8, ECGF1, CCL5 |
| Glutamine family amino acid metabolism | 5 | 0.007880038 | GLS, GCLC, GFPT2, ASS, ASNS |
| Term | Count | Pvalue | Genes |
| Mitotic sister chromatid segregation | 10 | 1.61E-10 | CDCA5, KNTC2, CNAP1, DLG7, NUSAP1, HCAP-G, SMC4L1, CENPE, SMC2L1, ESPL1 |
| Phosphorylation | 32 | 6.36E-04 | CDK6, CCL2, BUB1, INHA, CDC7, PKMYT1, GSG2, PBK, BUB1B, CHEK1, LOC91461, MASTL, WEE1, AURKB, MXRA5, PKN3, VRK1, CIT, PRKCE, PLK2, MELK, PASK, TTK, NEK2, EME1, NUAK2, CDC2, CDK2, CDK4, MAP2K6, PLK1, PLK4 |
| Mitotic chromosome condensation | 6 | 2.73E-06 | CDCA5, CNAP1, NUSAP1, HCAP-G, SMC4L1, SMC2L1 |
| Mitosis | 44 | 4.68E-37 | KIF2C, CENPF, BUB1, SPAG5, DLG7, ACTG1, PKMYT1, CDC6, HCAP-G, MAD2L1, CCNB1, PBK, CCNF, BUB1B, ESPL1, CCNB2, WEE1, CNAP1, KIF23, SGOL1, CIT, CDC25A, TPX2, ASPM, SMC4L1, SMC2L1, MPHOSPH1, TTK, NEK2, CDC2, CDK2, CCNA2, CDC25C, PTTG1, KNTC1, KIF15, PLK1, CDCA5, CDC20, KNTC2, NUSAP1, ANLN, UBE2C, CENPE |
| Phosphoinositide-mediated signaling | 13 | 8.33E-08 | CKS2, RFC4, HMGB2, HIST1H4C, TYMS, SPAG5, BUB1B, TOP2A, KNTC2, ZWINT, PCNA, UBE2C, FEN1 |
| Response to DNA damage stimulus | 43 | 1.78E-25 | RFC4, CHAF1B, FANCL, POLD3, NUDT1, UHRF1, EXO1, CHEK1, LIG1, BRCA1, TOP2A, POLE2, RAD54L, GTSE1, POLE, PCNA, RAD51, MDC1, UIP1, RAD51AP1, HMGB2, RPA1, TYMS, POLQ, NEIL3, CCNA2, CHAF1A, PTTG1, MAP2K6, RFC5, FANCG, RPA3, FANCB, XRCC3, H2AFX, TOPBP1, RECQL4, BLM, RAD51C, POLD1, FANCD2, APEX2, FEN1 |
| Traversing start control point of mitotic cell cycle | 5 | 2.73E-06 | CDC7, CDC6, CDC2, CDK2, CDC25C |
| Regulation of DNA replication | 5 | 2.14E-04 | GMNN, CDC6, CDK2, CDT1, PCNA |
| Regulation of DNA metabolism | 7 | 6.56E-05 | BRCA1, GMNN, CDC6, CDK2, CDT1, PCNA, RAD51 |
| Phosphate metabolism | 35 | 1.83E-03 | CDK6, CCL2, BUB1, INHA, CDC7, PKMYT1, GSG2, CDKN3, PBK, BUB1B, CHEK1, LOC91461, MASTL, WEE1, AURKB, MXRA5, PKN3, VRK1, CIT, CDC25A, PRKCE, MELK, PLK2, PASK, TTK, NEK2, EME1, NUAK2, CDC2, CDK2, CDC25C, CDK4, MAP2K6, PLK4, PLK1 |
| Organelle organization and biogenesis | 44 | 7.49E-08 | CKS2, KRT8, PRC1, KIF2C, CENPF, SUV39H1, CHAF1B, SPAG5, EZH2, KIF14, HCAP-G, KIF4A, DIAPH3, BUB1B, ESPL1, BRCA1, ACD, HIST1H2BH, CNAP1, KIF23, CBX1, ZWINT, GTSE1, KIF11, SMC4L1, SMC2L1, EXOSC2, MPHOSPH1, STMN1, TTK, HMGB2, HIST1H4C, CENPA, KIF20A, CHAF1A, KIF15, CDCA5, H2AFX, KNTC2, MGC39900, NUSAP1, UBE2C, CENPE, C9orf48 |
| Organelle localization | 6 | 1.62E-06 | CENPF, CDCA5, DLG7, NUSAP1, CENPE, ESPL1 |
| Microtubule-based process | 22 | 7.74E-11 | STMN1, CKS2, PRC1, KIF2C, TTK, SPAG5, KIF14, KIF4A, KIF20A, BUB1B, ESPL1, KIF15, KNTC2, KIF23, NUSAP1, ZWINT, GTSE1, KIF11, UBE2C, CENPE, C9orf48, MPHOSPH1 |
| Sister chromatid segregation | 10 | 2.68E-10 | CDCA5, KNTC2, CNAP1, DLG7, NUSAP1, HCAP-G, SMC4L1, CENPE, SMC2L1, ESPL1 |
| Regulation of cyclin dependent protein kinase activity | 10 | 1.66E-07 | CHEK1, CKS2, CDK5RAP3, PKMYT1, BCCIP, CDC6, CDC25A, CDKN3, CCNA2, CDC25C |
| Deoxyribonucleotide biosynthesis | 3 | 6.19E-03 | RRM2, TYMS, DTYMK |
| Response to stress | 56 | 1.70E-09 | CCL2, EXO1, LIG1, RAD54L, BST1, GTSE1, POLE, MDK, TYMS, POLQ, NEIL3, CCNA2, PTTG1, RFC5, FANCG, RPA3, FANCB, XRCC3, H2AFX, RECQL4, HSPA2, FANCD2, APEX2, RFC4, CHAF1B, INHA, FANCL, POLD3, NUDT1, UHRF1, FOS, CHEK1, BRCA1, TOP2A, GP1BB, POLE2, PCNA, RAD51, MDC1, UIP1, RAD51AP1, FOXM1, HMGB2, RPA1, CHAF1A, MAP2K6, CFH, TOPBP1, CD14, NR3C1, BLM, CLEC2D, RAD51C, POLD1, FEN1, PRDX2 |
| Metaphase plate congression | 3 | 2.55E-03 | CENPF, CDCA5, CENPE |
| Regulation of transferase activity | 12 | 1.44E-04 | CHEK1, CKS2, CDK5RAP3, TPD52L1, PKMYT1, BCCIP, CDC6, CDC25A, CDKN3, CCNA2, CDC25C, RGS4 |
| DNA strand elongation | 3 | 4.18E-03 | PRIM1, RFC4, RFC3 |
| Cell proliferation | 37 | 9.94E-10 | CKS2, CDK6, KIF2C, CENPF, BUB1, CDC7, SKP2, DLG7, CDC6, CDKN3, DTYMK, BUB1B, CHEK1, STIL, BRCA1, CDKN2C, CDC25A, TPX2, PCNA, IFITM1, TTK, CDK5RAP3, MDK, MKI67, CDK2, CDC25C, ADAMTS1, TSPAN3, CDK4, CDCA7, CYR61, KIF15, CDCA7L, HDGF, PLK1, E2F1, UBE2C |
| Establishment of organelle localization | 6 | 4.57E-07 | CENPF, CDCA5, DLG7, NUSAP1, CENPE, ESPL1 |
| Cell organization and biogenesis | 59 | 6.71E-06 | PRC1, KIF2C, SUV39H1, DLG7, HCAP-G, DIAPH3, ESPL1, ACD, CNAP1, KIF23, CBX1, THOC4, KIF11, GTSE1, EXOSC2, MPHOSPH1, STMN1, IL17RB, CENPA, CYR61, H2AFX, KNTC2, NUSAP1, HNRPA1, C9orf48, SLC25A10, NUP107, CKS2, KRT8, CENPF, CHAF1B, SPAG5, EZH2, KIF14, KIF4A, BUB1B, BRCA1, HIST1H2BH, TRIP6, ZWINT, SMC4L1, SMC2L1, TTK, KAZALD1, HMGB2, HIST1H4C, RANBP1, IGFBP3, TMEM97, KIF20A, CHAF1A, SORT1, KIF15, PPIH, CDCA5, MGC39900, UBE2C, WISP2, CENPE |
| Regulation of kinase activity | 12 | 1.35E-04 | CHEK1, CKS2, CDK5RAP3, TPD52L1, PKMYT1, BCCIP, CDC6, CDC25A, CDKN3, CCNA2, CDC25C, RGS4 |
| DNA repair | 40 | 3.75E-24 | RFC4, CHAF1B, FANCL, POLD3, NUDT1, UHRF1, EXO1, CHEK1, LIG1, BRCA1, TOP2A, POLE2, RAD54L, POLE, PCNA, RAD51, MDC1, UIP1, RAD51AP1, HMGB2, RPA1, TYMS, POLQ, NEIL3, CHAF1A, PTTG1, RFC5, FANCG, RPA3, FANCB, XRCC3, H2AFX, TOPBP1, RECQL4, BLM, RAD51C, POLD1, FANCD2, APEX2, FEN1 |
| DNA recombination | 11 | 3.91E-06 | CHEK1, LIG1, XRCC3, H2AFX, RPA1, BLM, RAD51C, RAD54L, RAD51, RAD51AP1, EXO1 |
| Protein complex assembly | 14 | 7.55E-03 | CENPF, HMGB2, CHAF1B, HIST1H4C, SLC7A6, MPP2, CENPA, CHAF1A, KNTC1, PPIH, H2AFX, HIST1H2BH, RAD51, CENPE |
| Establishment of chromosome localization | 4 | 8.79E-05 | CENPF, CDCA5, DLG7, CENPE |
| Chromosome segregation | 15 | 1.42E-14 | CENPF, DLG7, HCAP-G, PTTG1, SGOL2, ESPL1, CDCA5, KNTC2, CNAP1, SGOL1, NUSAP1, CDCA1, SMC4L1, SMC2L1, CENPE |
| Chromosome organization and biogenesis | 19 | 9.65E-05 | CENPF, SUV39H1, HMGB2, CHAF1B, HIST1H4C, EZH2, HCAP-G, CENPA, CHAF1A, CDCA5, ACD, H2AFX, CNAP1, HIST1H2BH, CBX1, NUSAP1, SMC4L1, SMC2L1, CENPE |
| DNA integrity checkpoint | 6 | 2.66E-05 | CHEK1, CDC6, GTSE1, CDT1, CCNA2, CDC45L |
| Chromosome localization | 4 | 8.79E-05 | CENPF, CDCA5, DLG7, CENPE |
| Spindle organization and biogenesis | 11 | 4.01E-12 | CKS2, STMN1, PRC1, TTK, KNTC2, SPAG5, KIF23, ZWINT, KIF11, UBE2C, BUB1B |
| Protein amino acid phosphorylation | 30 | 8.41E-05 | CDK6, CCL2, BUB1, CDC7, PKMYT1, GSG2, PBK, BUB1B, LOC91461, MASTL, CHEK1, WEE1, AURKB, MXRA5, PKN3, VRK1, CIT, PRKCE, PLK2, MELK, PASK, TTK, NEK2, NUAK2, CDC2, CDK2, CDK4, MAP2K6, PLK1, PLK4 |
| Chromosome condensation | 6 | 9.81E-06 | CDCA5, CNAP1, NUSAP1, HCAP-G, SMC4L1, SMC2L1 |
| Cell cycle | 97 | 2.18E-51 | PRC1, KIF2C, CDC7, GSG2, CDKN3, HCAP-G, ESPL1, LIG1, MCM5, TPD52L1, CNAP1, KIF23, RAD54L, GTSE1, STMN1, NEK2, E2F2, CDK4, SGOL2, KNTC1, PLK1, H2AFX, CKS1B, BCCIP, NUSAP1, ANLN, CKS2, CENPF, CHAF1B, ACTG1, CDC6, PBK, CHEK1, ZWINT, ASPM, RAD51, MDC1, SMC4L1, TTK, MKI67, CDK2, MCM7, KIF15, MAP2K6, CDCA5, E2F1, BIRC5, UBE2C, BUB1, PKMYT1, ILF3, DLG7, DTYMK, MAD2L1, WEE1, SGOL1, CIT, KIF11, RBL1, MPHOSPH1, MDK, CCNA2, CDT1, PTTG1, CDC45L, FANCG, PLK4, MCM3, KNTC2, GMNN, HSPA2, FANCD2, CDK6, INHA, SKP2, SPAG5, UHRF1, CCNB1, CCNF, BUB1B, CCNB2, BRCA1, CDKN2C, AURKB, TPX2, CDC25A, PCNA, SMC2L1, IFITM1, CDK5RAP3, MCM2, CDC2, CDC25C, MCM6, CHAF1A, CDC20, CENPE |
| Spindle checkpoint | 3 | 4.18E-03 | TTK, CENPF, BUB1 |
| Cytoskeleton organization and biogenesis | 25 | 4.74E-06 | CKS2, KIF2C, PRC1, KRT8, SPAG5, KIF14, KIF4A, DIAPH3, BUB1B, ESPL1, KIF23, KIF11, GTSE1, ZWINT, MPHOSPH1, STMN1, TTK, KIF20A, KIF15, KNTC2, NUSAP1, MGC39900, UBE2C, C9orf48, CENPE |
| Chromatin assembly or disassembly | 9 | 8.89E-03 | SUV39H1, HIST1H4C, CHAF1B, HMGB2, H2AFX, HIST1H2BH, CBX1, CENPA, CHAF1A |
| Nucleobase, nucleoside, nucleotide and nucleic acid metabolism | 121 | 1.16E-08 | SUV39H1, Pfs2, ADARB1, ATOH8, CDC7, TAF5, CITED4, TK1, HMG1L1, EXO1, PRIM1, LIG1, MCM5, TPD52L1, ATPIF1, PAPSS2, CBX1, RAD54L, POLE, ORC6L, EXOSC2, IQGAP3, RRM2, ORC1L, TRIP13, E2F2, POLQ, ITGB3BP, CENPA, NEIL3, CHTF18, RRM1, KNTC1, RNASEH2A, ID3, RFC5, FANCB, XRCC3, H2AFX, GATA2, HNRPA1, DMBX1, NASP, RFC4, RFC2, CENPF, CHAF1B, PAICS, POLD3, CDC6, SREBF1, CHEK1, GNE, MCM4, MXD3, RAD51, MDC1, UIP1, RAD51AP1, TIMELESS, FOXM1, EME1, SLBP, HIST1H4C, CDK2, HAT1, MCM7, NR3C1, DNMT1, BLM, RAD51C, E2F1, POLD1, FEN1, ILF3, SNRPA, DTYMK, RAB26, ZNF488, THOC4, RBL1, TYMS, RPA2, CDT1, PTTG1, CDC45L, FANCG, RPA3, HOXA2, GMNN, MCM3, RECQL4, FANCD2, POLA2, APEX2, FANCL, EZH2, NUDT1, PHF19, UHRF1, FOS, POLR3K, BRCA1, TOP2A, ASCC3L1, HIST1H2BH, POLE2, PCNA, NUDT21, HMGB2, RPA1, MCM2, MCM6, CHAF1A, PPIH, SLC2A4RG, TOPBP1, RFC3, TTF2, C20orf129, CSTF3 |
| Second-messenger-mediated signaling | 16 | 1.53E-05 | APITD1, CKS2, RFC4, GABBR2, CCL2, HMGB2, HIST1H4C, TYMS, SPAG5, BUB1B, TOP2A, KNTC2, ZWINT, PCNA, UBE2C, FEN1 |
| Meiosis | 7 | 4.68E-04 | CHEK1, NEK2, H2AFX, SGOL1, RAD54L, HSPA2, RAD51 |
| Regulation of protein kinase activity | 12 | 1.35E-04 | CHEK1, CKS2, CDK5RAP3, TPD52L1, PKMYT1, BCCIP, CDC6, CDC25A, CDKN3, CCNA2, CDC25C, RGS4 |
| Term | Count | Pvalue | Genes |
| DNA Polymerase | 8 | 2.37E-06 | PRIM1, RFC5, POLD3, POLE2, POLQ, POLD1, POLE, POLA2 |
| Pyrimidine metabolism | 13 | 6.71E-06 | RRM2, TYMS, POLD3, TK1, DTYMK, RRM1, POLR3K, PRIM1, RFC5, POLE2, POLD1, POLE, POLA2 |
| Purine metabolism | 14 | 2.64E-04 | RRM2, PAICS, POLD3, PDE7B, RRM1, POLR3K, PRIM1, RFC5, PDE4B, PAPSS2, POLE2, POLD1, POLE, POLA2 |
| Cell cycle | 34 | 3.15E-27 | CDK6, BUB1, CDC7, SKP2, PKMYT1, CDC6, MAD2L1, CCNB1, BUB1B, ESPL1, CCNB2, CHEK1, WEE1, MCM5, MCM4, CDKN2C, CDC25A, PCNA, ORC6L, RBL1, ORC1L, MCM2, CDC2, CDK2, MCM6, CDC25C, CCNA2, CDK4, PTTG1, CDC45L, MCM7, PLK1, CDC20, MCM3 |
PPAR-γ is manifested in a variety of tissues and cancer cells[21], and the ligands that activate PPAR-γ are currently being studied as a possible novel therapeutic modality[1922–26]. The PPAR-γ ligand generally reduces the survival rate of cancer cells via differentiation, apoptotic induction, and changes in genes or proteins associated with entrance into the G1/S phase[1527]. Some reports have suggested that stomach cancer cells manifest PPAR-γ and are suppressed by PPAR-γ ligands[11]. Recently, another study has demonstrated that troglitazone, a PPAR-γ ligand, may prove useful in preventive medicine, and this effect appears to occur in a PPAR-γ-dependent manner[10].
The results of our study show that ciglitazone and troglitazone suppress the proliferation of stomach cancer cells via G1 phase arrest. The arrest of G1 phase has been reported in colon cancer cells as the result of PPAR-γ activation[12]. In the present study, each of the stomach cancer cell types that showed p53 mutations was suppressed more strongly by troglitazone than by ciglitazone, and this effect was detected more prominently in the SNU-668 cells than in the SNU-216 cells. The SNU-668 cells demonstrated p53 and ras mutations, and it will be necessary in future studies to clarify the relationship between these results and the medical mechanisms underlying them.
Few investigations have thus far addressed the induction mechanism by which stomach cancer cell proliferation is suppressed by troglitazone. As the results of some studies have suggested that PPAR agonists induce apoptosis in cancer cells, the observed cell-proliferation-suppressive effects may derive from a reduction in cell consistency. This indicates that the reduction in cells as the result of apoptosis is not very relevant to the aforementioned cell-proliferation-suppressive effects.
Jung et al[28] have evaluated the reaction of the PPAR-γ agonist pathway on PPAR-γ. For example, troglitazone suppresses the proliferation of colon cancer cells, induces apoptosis, and induces the growth response-1 gene in early phase. These processes are activated downstream of the suppression in a one-by-one fashion, via a PPAR-γ-independent pathway[29]. Chintharlapalli et al[1718] have reported that an inductive chemical compound associated with CDDO induces both PPAR-γ-dependent caveolin manifestation and a PPAR-γ-independent induction of apoptosis. In our study, we determined that this mechanism occurs via an independent pathway, as suppression of the PPAR-γ agonist was not suppressed by PPAR-γ antagonists.
We utilized different concentrations of troglitazone to induce growth suppression, as has been done for studies of insulin resistance[30]. A similar technique has also been utilized to induce growth suppression in human colon cancer cells, as reported by Sarraf et al (1998)[13]. This suggests that the clinical concentrations of troglitazone should effectively suppress the growth of stomach cancer cells.
The intracellular mechanisms relevant to the growth suppression effects of ciglitazone and troglitazone remain to be elucidated; however, Western blotting results have verified that ERK phosphorylation is suppressed by troglitazone and ciglitazone, and the noted increase in the manifestation of p21 is more marked with troglitazone. We conclude that ciglitazone and troglitazone are associated with the suppression of cell growth. Our microarray analysis results showed that troglitazone induces not only the expression of p21-inducing cell-cycle-controlling genes, but also suppresses expression of genes associated with DNA composition and a variety of other genes. This suggests that transcription of many crucial genes is completely unrelated to PPAR-γ in the presence of troglitazone. As shown above, the growth-suppressive effects induced by ciglitazone and triglitazone occur via a PPAR-independent pathway, and transcription of a variety of genes associated with the induction of cell-cycle control and DNA compound factors are relevant to this process.
Peroxisome proliferation-activated receptor (PPAR)-γ is manifested in a variety of tissues and cancer cells and the ligands that activate PPAR-γ are currently being studied as a novel treatment. The PPAR-γ ligand generally decreases the survival rate of cancer cells via differentiation, apoptotic induction, and changes in genes or proteins associated with entrance into the G1/S phase. We studied the appearance of PPAR-γ in two types of stomach cancer cells treated with ciglitazone and troglitazone, both of which induce PPAR-γ activation. We were able to identify cell proliferation, confirm the effects of PPAR-γ suppressors, and clarify any genetic alterations for the growth of stomach cancer cells using cDNA microarrays.
They evaluated the effects of PPAR-γ and PPAR-γ agonists on stomach cancer cells at the cytological and molecular levels, and determined the concentration of troglitazone that can be used clinically to suppress the growth of stomach cancer cells. In 1999, Takahashi et al reported that stomach cancer is suppressed by PPAR-γ-ligand-mediated apoptosis. In 2005, Lu et al reported that troglitazone suppresses stomach cancer via the activation of PPAR-γ.
This manuscript shows a growth suppressing effect of the PPAR-γ ligands on stomach cancer cells via a pathway independent of PPAR-γ activation.
Currently, PPAR-γ is used to treat diabetes mellitus, hyperlipidemia, atherosclerosis, inflammatory vascular disease, Alzheimer’s disease and some malignant diseases. In particular, the suppressing effect of the PPAR-γ ligands on stomach cancer cells may contribute to treatment efficacy.
PPAR is a member of the family of nuclear receptors, which is part of the steroid/thyroid hormone/retinoid receptor superfamily. PPAR has three subtypes, α, β/δ, and γ. PPAR-γ has novel functions in cell division and differentiation, which are associated with inflammatory response, tissue resuscitation, vascular biology, and cancer formation, as a control factor for apoptosis.
This manuscript describes a growth-suppressing effect of the PPAR-γ ligands on stomach cancer cell line SNU-668, but not SNU-216. This effect is independent of PPAR-γ activation. Associated with this, was an increase in p21 and decreased phosphorylated-ERK. The authors then went on to perform microarray analysis after treatment with PPAR-γ ligands.
| 1. | Chawla A, Repa JJ, Evans RM, Mangelsdorf DJ. Nuclear receptors and lipid physiology: opening the X-files. Science. 2001;294:1866-1870. |
| 2. | Han S, Roman J. Peroxisome proliferator-activated receptor gamma: a novel target for cancer therapeutics? Anticancer Drugs. 2007;18:237-244. |
| 3. | Elangbam CS, Tyler RD, Lightfoot RM. Peroxisome proliferator-activated receptors in atherosclerosis and inflammation--an update. Toxicol Pathol. 2001;29:224-231. |
| 5. | Elstner E, Muller C, Koshizuka K, Williamson EA, Park D, Asou H, Shintaku P, Said JW, Heber D, Koeffler HP. Ligands for peroxisome proliferator-activated receptorgamma and retinoic acid receptor inhibit growth and induce apoptosis of human breast cancer cells in vitro and in BNX mice. Proc Natl Acad Sci USA. 1998;95:8806-8811. |
| 6. | Ohta K, Endo T, Haraguchi K, Hershman JM, Onaya T. Ligands for peroxisome proliferator-activated receptor gamma inhibit growth and induce apoptosis of human papillary thyroid carcinoma cells. J Clin Endocrinol Metab. 2001;86:2170-2177. |
| 7. | Rumi MA, Sato H, Ishihara S, Kawashima K, Hamamoto S, Kazumori H, Okuyama T, Fukuda R, Nagasue N, Kinoshita Y. Peroxisome proliferator-activated receptor gamma ligand-induced growth inhibition of human hepatocellular carcinoma. Br J Cancer. 2001;84:1640-1647. |
| 8. | Heaney AP, Fernando M, Melmed S. PPAR-gamma receptor ligands: novel therapy for pituitary adenomas. J Clin Invest. 2003;111:1381-1388. |
| 9. | Giaginis C, Theocharis S, Tsantili-Kakoulidou A. A consideration of PPAR-gamma ligands with respect to lipophilicity: current trends and perspectives. Expert Opin Investig Drugs. 2007;16:413-417. |
| 10. | Lu J, Imamura K, Nomura S, Mafune K, Nakajima A, Kadowaki T, Kubota N, Terauchi Y, Ishii G, Ochiai A. Chemopreventive effect of peroxisome proliferator-activated receptor gamma on gastric carcinogenesis in mice. Cancer Res. 2005;65:4769-4774. |
| 11. | Takahashi N, Okumura T, Motomura W, Fujimoto Y, Kawabata I, Kohgo Y. Activation of PPARgamma inhibits cell growth and induces apoptosis in human gastric cancer cells. FEBS Lett. 1999;455:135-139. |
| 12. | Brockman JA, Gupta RA, Dubois RN. Activation of PPARgamma leads to inhibition of anchorage-independent growth of human colorectal cancer cells. Gastroenterology. 1998;115:1049-1055. |
| 13. | Sarraf P, Mueller E, Jones D, King FJ, DeAngelo DJ, Partridge JB, Holden SA, Chen LB, Singer S, Fletcher C. Differentiation and reversal of malignant changes in colon cancer through PPARgamma. Nat Med. 1998;4:1046-1052. |
| 14. | Kitamura S, Miyazaki Y, Shinomura Y, Kondo S, Kanayama S, Matsuzawa Y. Peroxisome proliferator-activated receptor gamma induces growth arrest and differentiation markers of human colon cancer cells. Jpn J Cancer Res. 1999;90:75-80. |
| 15. | Shimada T, Kojima K, Yoshiura K, Hiraishi H, Terano A. Characteristics of the peroxisome proliferator activated receptor gamma (PPARgamma) ligand induced apoptosis in colon cancer cells. Gut. 2002;50:658-664. |
| 16. | Chen ZY, Tseng CC. 15-deoxy-Delta12,14 prostaglandin J2 up-regulates Kruppel-like factor 4 expression independently of peroxisome proliferator-activated receptor gamma by activating the mitogen-activated protein kinase kinase/extracellular signal-regulated kinase signal transduction pathway in HT-29 colon cancer cells. Mol Pharmacol. 2005;68:1203-1213. |
| 17. | Chintharlapalli S, Papineni S, Baek SJ, Liu S, Safe S. 1,1-Bis(3'-indolyl)-1-(p-substitutedphenyl)methanes are peroxisome proliferator-activated receptor gamma agonists but decrease HCT-116 colon cancer cell survival through receptor-independent activation of early growth response-1 and nonsteroidal anti-inflammatory drug-activated gene-1. Mol Pharmacol. 2005;68:1782-1792. |
| 18. | Chintharlapalli S, Papineni S, Konopleva M, Andreef M, Samudio I, Safe S. 2-Cyano-3,12-dioxoolean-1,9-dien-28-oic acid and related compounds inhibit growth of colon cancer cells through peroxisome proliferator-activated receptor gamma-dependent and -independent pathways. Mol Pharmacol. 2005;68:119-128. |
| 19. | Willson TM, Brown PJ, Sternbach DD, Henke BR. The PPARs: from orphan receptors to drug discovery. J Med Chem. 2000;43:527-550. |
| 20. | Dennis G Jr, Sherman BT, Hosack DA, Yang J, Gao W, Lane HC, Lempicki RA. DAVID: Database for Annotation, Visualization, and Integrated Discovery. Genome Biol. 2003;4:P3. |
| 21. | Ikezoe T, Miller CW, Kawano S, Heaney A, Williamson EA, Hisatake J, Green E, Hofmann W, Taguchi H, Koeffler HP. Mutational analysis of the peroxisome proliferator-activated receptor gamma gene in human malignancies. Cancer Res. 2001;61:5307-5310. |
| 22. | Desvergne B, Wahli W. Peroxisome proliferator-activated receptors: nuclear control of metabolism. Endocr Rev. 1999;20:649-688. |
| 23. | Escher P, Wahli W. Peroxisome proliferator-activated receptors: insight into multiple cellular functions. Mutat Res. 2000;448:121-138. |
| 24. | Murphy GJ, Holder JC. PPAR-gamma agonists: therapeutic role in diabetes, inflammation and cancer. Trends Pharmacol Sci. 2000;21:469-474. |
| 25. | Fajas L, Debril MB, Auwerx J. Peroxisome proliferator-activated receptor-gamma: from adipogenesis to carcinogenesis. J Mol Endocrinol. 2001;27:1-9. |
| 26. | Grommes C, Landreth GE, Heneka MT. Antineoplastic effects of peroxisome proliferator-activated receptor gamma agonists. Lancet Oncol. 2004;5:419-429. |
| 27. | Takeuchi S, Okumura T, Motomura W, Nagamine M, Takahashi N, Kohgo Y. Troglitazone induces G1 arrest by p27(Kip1) induction that is mediated by inhibition of proteasome in human gastric cancer cells. Jpn J Cancer Res. 2002;93:774-782. |
| 28. | Jung TI, Baek WK, Suh SI, Jang BC, Song DK, Bae JH, Kwon KY, Bae JH, Cha SD, Bae I. Down-regulation of peroxisome proliferator-activated receptor gamma in human cervical carcinoma. Gynecol Oncol. 2005;97:365-373. |
| 29. | Baek SJ, Wilson LC, Hsi LC, Eling TE. Troglitazone, a peroxisome proliferator-activated receptor gamma (PPAR gamma ) ligand, selectively induces the early growth response-1 gene independently of PPAR gamma. A novel mechanism for its anti-tumorigenic activity. J Biol Chem. 2003;278:5845-5853. |
| 30. | Nolan JJ, Ludvik B, Beerdsen P, Joyce M, Olefsky J. Improvement in glucose tolerance and insulin resistance in obese subjects treated with troglitazone. N Engl J Med. 1994;331:1188-1193. |


