INTRODUCTION
Medical imaging has a strong impact on clinical decision making and its significance and utility seems increasing. In the field of gastroenterology, new imaging methods like double-balloon and capsule enteroscopy are recent additions to the more traditional methods. In contrast to X-ray, Computed tomography (CT), magnetic resonance imaging (MRI), single photon emission computed tomography (SPECT) and positronen emissions-tomographen (PET) scanning, ultrasonography is a clinical method that can easily be applied even bedside using mobile, hand-carried scanners[1]. Despite its favourable cost, availability, flexibility, and user friendliness, ultrasonography stands out as the imaging method with highest temporal and spatial resolution. In addition, its real-time and functional imaging capacity makes it well suited for soft tissue modelling. Ultrasonography can provide physiological, pathopfysiological and biomechanical information to the clinician and constitutes an important tool in the diagnosis and follow up of large populations of patients.
The gastrointestinal tract is a very long system of organs that poses a particular challenge to medical imaging. In this paper, we aim at outlining how advanced imaging and visualization, particularly ultrasonography is able to disclose structural and functional information of the GI tract.
FUNCTIONAL ULTRASONOGRAPHY
Functional ultrasonography (f-US) is ultrasound imaging of organ function, in contrast to conventional imaging of anatomic structures. Using f-US, information on motility, biomechanics, flow, perfusion, organ filling and emptying can be obtained non-invasively.
Contractile activity
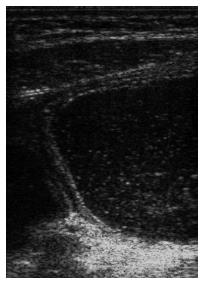
Ultrasonography can provide both qualitative and quantitative information about motility, both in a fasting state and after meal ingestion. Gastric contractions and propagation of waves can be visualized and monitored by ultrasound[2-7]. Both frequency and amplitude are easily measured; the latter defined as the maximal reduction of antral area induced by a contraction, as a fraction of the relaxed area. High resolution ultrasound using frequencies in the range 7-15 MHz enables detailed studies of gastric wall layer involvement during peristalsis (Figure 1). Ultrasound is more sensitive than manometry in detecting antral contractions and in particular the detection of non-occlusive contractions[8].
Figure 1 Ultrasonogram of the fluid-filled gastric antrum showing the different wall layers and a propagating contraction wave that occludes the lumen.
Acute mental stress induced by a video game in which the subjects were driving a simulated car trying to avoid collisions on a highway, reduced postprandial antral motility during the stress period in healthy volunteers, but not in patients with functional dyspepsia[9]. Stress mainly reduced the amplitudes of antral contractions and cisapride had no effect on these stress-induced responses.
Gastric emptying
Ultrasonography has been widely used to assess gastric emptying rates[10-16] and good correlation to radionuclide estimates of emptying rates have been detected[12,17,18]. However, ultrasound is best suited for emptying of liquid meals. Scintigraphy, with appropriate labelling of the test meal components and appropriate corrections applied, is still considered the gold standard for measurement of gastric emptying. However, its application is limited by the need to restrict exposure to ionising radiation. In depth description of ultrasound estimation of gastric emptying and findings in functional dyspepsia have been reported elsewhere[19].
Gastroduodenal flow
The movements of gastroduodenal contents and velocity curves of transpyloric flow can be synchronously visualized by duplex ultrasound, a combination of Doppler measurement and B-mode image[20,21]. It has been shown, using duplex scanning, that a short gush of duodenogastric reflux normally precedes the peristaltic closure of the pylorus. An antral contraction can be defined as an indentation of the gastric wall greater than one antral wall thickness observed to propagate in space and time, as long as the indentation is not due to respiration, pulsation transmitted from the aorta or heart, or to movements of adjacent intestine. First gastric emptying is defined as the first occurrence of gastric emptying after drinking the “test” soup. An episode of gastric emptying is defined as flow across the pylorus with a mean velocity of more than 10 cm/s lasting for greater than one second. Occluding peristaltic-related transpyloric emptying is defined as gastric emptying associated with contractile activity in which the ultrasound image demonstrates an occlusion of the stomach wall. Non-occluding peristaltic-related emptying is defined as transpyloric emptying of gastric contents associated with contractile activity of the gastric wall which does not occlude the lumen. During maximal contractions transpyloric flow can be seen passing back and forth through the open pylorus. Non-peristaltic-related transpyloric emptying can be defined as transpyloric emptying of gastric contents, without contractions detected on ultrasound or manometry. Using this Doppler method, timing of postprandial dyspeptic symptoms and transpyloric passage of gastric contents can be studied with great temporal and spatial resolution[22], including after pharmacological intervention[23].
Gastric emptying of a low calorific liquid meal follows sequences of emptying-reflux-emptying pulses. About half of the sequences are peristaltic related, but both non-occluding, peristaltic related and non-peristaltic related emptying sequences occur. Non-peristaltic related flow sequences have often more alternating emptying-reflux episodes than those associated with peristalsis, and the duration of non-peristaltic related emptying and reflux pulses are longer. The pressure gradients for all types of emptying are low and the pressure gradients during non-peristaltic related emptying are significantly lower than during peristaltic related emptying.
Flow can only occur in the presence of an open pylorus. Transpyloric flow can be classified into flow associated with a local increase in the pressure gradient between antrum and duodenum (Pa-Pd) due to antral propagating pressure waves, and flow associated with a common cavity pressure difference between the distal antrum and the proximal duodenum as was observed during non-peristaltic related flow. The second type of flow is independent of peristalsis and is likely to be caused by changes in gastric tone, or by pressure changes outside the stomach such as aortic pulsation and inspiration.
Hausken and co-workers also developed a non-invasive method for evaluating transpyloric flow and duodenogastric reflux stroke volumes using a three-dimensional guided digital color doppler imaging model[24]. They studied healthy subjects both during ingestion of a soup meal and 10 min postprandially. Cross-sectional color doppler digital images of duodenogastric reflux episodes were acquired with a 5-3 MHz phased array transducer. The 3D position and orientation data were acquired using a magnetic sensing system. They found high intra- and inter individual variations of the stroke volumes of transpyloric flow episodes during the initial gastric emptying. The duodenogastric reflux episodes lasted on average 2.4 s with a volume of on average of 8.3 mL. This method minimized geometric assumptions and angular ambiguity.
Strain rate imaging
Tissue Doppler imaging (TDI) enables mapping of local tissue velocities, thus increasing the physiological information about moving walls[25,26]. However, the point velocity of tissue does not differentiate between actively contracting and passively following tissue. Therefore, a Doppler method based on strain rate imaging (SRI) and estimation of relative strain was developed to enable this differentiation. In general terms, strain means tissue deformation as a function of applied force (stress)[27]. The temporal derivative of strain, i.e. the strain rate, is a measure of the rate of deformation.
Doppler SRI was evaluated in vitro using a silicone strip phantom mimicking slowly moving tissue[28]. A test apparatus was developed that enabled controlled strain experiments with variable strain and strain rate to be performed. We found low intra- and interobserver variation. For the SRI method to give accurate estimates of strain, the strain sample size should be in the region of 2 mm and averaging over several ultrasound (US) beams increased the accuracy further.
In another study, we evaluated the accuracy of SRI in measuring strain in the porcine antral wall in vitro[29]. An experimental set-up enabled controlled distension of a porcine stomach in a saline reservoir. SRI gave accurate measurement of radial strain of the antral wall, but seemed to be less accurate for measurement of circumferential strain in this in vitro set-up.
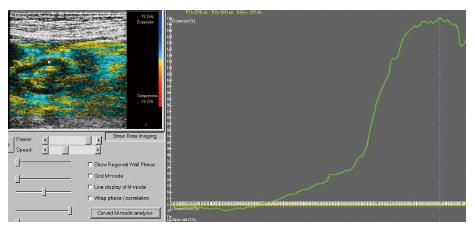
Estimation of relative strain of the muscle layer of the gastric wall by Doppler ultrasonography is feasible (Figure 2) and enabled detailed mapping of local strain distribution[30,31]. SRI is capable of distinguishing contractile activity of the longitudinal and circular muscle layers, even though the two layers cannot be separated visually in the 2D images. During balloon distension of the antrum, we found a significant inverse correlation between pressure and SRI measurement (r = -0.87). Ongoing studies are evaluating whether SRI can be applied to evaluate the relation between symptoms and biomechanical factors in dyspepsia.
Figure 2 These graphics outline the relative radial strain of the circular muscle layer of the antral wall.
The exact sampling point in the gastric wall is denoted with a red marker in the color Doppler ultrasonogram of the left panel. In the right panel, the positive strain curve with a maximum of 150% radial elongation of the muscle layer is demonstrated.
Ultrasonography to evaluate gastric accommodation
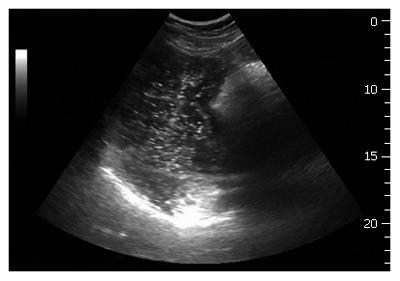
A sonographic method for assessment of proximal gastric size was developed to estimate accommodation of meals[32]. The transducer was positioned in the epigastrium by the left subcostal margin and tilted cranially while the subject was sitting in a chair, leaning slightly backwards. Two standardised sonographic image sections were chosen to monitor the size of the proximal stomach. First, a sagittal section with the left renal pelvis in a longitudinal projection, using the left lobe of the liver and the tail of the pancreas as internal landmarks, was recorded. Then, the transducer was rotated 90° clockwise to obtain an oblique frontal section where the top margin of the fundus is clearly visible (Figure 3). Utilising this technique the existence of an impaired proximal gastric accommodation to a meal in patients with functional dyspepsia was observed[33]. Impaired proximal stomach accommodation was in fact a much more prevalent finding than a wide gastric antrum. Because nitric oxide (NO) is a key neurotransmitter in the reflex regulating adaptive relaxation, it was tempting to administer glyceryl trinitrate, an exogenous donor of NO, to patients with functional dyspepsia to examine if it would improve gastric accommodation and symptoms in response to a meal. In a double blind placebo-controlled cross-over study, Gilja et al[34]demonstrated that glyceryl trinitrate caused a concomitant improvement of proximal gastric accommodation and epigastric pain, nausea and total symptom scores in response to a meat soup meal.
Figure 3 An oblique frontal section applied for ultrasound scanning of the proximal stomach.
The top margin of the fundus is shown as a white line in the bottom of the image. A proximal gastric diameter is outlined in the frontal section by tracing normally to the longitudinal axis of the proximal stomach, thus indicating the size of the proximal stomach.
This 2D method has also been used to study gastric accommodation in diabetes mellitus[35], in patients with reflux oesophagitis[36], in liver cirrhosis[37], and in children with recurrent abdominal pain[38]. The method has also been applied to study pharmacological intervention[39] and the effect of a barostat bag in the stomach[40]. In contrast to the barostat, ultrasonography is a non-invasive and widely available method for the study of accommodation of the proximal stomach.
3D ULTRASONOGRAPHY
A method for volume estimation of the stomach based on mechanical tilting acquisition of 3D ultrasonography was developed[41]. Using a motor device, the transducer was tilted through an angle of 90°, capturing sequential 2D-frames before the data set was transferred to a graphic workstation for final 3D processing. This 3D ultrasound system demonstrated excellent accuracy in vitro both on phantoms[42] and on animal organs. Furthermore when validated in vivo against magnetic resonance imaging (MRI) this 3D system was in good agreement with the MRI and produced results with high precision[43]. This system has also been used to study diseases of the liver[44], and to evaluate patients with functional dyspepsia[45-47]. However, this 3D investigation could only acquire a 90° fan-like data set from a pre-determined, fixed position of the transducer. Accordingly, a mechanical acquisition system like this could only capture small volumes of data and not cover completely a large organ like the stomach or liver.
To enable scanning of the fluid-filled stomach, a commercially available magnetometer-based position and orientation measurement (POM) device was interfaced to the scanner. This system for magnetic scanhead tracking (Bird, Ascencion Technology Inc. Vermont, USA) was validated both with respect to its precision in locating specific points in space[48] and to its accuracy in volume estimation[28,49]. For the first time, total gastric volumes and intragastric distribution of meals could be studied by ultrasonography[50]. Sagittal sections of the stomach were recorded throughout its entire length, starting in the proximal part where the transducer was positioned by the left subcostal margin and tilted cranially to image the most superior part of the stomach. After stepwise scanning of the proximal stomach angling from left to right, the transducer was moved and held to insonicate normally to the skin surface. Then the distal stomach was scanned stepwise moving distally to the gastroduodenal junction.
We validated this 3D ultrasonographic method in vivo in healthy controls[51]. A barostat bag was positioned in the proximal stomach of 6 healthy subjects who underwent scanning with the Bird® magnetic system. This 3D ultrasound system correlated very well to infused volumes and showed very good agreement with true volumes, and in addition there was low inter-observer variation. Patients with reflux esophagitis exhibited an abnormally large volume of the proximal stomach soon after a liquid meal, concomitant with the perception of fullness. The abnormal distention of the proximal stomach may represent a pathogenic mechanism in reflux oesophagitis.
In functional dyspepsia, poor accommodation of the proximal stomach to a meal has been found in many studies[33,52-54]. Drinking capacity is often reduced in these patients and drink tests may therefore have a diagnostic potential. A simple drink test in combination with 3D ultrasonography was applied in a test using Toro meat soup, Nutridrink, and water[55]. The meals were ingested at a rate of 100 mL/min until maximal drinking capacity was reached. Intragastric volume at maximal drinking capacity was determined using 3-dimensional ultrasonography. Optimal discrimination between patients and controls was obtained by the combination of symptoms and intragastric volume (S/V) using meat soup as the test meal. In another study, an analytical method was developed to describe the three-dimensional geometry of the gastric antrum, the gastric fundus and the whole stomach based on 3D ultrasound acquisitions[56]. The Fourier series method was used to simulate the organ surface geometry. The principal curvatures spatial distributions were non-homogeneous in the gastric antrum, gastric fundus and the stomach due to their complex geometry.
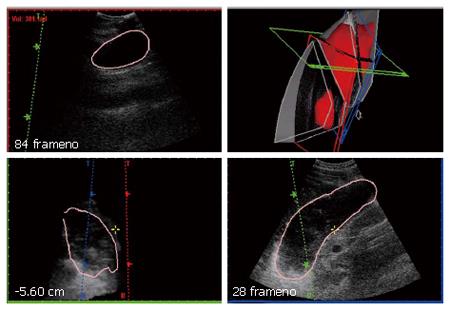
Data processing and display requires specialized computer software to handle the ultrasound images. We have, in collaboration with Christian Michelsen Research (Bergen, Norway) and Vingmed Sound (Horten, Norway), developed a software package called EchoPac3D® to help with this process[57,58]. EchoPac3D enables the import of image data that are acquired both with mechanical devices and magnetic position sensors as well as with endosonographic acquisitions. Manual segmentation or semiautomatic rendering of structures in the 3D data set makes accurate volume estimation and reconstruction of organs or pathologic tissue achievable. A display of the EchoPac3D software is shown in Figure 4. The 3D ultrasound system used in our lab is outlined more in depth in a previous review[59].
Figure 4 A 3D reconstruction of the total stomach volume (red) in the upper left panel.
The acquisition is based on magnetic scanhead tracking. Three orthogonal orientation planes are shown in red, green and blue. The upper left panel is a volume reconstruction window where manual outlining of the structures are made.
FUNCTIONAL IMAGING OF THE ESOPHAGUS
Esophageal function in swallowing and competence in gastro-oesophageal reflux has traditionally been assessed with manometry, or alternatively barium radiography. Standard manometry with relatively few (3-8) channels measures the pressures generated in the distal and proximal sphincters and in the body of the esophagus. With high-resolution manometry and computer-generated graphics, a much more detailed and complex picture is composed from 16-24 pressure signals evenly spaced along the catheter, allowing for detailed analysis of the physiology of peristalsis and sphincter function. High-resolution manometry has recently been used to study the physiology of peristalsis and the pathophysiology of gastro-oesophageal reflux in patients with reversible hiatal hernias[60].
Manometry has important limitations in studies of oesophageal motor function. Firstly it does not measure bolus transport. Furthermore it measures exclusively contractions of the inner circular muscle layer of the oesophageal wall, and only if and at the time when a contraction obliterates the lumen around the catheter. These limitations can be overcome with high-frequency intraluminal ultrasonography (HFIUS), with which one can measure the thickness and contractile activity of the muscularis propria, and also to some extent that of each separate muscle layer. It has been demonstrated that it is possible to detect hypertrophy of the muscularis in hypercontractile disorders of the esophagus such as achalasia, diffuse oesophageal spasm and nutcracker esophagus[61]. Contractile activity of the longitudinal muscle layer is thought to contribute stiffness and support to the peristaltic wave generated in the inner circular muscle layer. Isolated sustained contractions of the longitudinal layer are seen as increased muscle thickness, and have been shown to coincide with sensations of chest pain in patients with idiopathic chest pain[62]. Furthermore, in patients with heartburn, symptom episodes were preceded by similar contractions, whether associated with acid reflux occurred or not. Asynchrony between contractions of the muscle layers are also likely to contribute to symptoms[63]. The miniaturization of HFIUS probes allows them to be combined with manometry and laser Doppler flowmetry into multi-modal catheters for studying the biomechanical parameters and genesis of pain in healthy subjects and patients with idiopathic chest pain[64].
Radiographic studies with barium contrast have traditionally been used to screen for motility disorders of the esophagus and when properly performed, can be extremely useful. These techniques have occasionally been combined with manometry to quantify parameters of sphincter function. Scintigraphic studies only assess bolus transport. Bolus transport has also recently been studied with multichannel intraluminal impedance (MII), which measures lumen dilatation at the time of passage of a food bolus, enabling one to classify food passage as complete or incomplete. MII can also be combined with manometry. Multiple impedance channels as well as manometry are also incorporated into the functional lumen imaging probe (FLIP) for studying the distensibility and opening characteristics of the oesophago-gastric junction[65]. The limitation of impedancemetry is that it only measures the geometry of the lumen and not the wall of an organ and therefore yields limited biomechanical data. However, in contrast to any other medical imaging technology, FLIP is capable of providing quasi-3D lumen geometry in real time.
Recently, endoscopy of the oesophageal mucosa has been supplemented by the promising new method of confocal laser endoscopy, which allows a detailed study of mucosal layers. The characteristics of dysplasia and minor changes of inflammation have been evaluated in preliminary studies, indicating that the method may become an important guidance for detecting early cancers in the metaplastic or squamous oesophageal mucosa[66].
DYNAMIC ENDOSONOGRAPHY OF THE GI TRACT
Endosonography (ES) is performed with intraluminal ultrasound transducers which can be inserted blindly into hollow organs or under endoscopic guidance (EUS). ES is usually performed as B-mode imaging but other modalities can also be applied (M-mode, Doppler, elastography). EUS makes visualisation of the mucosal surface of the GI tract as well as the individual wall layers, adjacent organs and other structures possible. Real-time ES probes allow imaging of GI motility and biomechanics and when a probe is used to apply pressure directly to the tissue, information about tissue stiffness can also be obtained[19].
Instrumentation
The small diameter of ES-miniprobes allows these probes to be inserted through the biopsy channel of conventional endoscopes or a suitable catheter. Currently available miniprobes operate with ultrasound frequencies between 12 and 30 MHz. Dedicated echoendoscopes combine endoscopy with integrated radial or curvilinear array ultrasound transducers with frequencies between 5 and 30 MHz. New echoendoscopes can be connected to modern ultrasound machines with advanced software making it possible to use different ultrasound modalities (B-mode, M-mode, Doppler, sonoelastography, strain rate imaging, 3D-imaging, contrast-enhanced ultrasound).
Endosonographic assessment of GI biomechanics
Biomechanical functions of the GI tract and neighbouring organs have in recent years been increasingly studied with real time endosonography. Both active properties such as peristaltic contractions (motility) and active and passive forces and deformation (biomechanics) of the tissue can be visualized with this technique[67]. ES- miniprobes combine the advantages of high ultrasound frequencies with small transducers thus being a technique which can be combined with other methods, especially with manometry. Echoendoscopes are suitable for examination both of the GI wall and for studying extraintestinal organs and structures because they use lower ultrasound frequencies and have larger ultrasound transducers.
The GI tract and wall layers
The normal GI wall is imaged by ES as a layered structure consisting of several layers (5-9 layers) but most often a 5-layer structure is seen[68]. Many disorders and diseases may have an influence on GI wall morphology, motility and other biomechanical functions which can be examined using ES. The transducer can also be used as a diagnostic tool to “palpate” the GI wall, thus giving additional information about changes in GI wall thickness, layers and echogenicity[69].
Esophagus
Endosonographic changes of the esophageal wall, especially the proper muscle layer, have been found to correlate with the increase in luminal pressure by manometry. Hoff et al[64] have described a multimodal device which can be inserted into esophageus combining bag distension, manometry, high frequency intraluminal ultrasound, laser Doppler flowmetry and symptom registration. Preliminary experience indicates that these modalties can be used in combination without significant and detrimental technical influence on each other. In a study by Taniguchi et al[70], the esophagus was investigated with M-mode ES and manometry. Swallowing events were found to produce simultaneous increases in intraluminal pressure and esophageal wall thickness. Furthermore, patients with achalasia and nutcracker esophagus have been examined with both ES and manometry showing high correlation between wall changes and manometric findings. Patients with sclerodermia may also demonstrate abnormal ES findings in the esophageal wall due to smooth muscle atrophy and variable fibrosis and collagen parameters. In patients with reflux esophagitis, ES often demonstrates inflammatory changes affecting all, or individual, wall layers in the distal part of the esophagus as well as demonstrating abnormalities in peri-esophageal tissue and lymph nodes. These morphologic changes may thus affect esophageal motility and thereby also influence acid clearance.
Stomach, duodenum and extraintestinal organs
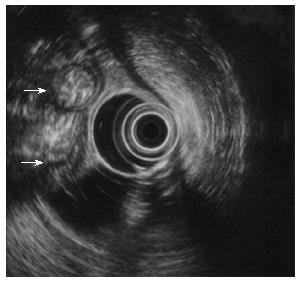
In wide and curved organs ES can be technically challenging but ES is a well documented method for examination of the stomach, duodenal wall, retroperi-toneum, pancreas, vessels, common bile duct and part of the liver. The stomach and duodenum represent good acoustic windows for transmural imaging and for transducer palpation of extraluminal organs (Figure 5). Thus, dynamic changes of the pancreatic duct in suspected chronic pancreatitis can be examined by ES after drug administration (Secretin) or by compressing the organ with the transducer. A device which combines endosonographic real-time imaging with intraluminal volume-controlled bag distensions has also been developed for use in large lumens. Detailed images of GI wall layers corresponding to the area of bag pressure can be obtained using this technique.
Figure 5 Small bowel loops (arrows) imaged from the stomach with an echoendoscope.
Liq-uid within the gastric lumen gives an excellent acoustic window.
Rectum, colon and small intestine
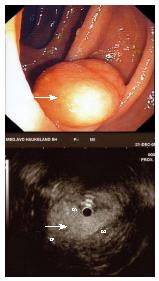
Rectum and the large bowel may be examined with dedicated echoendoscopes and rectal probes. However, transcolonoscopic ES using miniprobes is a practical method for imaging the colon and rectum wall (Figure 6). The small intestine can now be examined by capsule endoscopy or with enteroscopes. Capsule endoscopy is performed with a small device which is swallowed by the patient and endoscopic imaging of the entire small intestine is possible. ES/EUS of the small intestine may in the future be accomplished if a miniature ultrasound device is integrated in the capsule or in an enteroscope. The interpretation of wall layers, biomechanics and motility of the small intestine and large bowel is as for the upper GI tract.
Figure 6 Endoscopic image of a tumour in the colon (arrow, top).
An ultrasound miniprobe is used to “palpate” the relatively soft echo-rich tumour (arrow) which is a lipoma.
Elastography
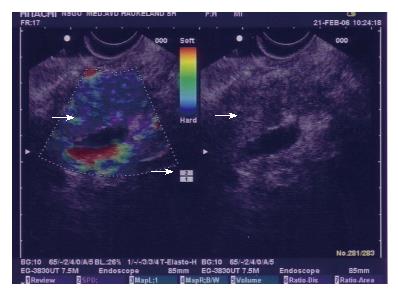
The stiffness of the GI wall and the individual wall layers can be evaluated by compressing the tissue with the ES transducer. Sonoelastography (SE) and SRI are new ultrasound methods which can give information about tissue hardness and contractility[31,71,72]. The underlying principle of SE is that the deformation of tissue by a mechanical excitation is a function of its mechanical properties. For gastrointestinal purposes, the intraluminal pressure may be used as the excitation force. Imaging of ultrasound tissue elasticity has thus gained considerable interest as a method to differentiate normal from abnormal tissue. Cancer and inflammation may be otherwise influenced by transducer pressure than normal tissue and SE. Color codes seems to be a helpful technique to separate pancreatic cancer from chronic pancreatitis (Figure 7).
Figure 7 ES-elastography (colour coded, left) in chronic pancreatitis displaying hard (blue) and softer (green) areas (left, large arrow).
Corresponding B-image (right, arrow). Transducer pressure is indicated by a scale (small arrow).
Strain rate imaging provides quantitative information on velocities within a tissue. By color-coded tissue velocity imaging, velocity data from the whole field of view are available simultaneously. This allows extraction of parameters through spatial and temporal processing of the velocity data. Trans-esophageal probes primarily used in echocardiography can also be inserted into the stomach thus having potential for SRI of esophageal and gastric motor function.
3D ES images can be obtained using images acquired by both echoendoscopes and miniprobes. 3D-ES may be applied for improved recognition of the GI anatomy and pathological lesions. Mostly, a pullback device has been used to obtain parallel 2D images which are reconstructed to a 3D-image[73]. However, the recent development of 3D real time transducers and advanced software programs opens the way for three-dimensional motility and otherwise dynamic studies of the GI tract.
FOOD HYPERSENSITIVITY AND IMAGING
Intolerance to food is prevalent in the general population. In Western countries, the frequency of perceived food hypersensitivity is as high as around 25%. However, only 2% of the population have food allergy as medically defined. It is therefore important, and often a challenge, to prove whether the ingestion of suspected food items really causes symptoms, and by which mechanism. Hypersensitivity is defined as objectively reproducible symptoms or signs, initiated by exposure to a defined stimulus at a dose tolerated by normal subjects. The term “food allergy”, should be restricted to reactions mediated by classical immune mechanisms. It is divided into IgE-mediated food allergy (type-I), mixed IgE and non-IgE-mediated, and non-IgE-mediated food allergy. Non-IgE-mediated food allergy (type III or IV) involves cell-mediated immunologic reactions, immune complex formation or complement deposition. Non-IgE-mediated allergic reactions are therefore subdivided into those in which the reaction is initiated predominantly by mechanisms associated with allergen-specific antibodies other than IgE, and those in which a cellular response is predominant.
Subjective food hypersensitivity
Subjective food hypersensitivity is poorly defined. In practice, the diagnosis is based on self-reported symptoms and absence of indications of allergic and non-allergic hypersensitivity mechanisms or organic disease that can explain the symptoms. Many patients with organic or functional gastrointestinal disorders claim that they are intolerant to various kinds of food. For instance, in a recent study from our department, 75% of the patients with H pylori positive dyspepsia claimed intolerance for one or more food items. Eradication of the bacterium reduced the prevalence of food intolerance significantly, but 51% of the patients still reported food intolerance[74]. Likewise, patients with irritable bowel syndrome (IBS) commonly report various kinds of food hypersensitivity[75,76].
A typical food allergic reaction
In an allergic rat, intestinal provocation with an allergen elicits mucosal swelling and leakage of plasma into the lumen lasting a couple of hours before the mucosa returns to normal[77]. The mucosal hyperaemia and exudation of plasma is regarded as a non-injurious defence mechanism. In man, the intestinal response to food allergens is less well characterised, but the consequences appear to be much the same[78]. Massive luminal influx of fluid might be the cause of the symptoms, which usually are acute, short-lasting abdominal cramps, nausea and diarrhoea. A major problem in such IgE-mediated reactions is that all traces of an allergic reaction might have disappeared at the time of consultation. A positive skin prick test and abnormal levels of total or specific IgE indicate allergic predisposition, but do not prove that the complaints of the patients are in any way related to allergy. Therefore, a provocation test is often mandatory.
Double-blind placebo-controlled food challenge
The best method for diagnosing food allergy is still not known. For many years, double-blind placebo-controlled food challenge was considered the “gold standard”. Because the procedure is extremely labour-intensive and time-consuming, and the assessment based on subjective symptoms such as abdominal discomfort and bloating, which makes the results more equivocal than generally thought, the method has become disputed. In practice, the diagnosis relies on history, documentation of IgE-sensitisation by skin prick tests or serology, registration of food intake, elimination diets and open provocation tests. Double-blind placebo-controlled food challenge is seldom performed. Other cumbersome methods such as endoscopic food allergen injection[79], jejunal perfusion and recording of the intestinal mucosal response by endosonography[80] have been tried, but further evidence is required before these methods may be applicable in clinical routines.
Response to intestinal provocation monitored by endosonography
The duodenal mucosa was challenged with allergen extracts via a nasoduodenal tube in 20 patients with self-reported adverse reactions to food. Seven of the patients had food allergy according to history, specific IgE and skin prick tests, whereas the remaining 13 patients were said to have food intolerance.
The tube was positioned with its tip in the descending part of the duodenum by first introducing a stylet during gastroduodenoscopy and thereafter pushing the tube in position over the stylet. The correct position of the tube was checked by fluoroscopy. Endosonography was performed by pushing a 20 MHz miniature ultrasound probe (Fujinon Sonoprobe System, SP 701, Omiya City, Japan) through the tube and installing a suspension of the suspected food item into the duodenum through the tube after temporarily withdrawing the ultrasound probe. Apparently, the mucosal responses were potentiated if the mucosal barrier was weakened by installing 10 mL of 48% alcohol either simultaneously of just prior to food challenge. Alcohol alone had no effect. The thickness of mucosa, submucosa and muscularis propria was measured directly on ultrasonographic sections frozen on the screen every 3 min before and after allergen challenge. Clinical symptoms were recorded at same intervals. After completing the ultrasonographic recordings, intestinal lavage was performed by infusing 2 L of an isotonic solution of polyethylene glycol into the duodenum. The first clear fluid passed per rectum and all urine voided for 5 h were sampled for analysis.
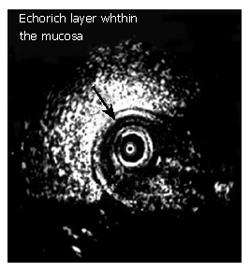
Endosonographic changes (i.e. any resolvable wall thickening, contraction or new echogenic layer) were observed in 15 of the 20 patients (75%). Increased mucosal thickness in response to provocation was recorded in 11 patients, but not more often or pronounced in allergic than in intolerant patients. Interestingly, increased mucosal thickness associated with a new echogenic layer was seen in two patients and a sustained duodenal contraction associated with pain lasting 15-20 min in another two (Figure 8). Intestinal permeability and inflammatory mediators (calprotectin) were not significantly different in the two groups.
Figure 8 Endosonographic changes i.
e. any resolvable wall thickening of the duodenum, contraction or new echogenic layer) were observed in many patients with food hypersensitivity. Increased mucosal thickness associated with a new echogenic layer was seen in two patients[82].
Response to intestinal provocation monitored by transab-dominal ultrasound
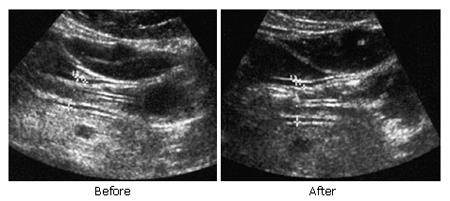
The feasibility of using external transabdominal ultrasound to monitor the response of the proximal intestine to direct luminal provocation was examined in 32 patients with chronic abdominal complaints, self-attributed to food hypersensitivity/allergy[81]. Via a nasoduodenal tube, the duodenal mucosa was challenged with the suspected food item dissolved in 10 mL water or saline. Gastrointestinal symptoms were scored on a visual analogue scale. The sonographic features (wall thickness and diameter of the duodenal bulb and jejunum, peristalsis activity, and luminal fluid) were recorded before and during one hour after challenge by external ultrasound. Sonographic changes after challenge were observed in 14 (44%) of the 32 patients (Figure 9). A positive sonographic response (increased wall thickness, diameter, peristalsis and/or luminal fluid) was significantly related to positive skin prick test (P = 0.008) and positive double-blind placebo-controlled food challenge (P = 0.03). A significant correlation was found between provocation-induced symptoms and intestinal wall thickness, both in the duodenal bulb (r = 0.50, P = 0.004) and in the jejunum (r = 0.42, P = 0.02). Intra- and interobserver variation of the tracing procedure revealed low values.
Figure 9 The sonographic features; wall thickness and diameter of the duodenal bulb and jejunum, peristalsis activity, and luminal fluid were recorded before and during allergen challenge by external ultrasound.
The ultrasonographic view of the duodenal bulb shows wall thickening and increased diameter in response to provocation[83].
Sonography appeared to be the most sensitive test applied. It was positive in 14 patients, while the skin prick test was positive in 10 and the double-blind placebo-controlled food challenge in four. However, the specificity of the new test is not yet known. We conclude that responses of the proximal small intestines to direct provocation (swelling of the wall and exudation of fluid into the lumen) could be visualised by transabdominal ultrasound, and that this new provocation test may become helpful in the evaluation of patients with food hypersensitivity. However, we acknowledge that further validation studies are required.
Food hypersensitivity reactions visualised by ultrasono-graphy and magnetic resonance imaging
Particularly in the absence of systemic food-specific IgE, a firm diagnosis of food allergy is difficult. Using ultrasonography and MRI we were able to visualise the intestinal response in one such case[82]. A 24-year-old female presented with self-reported food hypersensitivity, particularly related to intake of egg. Nausea and diarrhoea were predominant symptoms. Double-blind placebo-controlled food challenge with raw egg was positive, but all other conventional tests of food hypersensitivity, including skin prick test, total and food specific IgE in serum, were negative. A thorough investigation programme could not reveal any organic disease. We extended the evaluation to include two new provocation tests namely monitoring intestinal wall thickness and the amount of luminal liquid by external abdominal ultrasound and MRI.
Both ultrasound and MRI investigations indicated intestinal wall thickening and influx of large amounts of fluid into the proximal small intestines within 10 min after duodenal challenge with egg. The response was associated with abdominal pain and bloating. We conclude that the response to provocation was typical of an immediate allergic reaction. Our results indicate that local food-induced hypersensitivity reactions can occur in the gut in the absence of systemic indications of IgE-mediated allergy. Abdominal ultrasonography and MRI might become valuable tools for documenting such responses.
Visualization of stress-induced responses
It has long been known that there are close anatomical and functional connections between the enteric nervous system and the mucosal mast cells. Electron microscopic examinations show that the two structures are in direct contact[83]. Using intestinal intubation and multilumen tubes allowing intestinal perfusion studies in man, Santos et al[78] demonstrated release of histamine and tryptase from mucosal mast cells in response to stress. The stress model applied was repeated insertion of the left hand in ice water. In addition to mast cell mediator release, the response was characterised by oedema and marked increase in flow of liquid into the lumen (a well-known consequence of histamine-induced mucosal hyperaemia). Hence, the intestinal response to stress includes several features typical of the response provoked by allergens both in animals[79] and man[84]. No wonder, therefore, that differentiating between allergy- and stress-induced intestinal problems in patients can be extremely difficult.
Food hypersensitivity reactions including gastrointes-tinal reactions due to food allergy can be visualized by several modalities. From a practical clinical point of view, visualization by ultrasound and MRI appear particularly promising.
INTRALUMINAL MULTIMODAL IMAGING DEVICES
Within the past five years there has been a considerable interest in the development of multimodal probes for studying visceral pain mechanics and physiology. Drewes, Gregersen and coworkers have, through a series of studies published from 2001 onwards, developed multimodal stimulation probes and protocols using mechanical, thermal, chemical and electrical stimuli with the purpose of differentiating pain mechanisms. For example mechanical stimuli are believed to stimulate receptors primarily in the muscle layers whereas chemical stimuli are sensed by mucosal receptors. Furthermore, electrical stimulation is believed to bypass the receptors and to stimulate the nerves directly. Using an advanced setup the stimuli can be combined in many ways. In order to study whether distension-induced pain is due to the mechanical stretch of to tissue ischemia induced by the distension, Hoff and coworkers developed a multimodal imaging device combining bag distension, manometry, high frequency intraluminal ultrasound, laser Doppler flowmetry and symptom registration. Successful development of these modalities will have important implications on our understanding of functional pain in the viscera and the development has now passed through several stages and prototypes were bench-tested before trials were done in pigs and subsequently in human subjects.
The probe consists of a 6 mm OD multi-lumen bag catheter with a radial 20-MHz miniature ultrasound probe with a diameter of 2.6 mm (UM-3R, Olympus Corp, Tokyo, Japan) and a laser Doppler flow sensor (Perimed, Sweden) placed inside the bag. Furthermore, the catheter contained channels for filling and emptying the bag and for pressure measurements. The laser Doppler provides a qualititative measure of perfusion in the mucosa (approximately 1 mm into the mucosa) and the combined measurement of pressure and geometry data using ultrasonography allow the computation of mechanical stress (force per area) and strain (a measure of deformation). Hence, by running various advanced distension protocols it is possible to differentiate pain mechanisms.
In a typical study the device is inserted through the mouth into the stomach and retracted to the esophagus, with the tip of the bag placed approximately 8 cm proximal to the upper border of the LES, as determined with manometry and ultrasound. A total of six distensions are performed at a bag infusion rate of 15 mL/min. The inflations are reversed when moderate pain is reported by the subject under study. The first distensions serve to precondition the tissue mechanically. The fifth distension is started 1 min after an intravenous injection of 20 mg butylscopolaminebromide (Buscopan®, Boehringer Ingelheim, Germany). Buscopan serves to inhibit muscle contraction and thus provides a “cleaner” experimental situation.
Studies done until now in the human esophagus have shown that the multimodal imaging device is safe to use and provides accurate and reproducible data. Furthermore, the ultrasound and laser Doppler signals do not interfere with each other. Distensions increase the bag pressure and lumen cross-sectional area and decrease the wall thickness. Hence, increase in circumferential wall stress and strain occurs. Furthermore, the Laser Doppler signal decreases invariably during bag distensions but artifacts, likely due to motions, may interfere with the Doppler signal. Contractions characterized by high amplitudes and long duration are often associated with a decrease in mucosal perfusion whereas less strong contractions do not seem to interfere with tissue perfusion. There are unpublished data that contradict this hypothesis that distension-induced pain is ischemia-related. However, such data does not exclude that functional visceral pain is ischemic, and indeed there may be dual mechanisms involved in visceral pain. Studies are ongoing to shed light on this issue.
ADVANCED VISUALIZATION
Advanced screening technologies in medicine drive needs for image processing research and visualization research. Image processing deals with issues such as filtering, feature enhancement, tissue segmentation, and tissue classification. Visualization is usually performed after image processing, and deals with the problem of transforming data into a graphic representation that can aid in understanding the meaning of the data.
Many medical screening technologies produce slices of data, which may be aligned to form 3D data. Visualization has become particularly important when 3D acquisitions are available and the inspection of the two-dimensional slices does not justify the particular goal of the medical procedure. In such cases, 3D visualization provides added value in terms of more holistic understanding of the data. Typical examples here are pre-operative surgical planning or virtual training of medical students.
Medical data is becoming more and more complex. The resolution of the imaging modalities increases resulting in an enormous number of cross-sectional ‘slices’ where manual slice-by-slice inspection is just not possible. Furthermore, new co-registration techniques produce multimodal data sets, i.e. combinations of CT, MRI, PET, and US (ultrasound). In many cases the data are also acquired over time. This complexity creates a new area for advanced visualization research, where different data types can be combined and presented in new ways.
In the following text we will discuss advanced visualization techniques that assist medical scenarios dealing with lesions in the gastrointestinal tract. We review techniques already integrated into daily clinical routine or currently under development. Following this we give an outlook of possible research directions for visualization of the gastrointestinal tract.
Virtual endoscopy
The visualization technique probably having the highest impact on the diagnostic procedure in gastrointestinal medicine is the virtual endoscopy[85]. It is mostly applied to diagnosis of early stage cancer in the colon and aims to overcome problems associated with original optical endoscopy. The original procedure is uncomfortable for the patient, provides limited views, does not give access to areas behind colon collapses, and introduces potential risk of lesions due to the endoscope. Virtual endoscopy is realized as a ‘flythrough’ visualization of the patient’s body acquired from CT or MRI scanning. The clinician can freely navigate the camera in the scanned data to select arbitrary views. The position of the ‘light’ can be also freely manipulated. The spatial location of the camera in the volume is depicted in overview, which is linked to the detail view that shows the actual endoscopic view. This guarantees that the user does not loose orientation in the three-dimensional data.
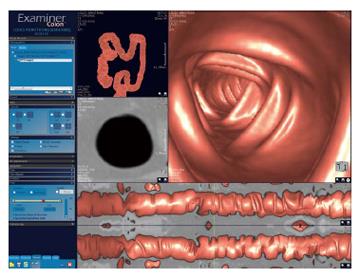
Virtual colonoscopy is one specific type of virtual endoscopy applied to the data acquired from the patient’s colon. The goal is to identify polyps on the colon wall, i.e. indications of early stage colon cancer or the identification of pre-malignant lesions. The pipeline for virtual colonoscopy diagnosis starts with acquiring data (usually using CT modality) of cleaned colon that is pumped-up with air. The colon structures are then rapidly segmented, and various analysis tools are applied. For example, in order to allow easy interaction a default camera path is located on the pre-computed centerline of the colon. Additionally, some recent work has concentrated on shape analysis of underlying data for automatic polyp detection[86]. This allows the clinician to focus on the most important region, and to reduce the overall time of the diagnosis. The colon data can be shown using surface rendering in order to clearly identify the polyps or by using volume rendering to show structures behind the colon walls[85]. The surface can be rendered directly using first-hit raycasting or a polygonal model of the colon walls can be generated using the marching cubes algorithm[87], which are then rendered using standard graphics hardware. In cases where the clinician is interested in structures behind the colon walls, the direct volume rendering technique using semi-transparent colon walls can be selected. This enables clinicians to examine tissues close to the colon such as a tumor located adjacent to the colon. An example of a commercial medical workstation featuring virtual colonoscopy is shown in Figure 10.
Figure 10 Example of a colonoscopy layout in a 3D medical workstation 3Dnet Examiner (Copyright Biotronics3D Ltd, Used by permission).
Virtual colonoscopy and virtual endoscopy in general has its limitations, and optical endoscopy will never be fully replaced. The quality of the endoscopic visualization highly depends on the quality of acquired data and the chosen segmentation technique. The flaws of the data acquisition and segmentation cannot be usually fixed during rendering. In contrast to the optical endoscopy, the visualization is done for the diagnostic purposes only, so the in-situ analyses (e.g. biopsy probes) are not possible. The main strengths of virtual endoscopy are clear understanding of the spatial location and the non-invasive character of the procedure.
Colon unfolding
A different visualization for inspection and diagnosis of colon lesions is colon unfolding[88]. The data set is acquired in the same way as in the case of virtual colonoscopy. Colon unfolding is, in contrast to previously mentioned optical and virtual endoscopy, still a research area in development and not used in daily clinical use. The goal of colon unfolding is to eliminate all the problems associated with the manipulation in the three-dimensional space. The approach performs unfolding of a cylindrical structure to a plane. Unfolding the tubular structure provides an instant overview of the entire organ. The topological change from a cylindrical structure to a planar structure has the potential to significantly speed-up in the diagnostic procedure and decision making. This is very important in order to reduce the overall costs of the process.
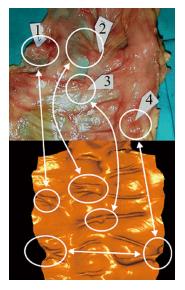
The reasons why this technique is still not routinely used in the clinical setting are the artefacts associated with the topological change to a planar structure that require some advanced re-sampling strategies. Typical artifacts of the re-sampling step are double appearance of the same polyp in the re-sampled plane or missing a polyp due to under sampling. Another problem may be missing a polyp that is located at the ‘cut’ of the cylinder. Careful treatment of the re-sampling step may, however, make this unfolding a very powerful and popular feature among clinicians. A comparison between a real dissected colon containing polyps and colon unfolding of the CT scan obtained from the same patient can be observed in Figure 11.
Figure 11 Comparison between real colon dissection and the resulting visualization of colon unfolding technique (Copyright Anna Vilanova, Used by permission).
Virtual elastography
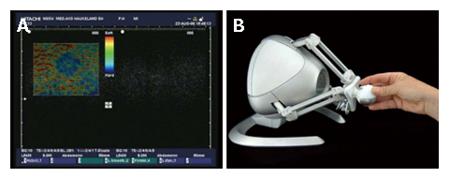
Elastography is a new ultrasound screening modality where the strain of the tissue is measured[89]. Figure 12A shows one slice of elastography data visualized by means of standard techniques provided by the hardware vendor. In this figure blue corresponds to hard tissue, while red corresponds to soft tissue. Elastography is very well suited for being combined with new volume rendering techniques and new haptics (force-feedback) interaction devices into a solution that may be termed “Virtual Elastography”. Here the idea is that the strain of the tissue can often characterize a presence of a tumor as neoplastic tissue is usually much harder than surrounding tissue. In such cases, 3D acquisitions followed by volume rendering techniques can be used to show strain of the entire three-dimensional structure. Advanced volume rendering techniques, such as importance-driven volume rendering[90], can be used to automatically emphasize features of interest. This can be done by mapping the tissue strain to the importance function. This will result in a clear view of the three-dimensional shape of the entire suspicious region characterized by high strain values. The clinician will get information about the entire stiff structure instead of information only about the cross-section. Two-dimensional cross-sections are currently the only visualization technique supported by ultrasound hardware vendors. Three-dimensional acquisitions will also allow for three-dimensional measurements of the volume of the stiff region, which may influence the selection of appropriate medical treatment.
Figure 12 Screenshot of current two-dimensional ultrasound elastography visualization (A) and the Novint Falcon 3D haptic controller (B).
In addition to the advanced visualization strategies using the importance-driven concept, the virtual elastography solution may include smart interaction hardware such as haptic devices (Figure 12B). Such devices are used to give the user the sense of touch by applying forces, vibrations or other motions to the user. The usage of haptic devices for medicine has, for example, been studied for remote surgery or training of palpatory diagnosis[91]. Using the elastography data as input for the haptic device can very effectivelly convey the stiffness information to the clinician by means of haptic cues. Virtual elastography will in this case introduce a completely new interaction to medicine, i.e. the ability to ‘touch’ and ‘palpate’ a patient’s internal organs.
Navigation 3D maps
Clinicians often refer to the lack of information about the exact position and orientation of the imaging device as a limitation or difficulty, e.g. in the practical use of endosonography. The large Bird sensor has been used for many clinical applications including external GI ultrasonography[50,92]. New virtual reality tracking technologies, such as the microBIRD (Ascension Technology Corporation, Vermont, USA), can be used to overcome this problem even in invasive procedures[93,94]. This device measures position and orientation in real time, and is designed for use in catheters. The diameter of the sensor is only 1.3 mm.
Miniature tracking devices are thus enablers for a broad range of new medical applications. Within endoscopy, it is very likely to see a development towards solutions we may call “Navigation 3D Maps”. Here the idea is to firstly perform screening of the patient prior to the endoscopic procedure, e.g. by using CT, MRI or PET. Then the endoscopic intervention is performed by including a miniature tracking device in the setup. By combining the screening data and the endoscopic data it will be possible to visualize the internal structures of the patient together with endoscopic ultrasound data.
Several technical issues need to be addressed before we can expect to see Navigation 4D Maps in clinical use. For example, during endoscopy of the upper GI tract, the structures can move a considerable amount due to digestion, heart beating, and breathing. This problem can be addressed in several ways depending on the medical procedure. In some cases it may be possible to perform simultaneous acquisitions of map data and endoscopic data, while in other cases it may be possible to correct for movements in the map data. Such corrections can be based upon acquisitions of cyclic movements, or be based upon real-time data from the endoscope. In addition it is a great challenge to explore and evaluate which visualization techniques that are best suited for each of the broad range of medical problems being addressed.
CONCLUSION
There are many imaging modalities and visualization methods that can be used to diagnose and follow-up patients with diseases of the Gi tract. CT, MRI, SPECT, PET, X-ray, ultrasonography, endoscopy, roentgenological and radionuclide methods have different strengths and weaknesses and must be tailored to the specific task demanded. Regarding temporal and spatial resolution, SPECT and PET are at the lower end of, and ultrasonography is at the high end of, the resolution spectrum. Regarding functional imaging capacity, X-ray and CT are at the lower end, whereas PET and ultrasonography are at the higher end of the spectrum.
The introduction of 3D ultrasonographic imaging in the field of gastroenterology seems to improve standardization of data acquisition and analysis. Moreover, acquisition time during an unpleasant procedure for the patient can be reduced. 3D imaging also make ultrasonography less operator dependant and facilitates easier interpretation of ultrasonographic images. A successful development of modern endosonographic devices can be achieved on the basis of a fruitful collaboration between medicine, technology and soft-ware producers. Different modalities can be merged into new multimodal devices making it possible to measure multiple parameters in one procedure. This also paves the way for fusion of diagnostic and therapeutic imaging enabling patients to have a one-session procedure.
S-Editor Liu Y L-Editor Mcgovern D E- Editor Chin GJ


