Copyright
©The Author(s) 2002.
World J Gastroenterol. Jun 15, 2002; 8(3): 531-536
Published online Jun 15, 2002. doi: 10.3748/wjg.v8.i3.531
Published online Jun 15, 2002. doi: 10.3748/wjg.v8.i3.531
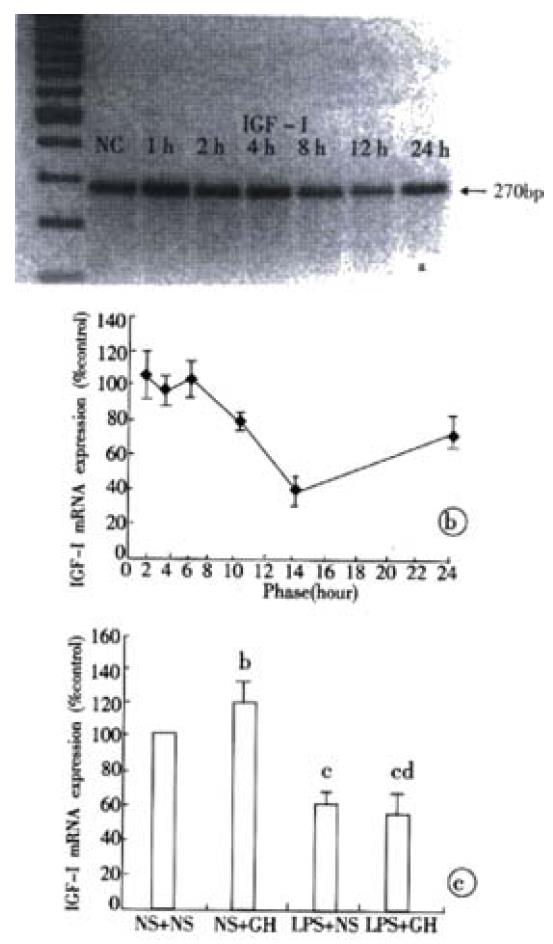
Figure 1 (A, B) Liver IGF-I mRNA expression response to endotoxin injection at different time points.
(C) Liver IGF-I mRNA expression after single GH injection and endotoxin injection along with or without GH injection. bP < 0.05 compared with NS + NS group, cP < 0.01 vs NS + NS group, dP > 0.05 compared with LPS + NS group. NS as saline injection.
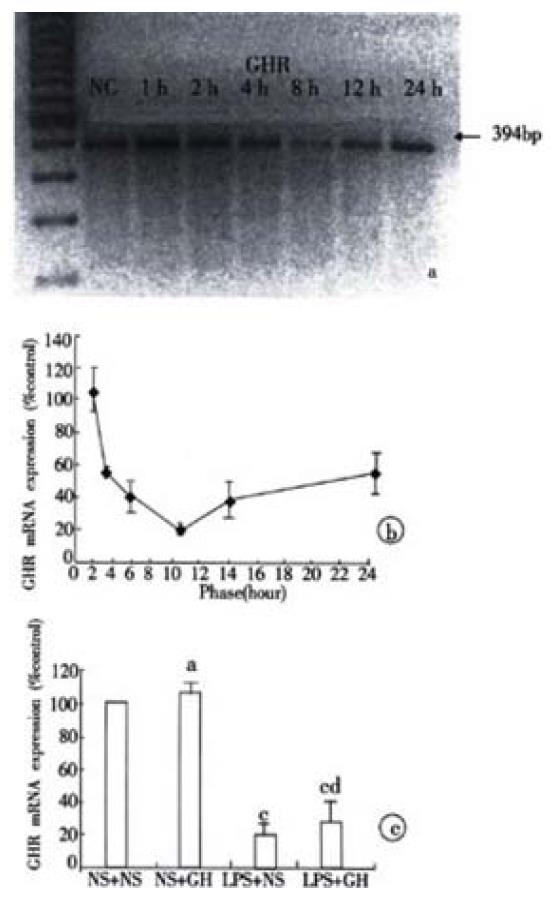
Figure 2 (A, B) Liver GHR mRNA expression responsed to endotoxin injection at different time points.
(C) Liver GHR mRNA expression after single GH injection and endotoxin injection along with or without GH injection. aP > 0.05 compared with NS + NS group, cP < 0.01 vs NS + NS group, dP > 0.05 compared with LPS+NS group. NS as saline injection.
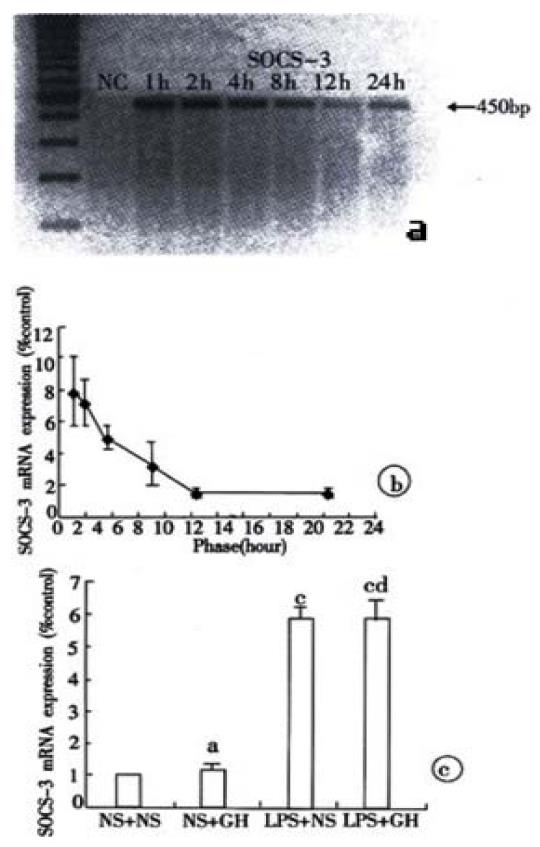
Figure 3 (A, B) Liver SOCS-3 mRNA expression response to endotoxin injection at different time points.
(C) Liver SOCS-3 mRNA expression after endotoxin injection along with or without GH injection. aP > 0.05 compared with NS + NS group, cP < 0.01 vs NS + NS group, dP > 0.05 compared with LPS + NS (7.5) group. NS as saline injection.
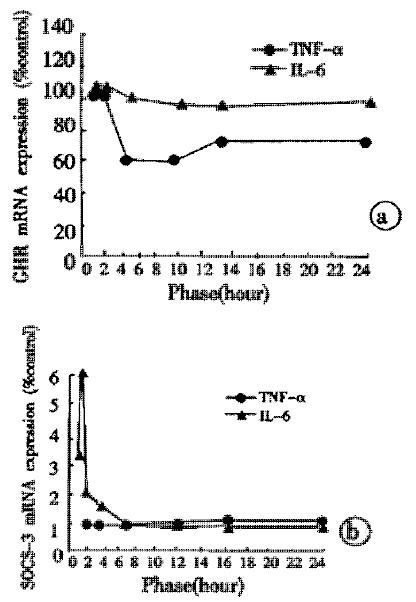
Figure 4 LiverGHR (A) and SOCS-3 (B) mRNA expression response to TNF-α and IL-6 iv injection at different time points.
- Citation: Wang P, Li N, Li JS, Li WQ. The role of endotoxin, TNF-α, and IL-6 in inducing the state of growth hormone insensitivity. World J Gastroenterol 2002; 8(3): 531-536
- URL: https://www.wjgnet.com/1007-9327/full/v8/i3/531.htm
- DOI: https://dx.doi.org/10.3748/wjg.v8.i3.531


