Copyright
©The Author(s) 2002.
World J Gastroenterol. Jun 15, 2002; 8(3): 531-536
Published online Jun 15, 2002. doi: 10.3748/wjg.v8.i3.531
Published online Jun 15, 2002. doi: 10.3748/wjg.v8.i3.531
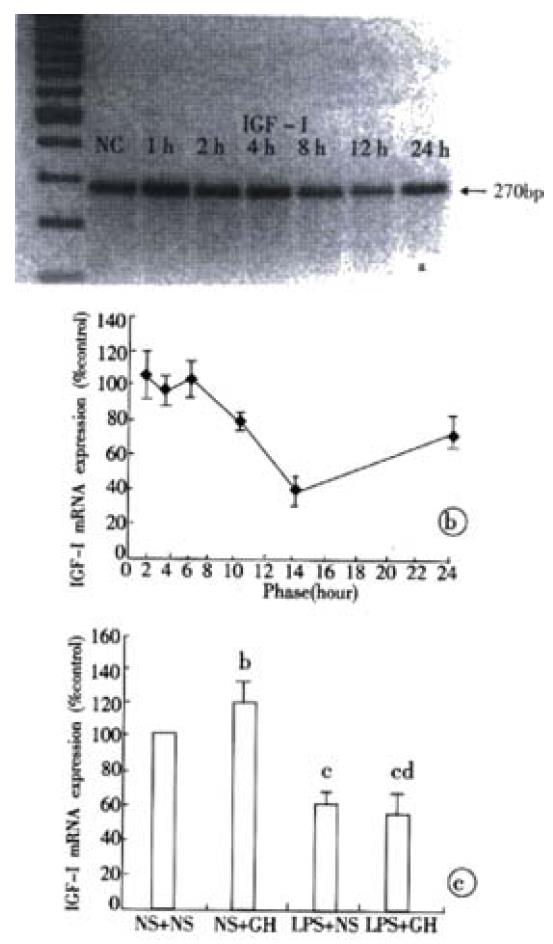
Figure 1 (A, B) Liver IGF-I mRNA expression response to endotoxin injection at different time points.
(C) Liver IGF-I mRNA expression after single GH injection and endotoxin injection along with or without GH injection. bP < 0.05 compared with NS + NS group, cP < 0.01 vs NS + NS group, dP > 0.05 compared with LPS + NS group. NS as saline injection.
- Citation: Wang P, Li N, Li JS, Li WQ. The role of endotoxin, TNF-α, and IL-6 in inducing the state of growth hormone insensitivity. World J Gastroenterol 2002; 8(3): 531-536
- URL: https://www.wjgnet.com/1007-9327/full/v8/i3/531.htm
- DOI: https://dx.doi.org/10.3748/wjg.v8.i3.531


