
















Copyright: ©Author(s) 2026.
World J Gastroenterol. Jan 21, 2027; 33(3): 123466
Published online Jan 21, 2027. doi: 10.3748/wjg.123466
Published online Jan 21, 2027. doi: 10.3748/wjg.123466
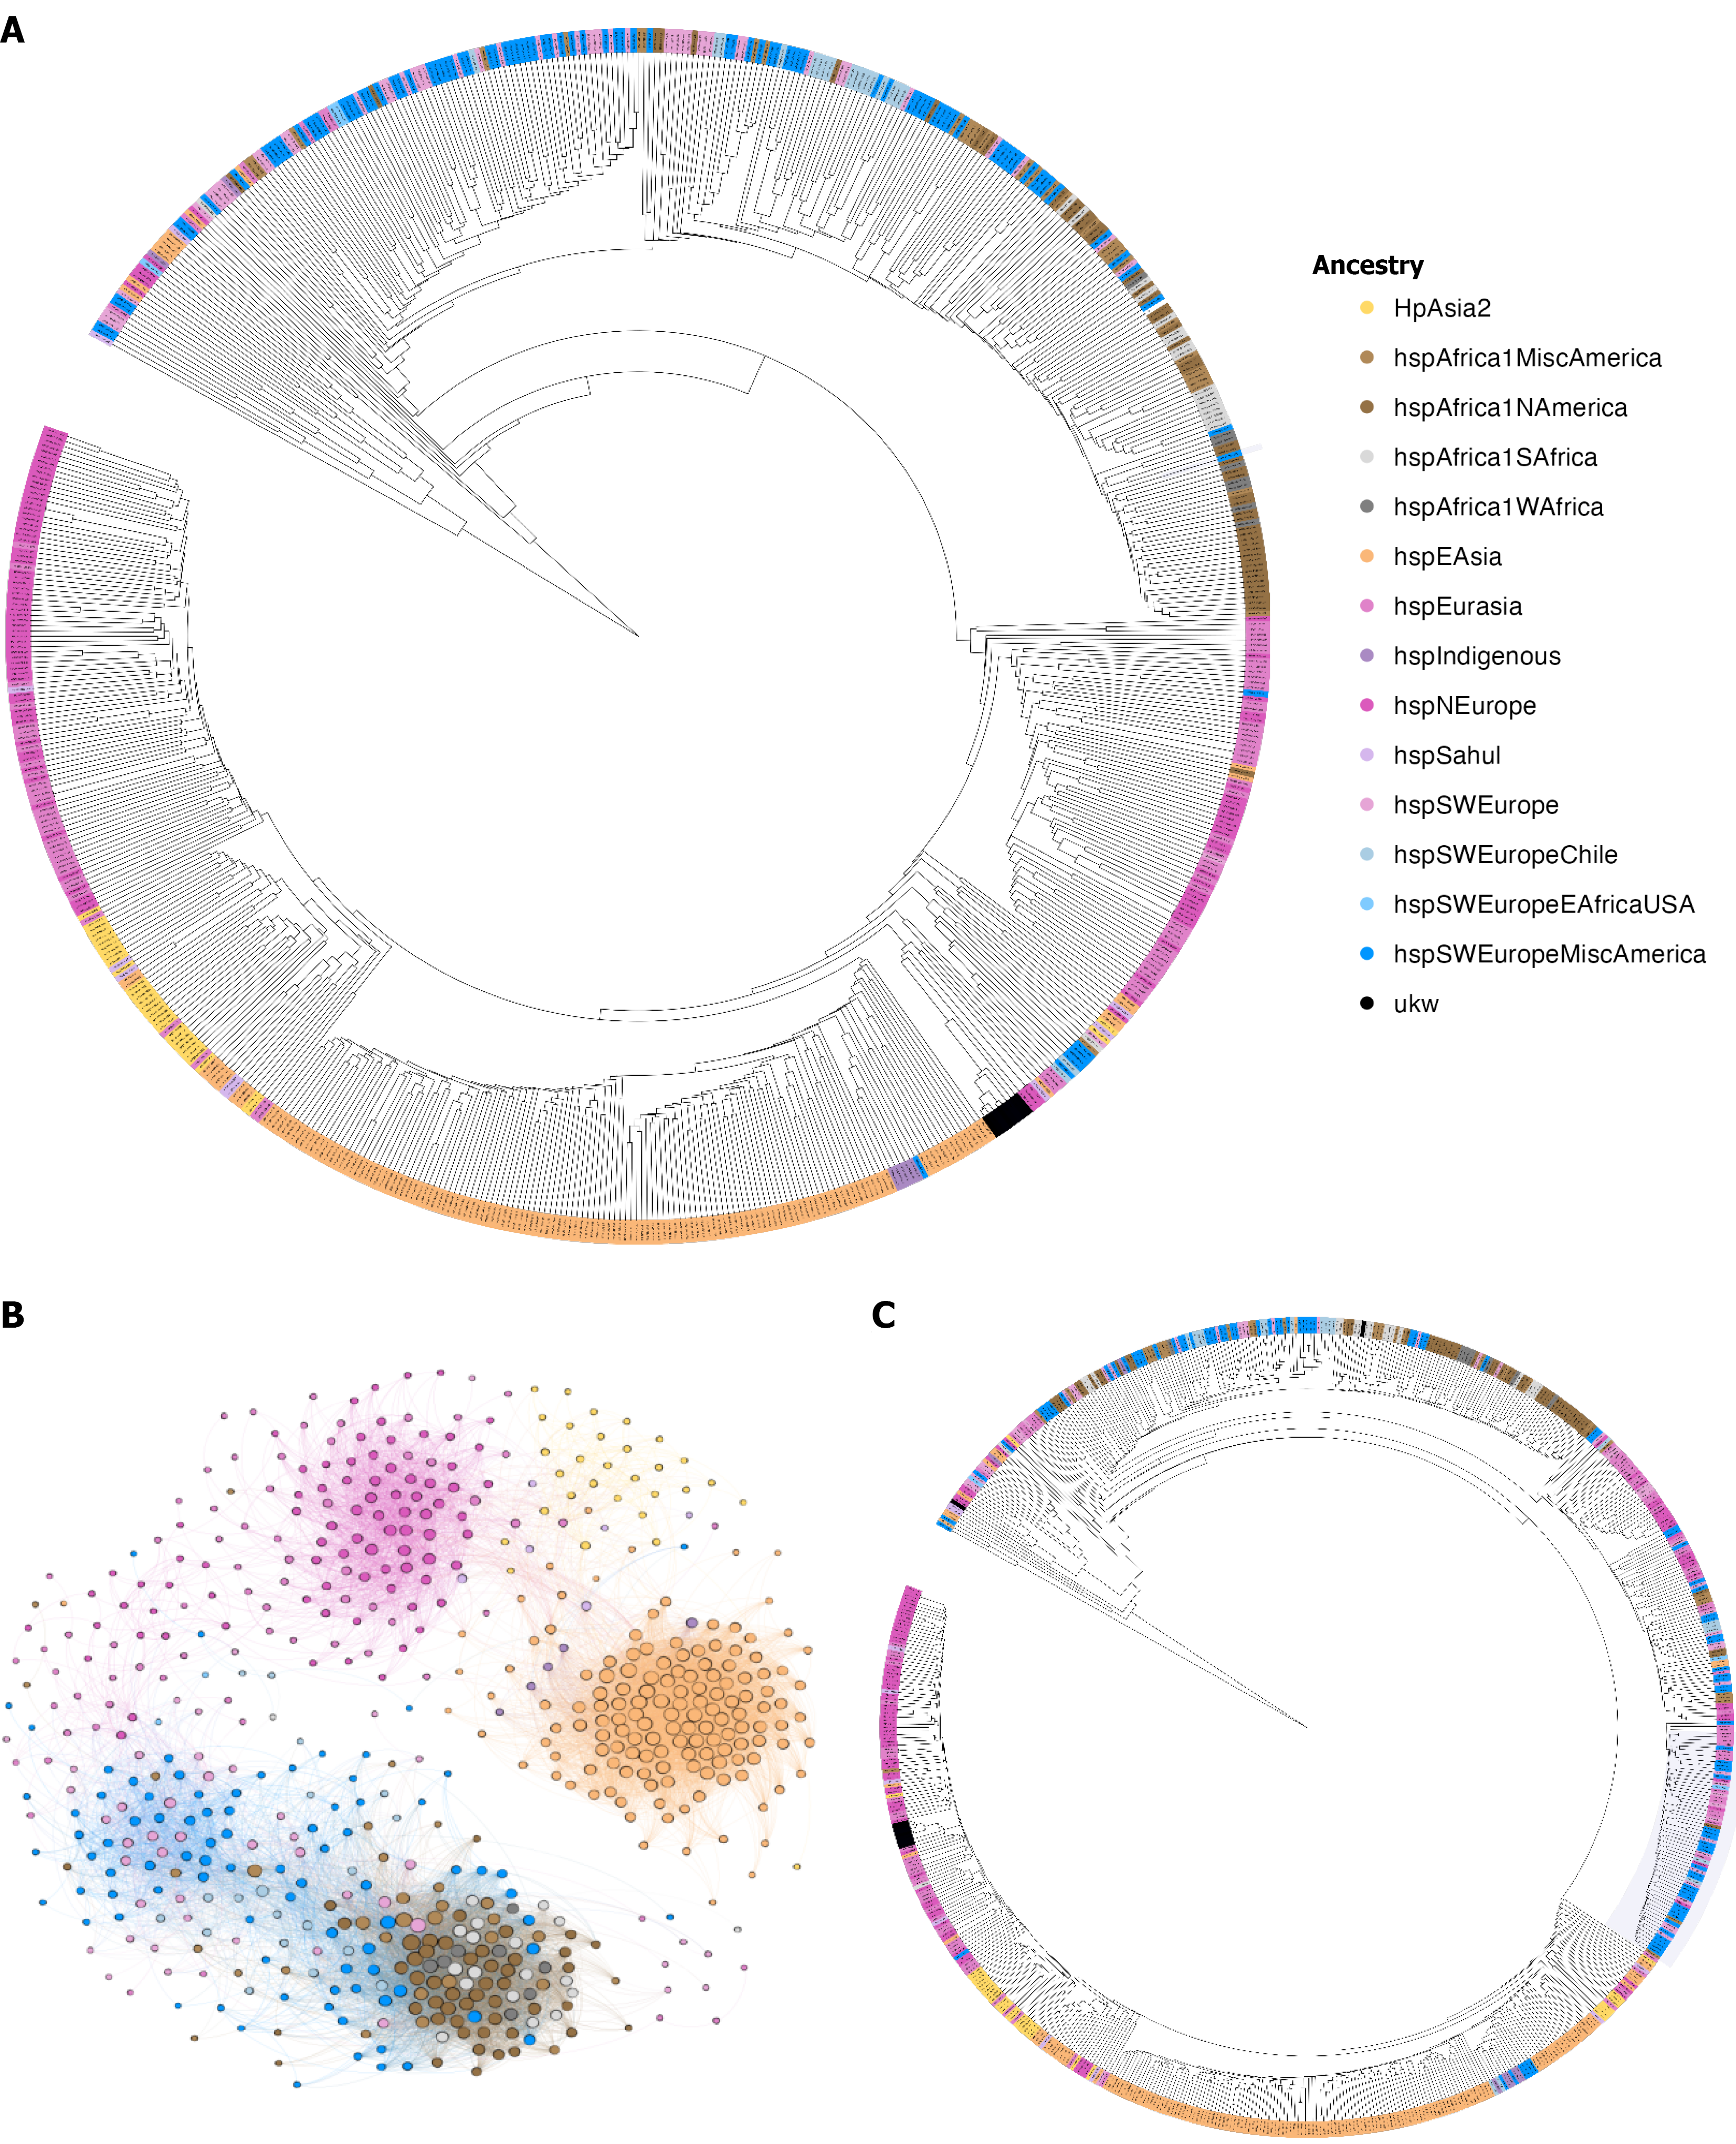
Figure 1 Phylogenetic analysis of the cagY gene using the virtual analysis method for phylogenomic fingerprint estimation strategy.
Colors represent the ancestry of Helicobacter pylori (H. pylori). A: Phylogenetic analysis of the complete cagY gene, showing the clustering of H. pylori ancestries, which mirrors the population structure of the core genome; B: Phylogenetic network analyses of cagY showing the population structure of the gene; C: Phylogenetic analysis of the middle repeat region (MRR) region of the cagY gene, showing the ancestry clustering of the MRR.
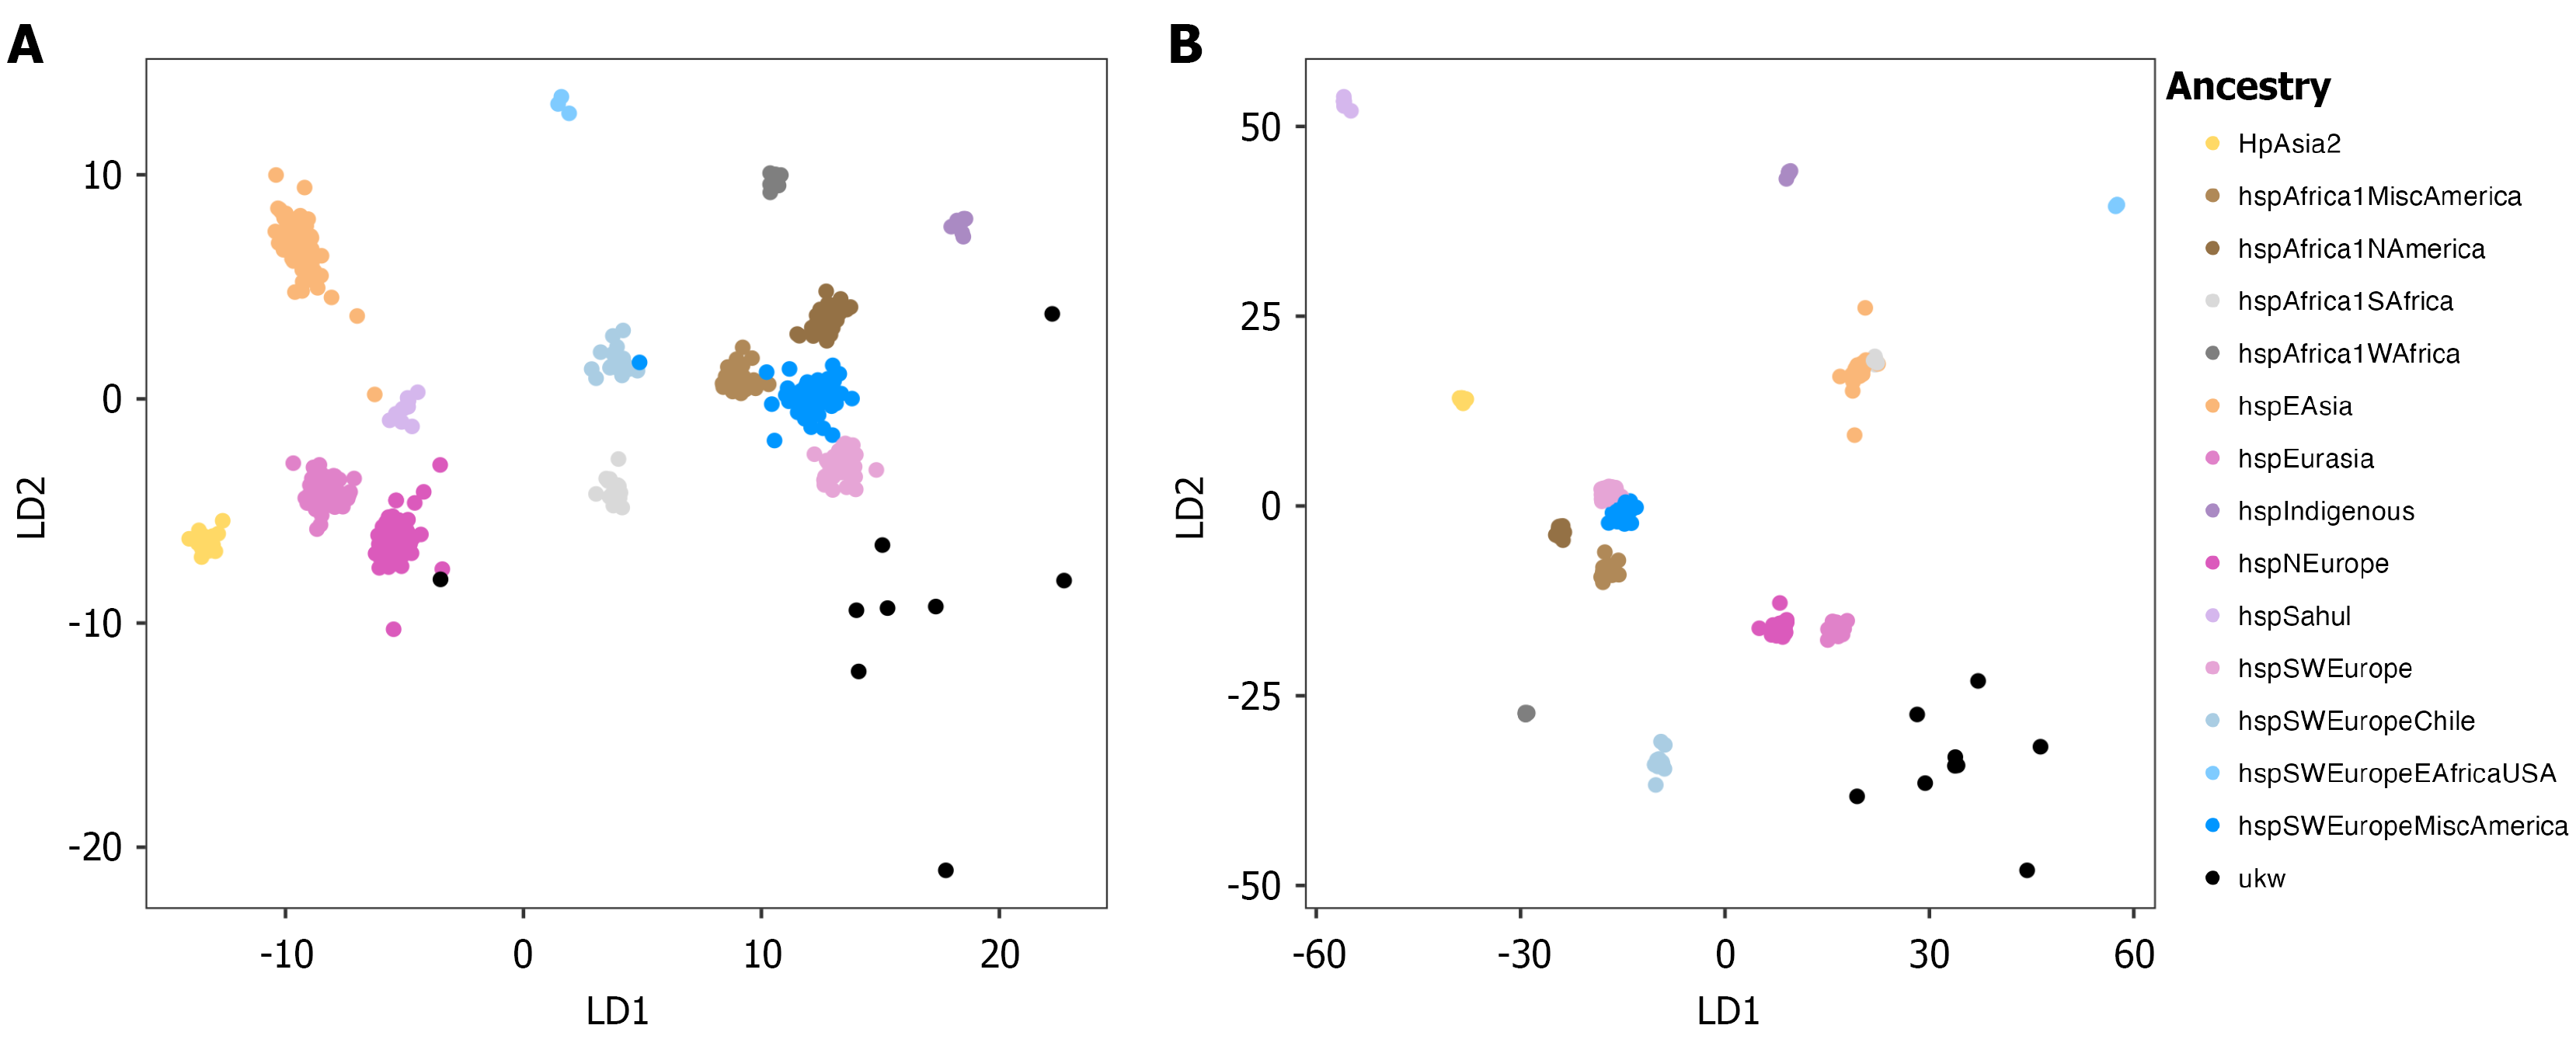
Figure 2 Linear discriminant analysis of the cagY gene based on virtual hybridization.
A: Linear discriminant analysis (LDA) of the complete cagY gene, where ancestry clusters are clearly defined; B: LDA of the cagY middle repeat region region, showing a population structure with lower resolution. LD: Linear discriminant.
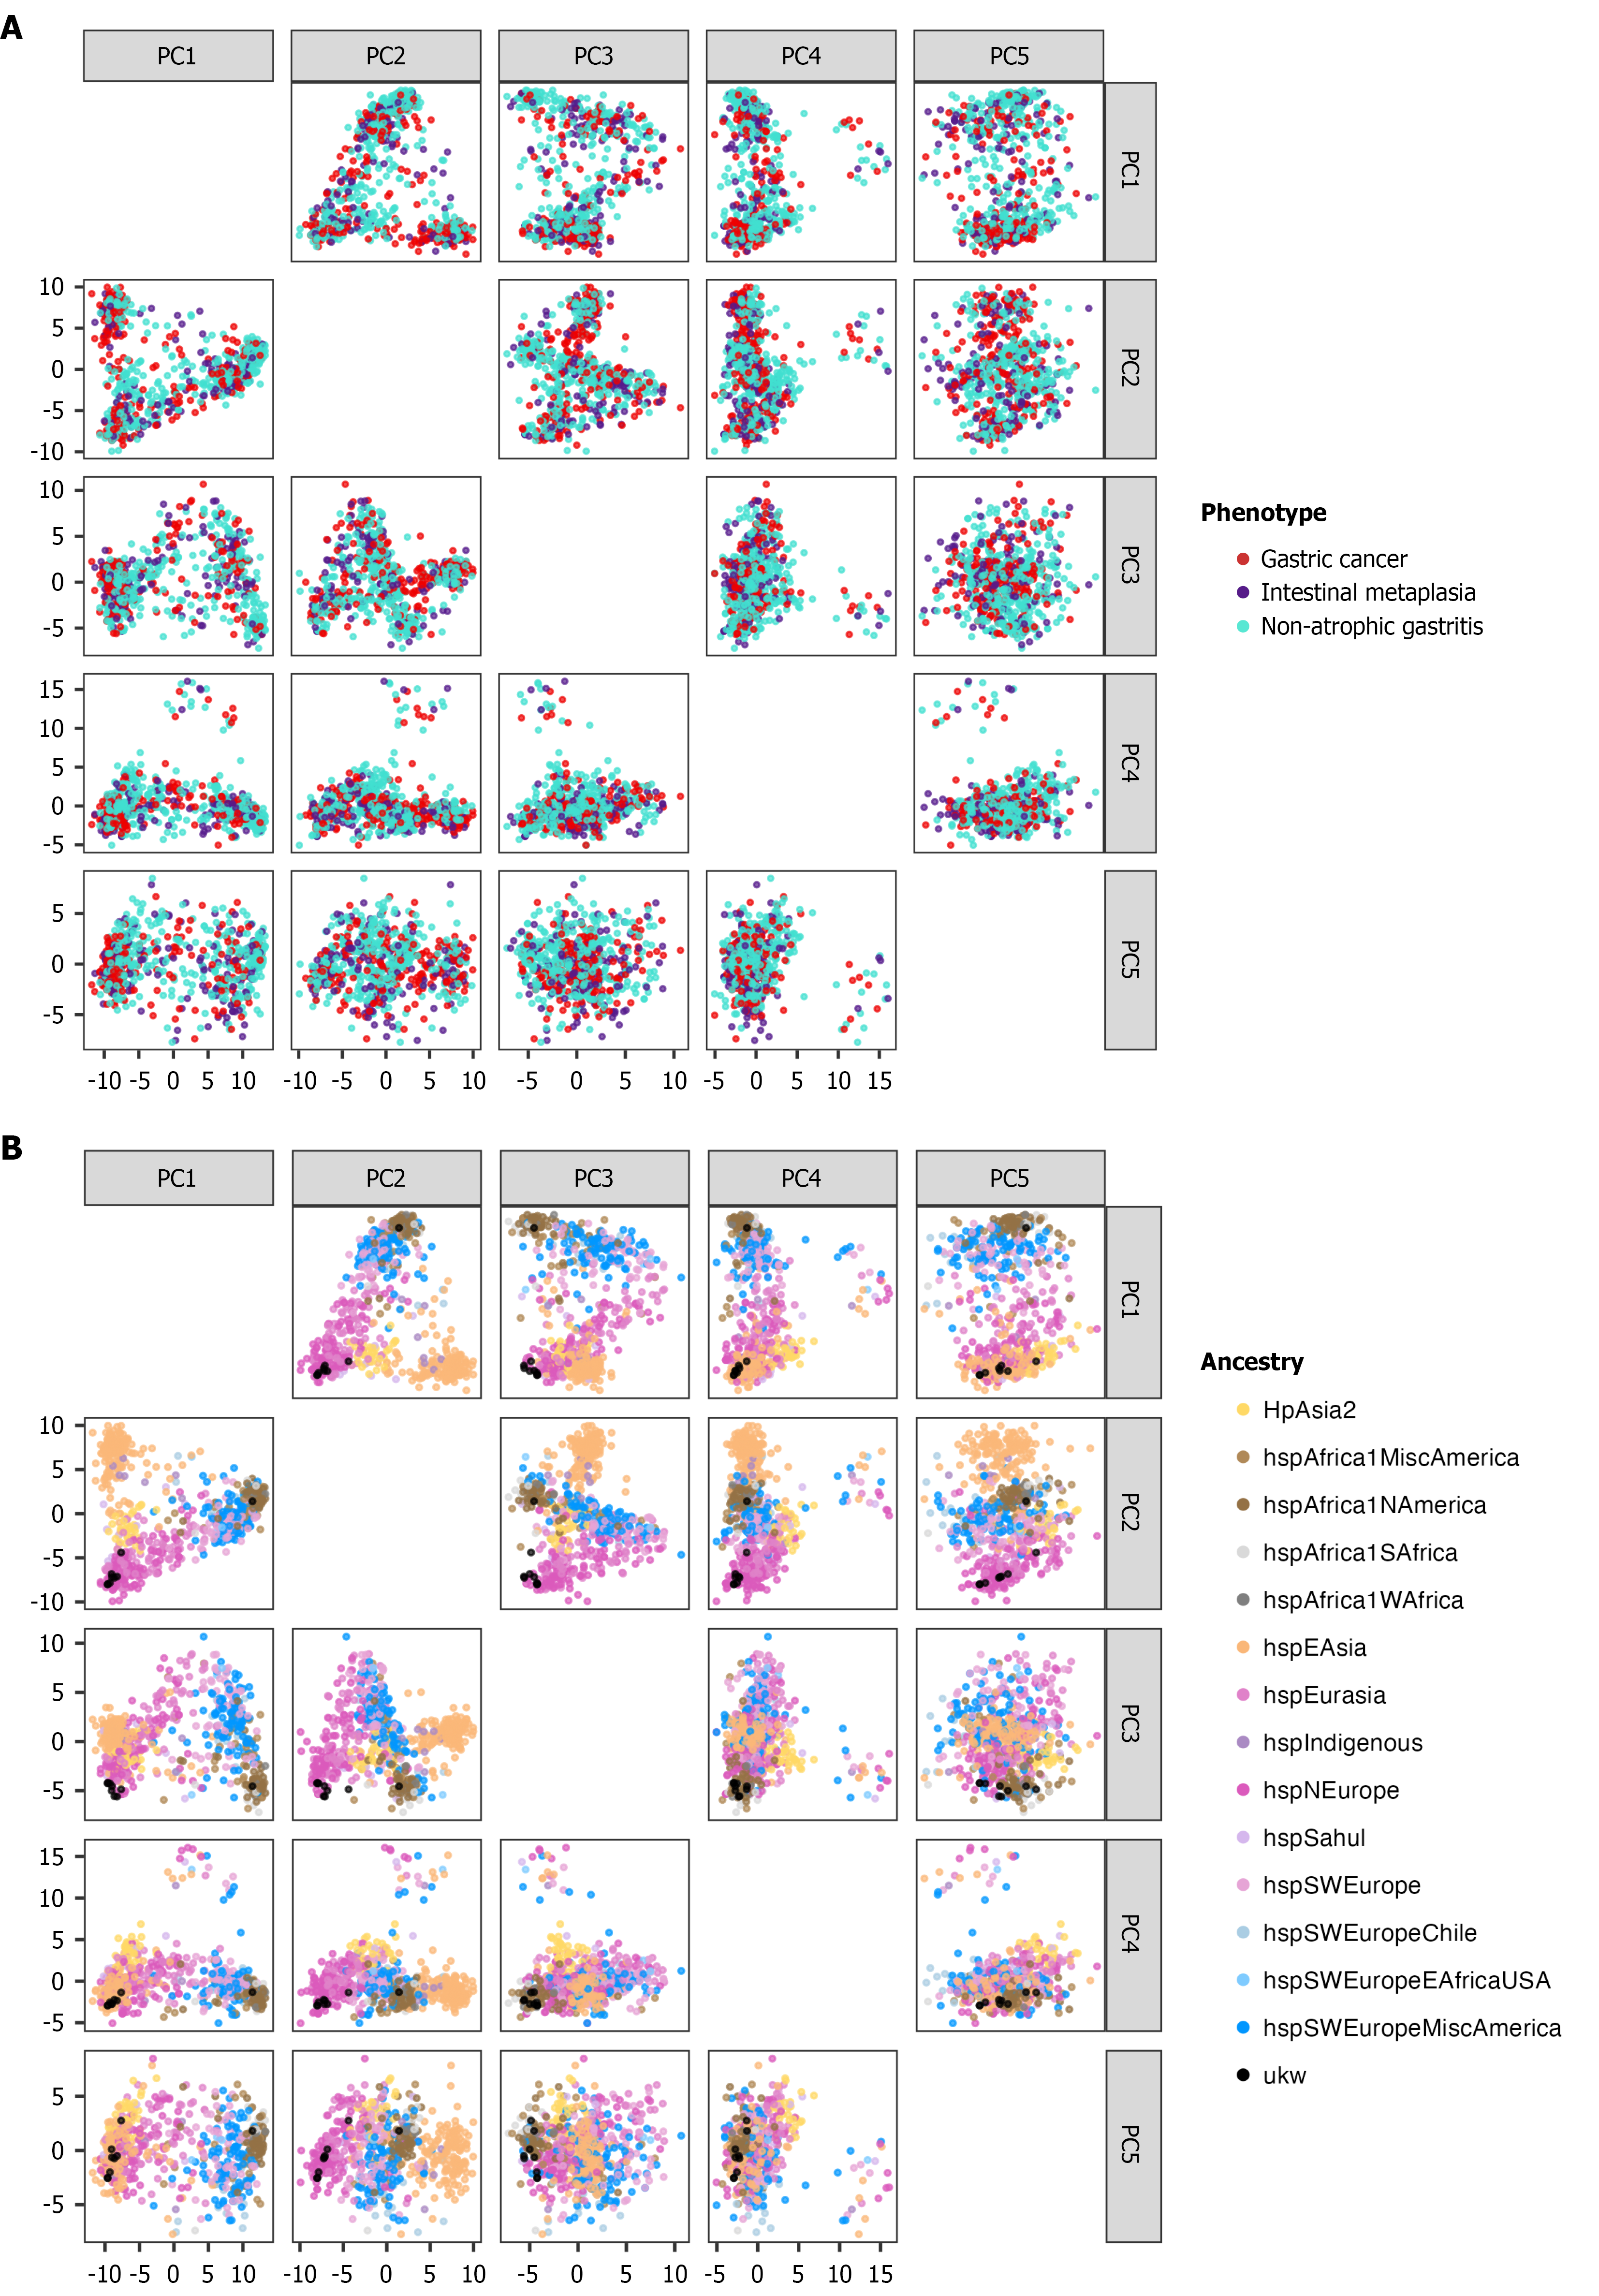
Figure 3 Principal component analysis for the presence/absence unitig matrix.
A: Principal component analysis (PCA) of the first 5 principal components. The first 2 components show a clear association with the Helicobacter pylori population structure, while the last 3 components do not exhibit association with the population structure; B: PCA of the first 5 principal components in relation to the disease group, where no association was observed. PC: Principal component.
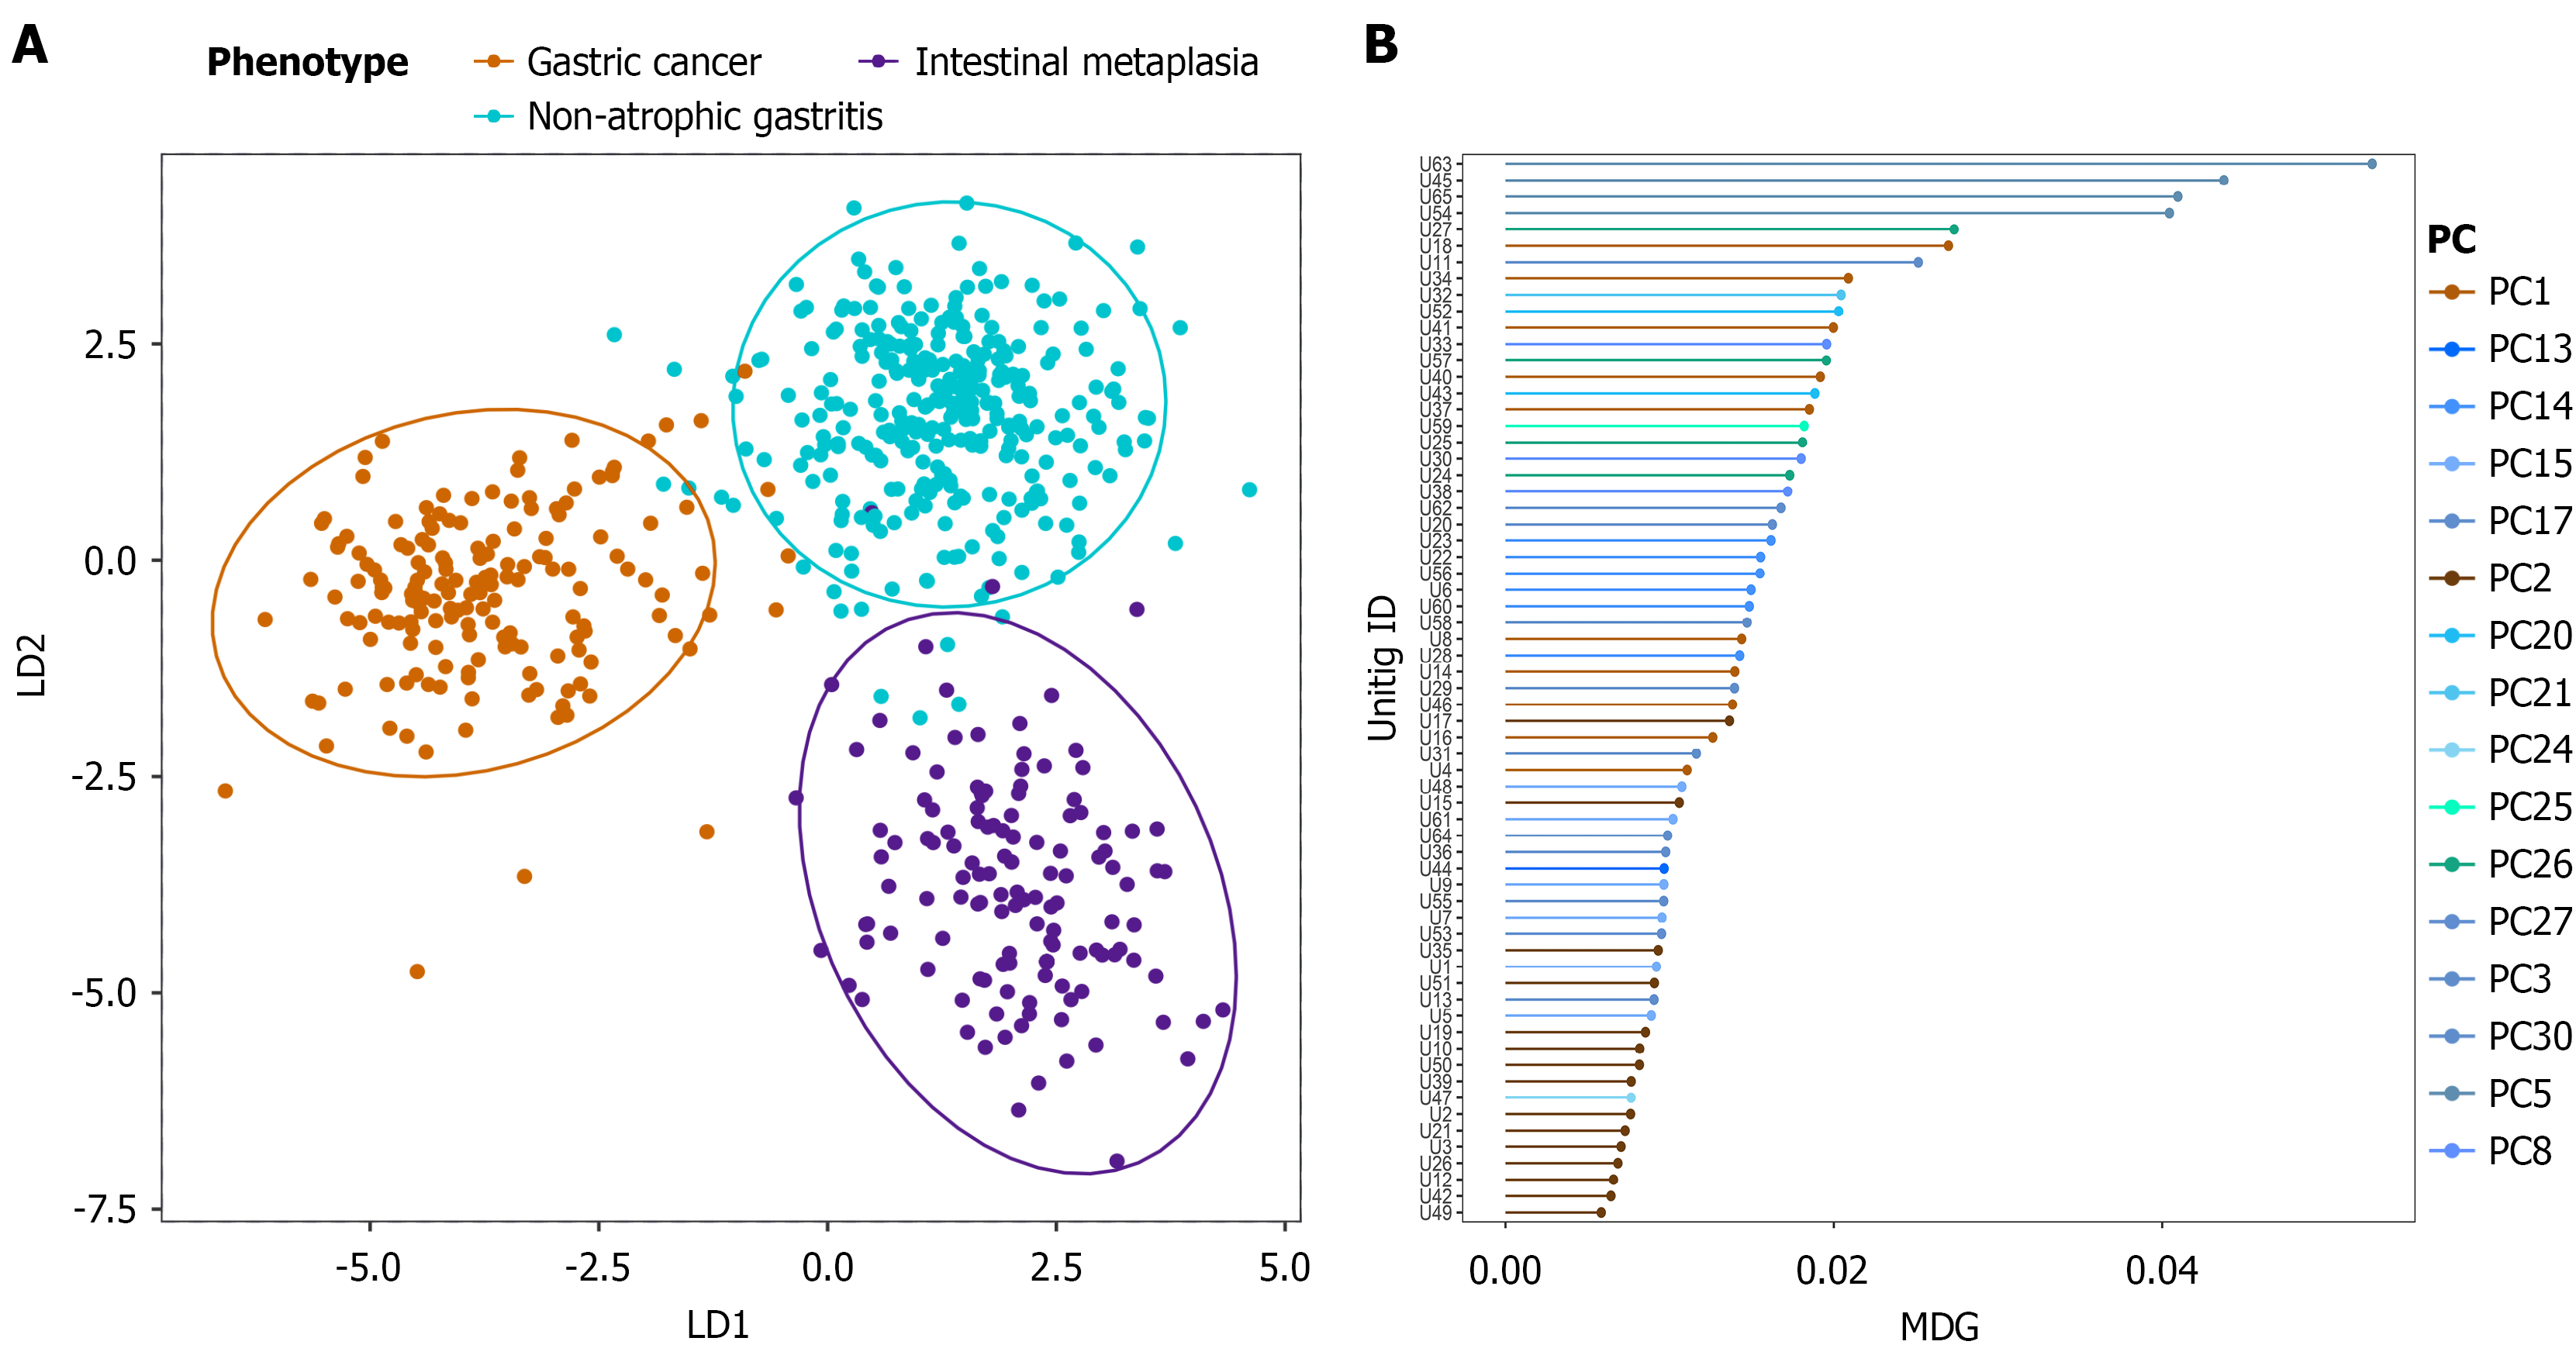
Figure 4 Machine learning analysis of cagY gene unitigs.
A: Linear discriminant analysis of the presence/absence matrix of unitigs. The analysis shows the clustering based on disease group; B: Mean decrease gini (MDG) values of significant unitigs, where the color represents the principal component (PC) associated with each unitig. The highest MDG values tend to be related with higher PCs, which in turn present the lowest association with population structure. LD: Linear discriminant; PC: Principal component; MDG: Mean decrease gini.
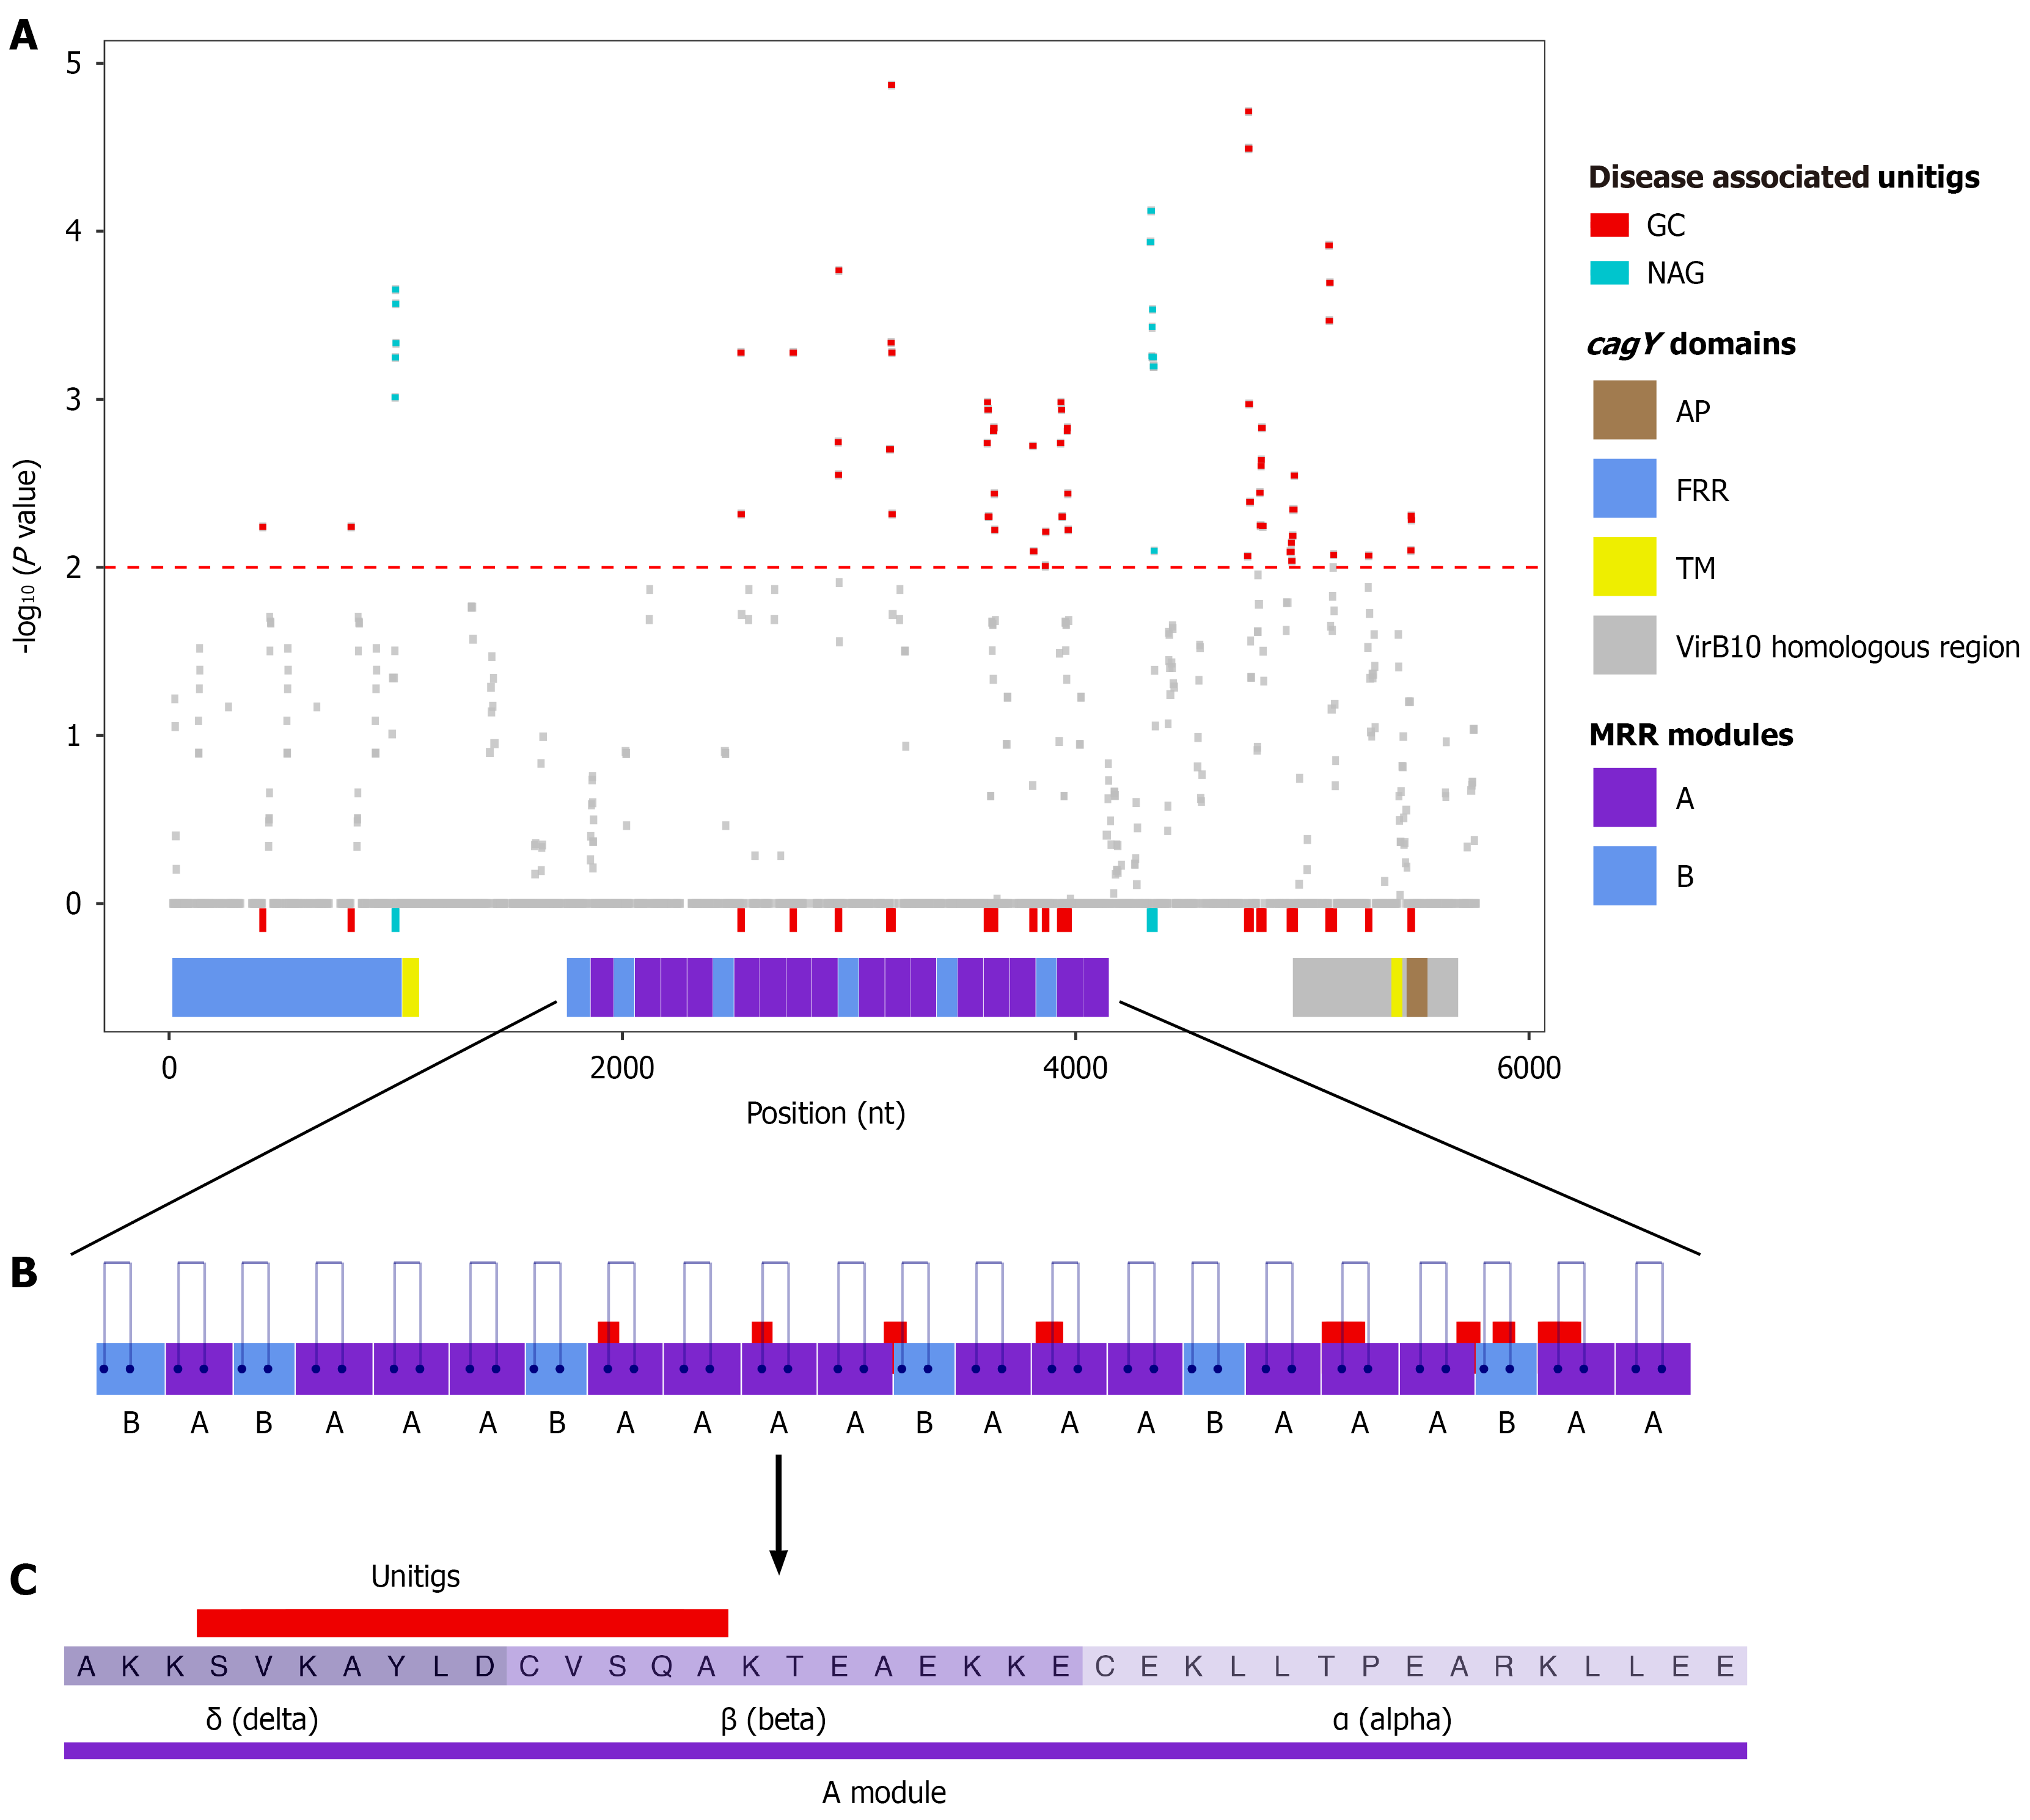
Figure 5 Association of cagY gene variations with gastric cancer and non-atrophic gastritis phenotypes.
A: Manhattan plot of cagY sequence mapping with all evaluated unitigs. Red and turquoise dots represent unitigs significantly associated (P value < 0.01) with gastric cancer or non-atrophic gastritis, respectively. cagY domains are schematically represented below the plot; B: Schematic of the middle repeat region (MRR) highlighting module A (purple) and module B (blue). Mapped regions of significant unitigs are shown above the modules, and blue lines indicate disulfide bridges; C: Consensus sequence of the MRR A module, where shades of purple distinguish the dma motifs. The red bar indicates the consensus region of the mapped unitigs. nt: Nucleotides; GC: Gastric cancer; NAG: Non-atrophic gastritis; AP: Antenna projection; FRR: Five prime repeat region; TM: Transmembrane region; MRR: Middle repeat region.
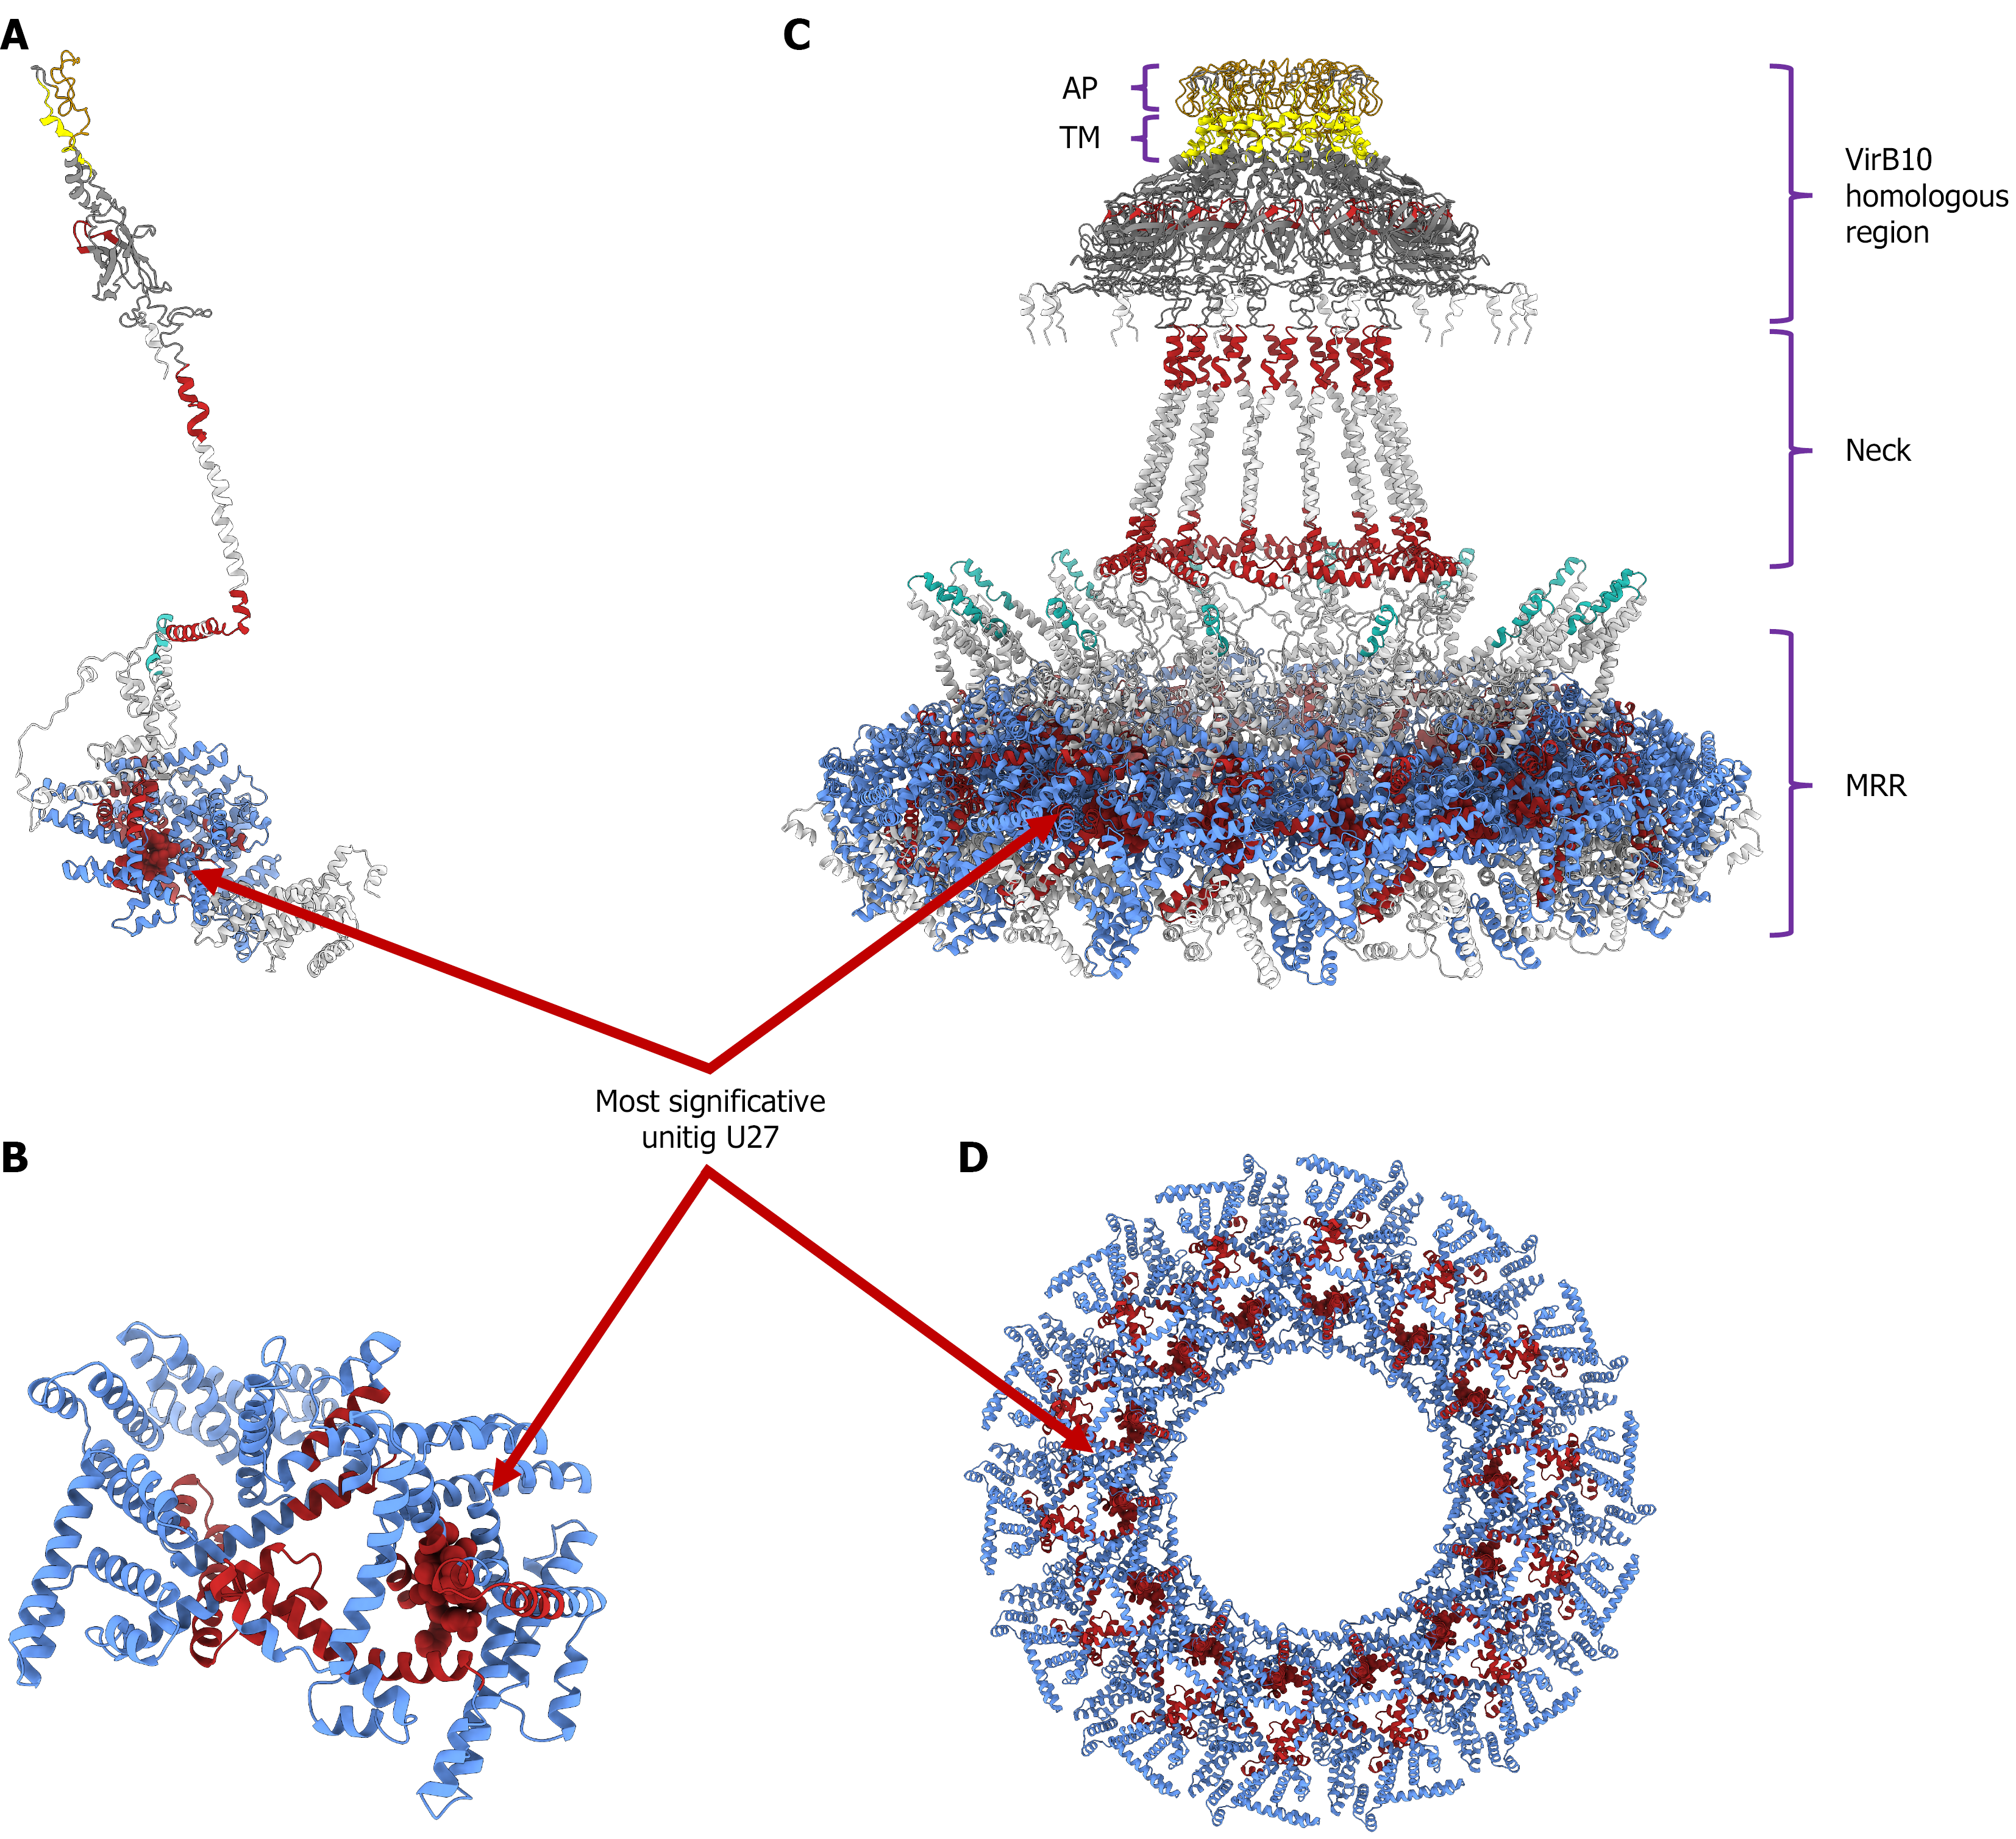
Figure 6 Three-dimensional structural models of the cagY protein (strain 26695) and disease-associated regions.
Structural domains and clinical associations are color-coded as follows: Middle repeat region (MRR) (blue), cagY backbone (white), transmembrane region (TM) (yellow), non-atrophic gastritis-associated regions (turquoise), and gastric cancer-associated regions (red). A: Structural model of the cagY monomer, showing the spatial distribution of significant phenotype-associated regions (P < 0.01); B: Close-up view of the monomeric MRR, highlighting the specific locus of the most significant unitig (U27); C: Lateral view of the multimeric cagY complex assembly, detailing the vertical organization of the VirB10 homologous region comprising the antenna projection and TM domains, the neck, and the base MRR; D: Axial (top-down) view of the multimeric MRR tunnel, showing the ring-like distribution and exposure of the most significant unitig (U27). AP: Antenna projection; TM: Transmembrane region; MRR: Middle repeat region.
- Citation: López-Luis MA, Torres RC, Solnick JV, Camargo MC, Méndez-Tenorio A, Torres J. In-depth analysis of cagY in worldwide Helicobacter pylori strains unmasks a strong correlation between sequence diversity and gastric cancer. World J Gastroenterol 2027; 33(3): 123466
- URL: https://www.wjgnet.com/1007-9327/full/v33/i3/123466.htm
- DOI: https://dx.doi.org/10.3748/wjg.123466