
















Copyright: ©Author(s) 2026.
World J Gastroenterol. Jan 21, 2027; 33(3): 123466
Published online Jan 21, 2027. doi: 10.3748/wjg.123466
Published online Jan 21, 2027. doi: 10.3748/wjg.123466
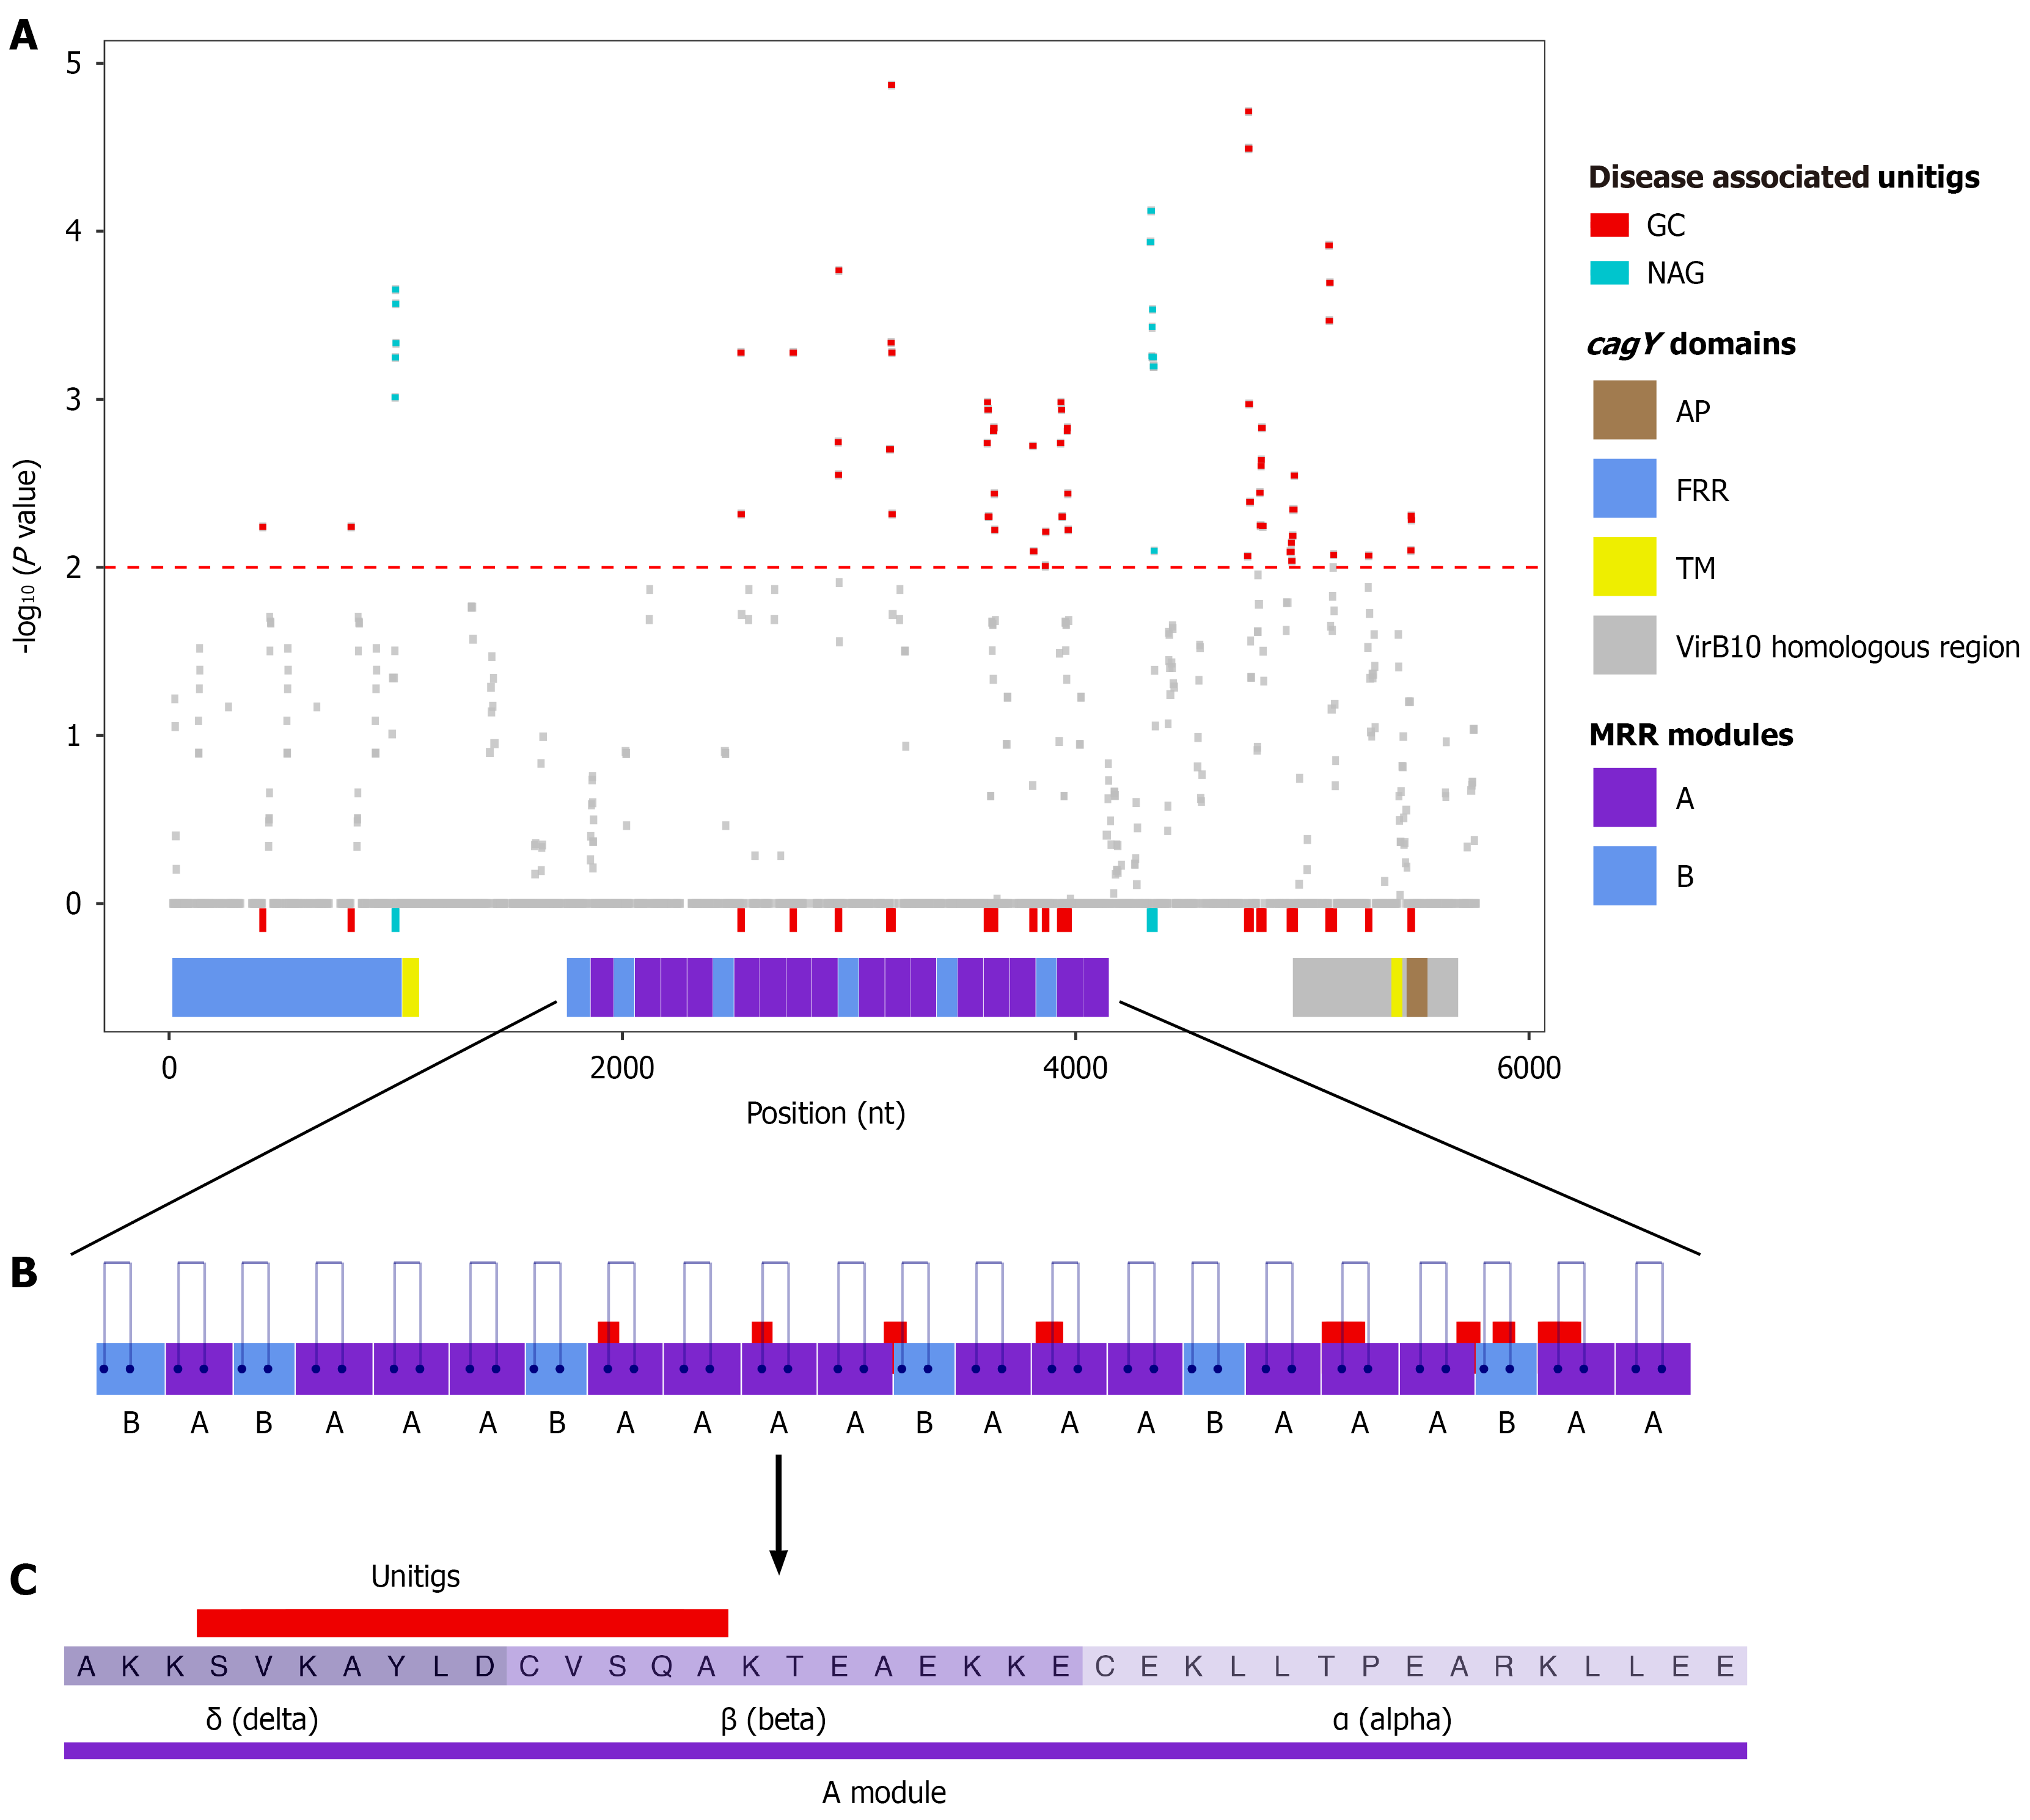
Figure 5 Association of cagY gene variations with gastric cancer and non-atrophic gastritis phenotypes.
A: Manhattan plot of cagY sequence mapping with all evaluated unitigs. Red and turquoise dots represent unitigs significantly associated (P value < 0.01) with gastric cancer or non-atrophic gastritis, respectively. cagY domains are schematically represented below the plot; B: Schematic of the middle repeat region (MRR) highlighting module A (purple) and module B (blue). Mapped regions of significant unitigs are shown above the modules, and blue lines indicate disulfide bridges; C: Consensus sequence of the MRR A module, where shades of purple distinguish the dma motifs. The red bar indicates the consensus region of the mapped unitigs. nt: Nucleotides; GC: Gastric cancer; NAG: Non-atrophic gastritis; AP: Antenna projection; FRR: Five prime repeat region; TM: Transmembrane region; MRR: Middle repeat region.
- Citation: López-Luis MA, Torres RC, Solnick JV, Camargo MC, Méndez-Tenorio A, Torres J. In-depth analysis of cagY in worldwide Helicobacter pylori strains unmasks a strong correlation between sequence diversity and gastric cancer. World J Gastroenterol 2027; 33(3): 123466
- URL: https://www.wjgnet.com/1007-9327/full/v33/i3/123466.htm
- DOI: https://dx.doi.org/10.3748/wjg.123466