
















Copyright: ©Author(s) 2026.
World J Gastroenterol. Jan 21, 2027; 33(3): 123466
Published online Jan 21, 2027. doi: 10.3748/wjg.123466
Published online Jan 21, 2027. doi: 10.3748/wjg.123466
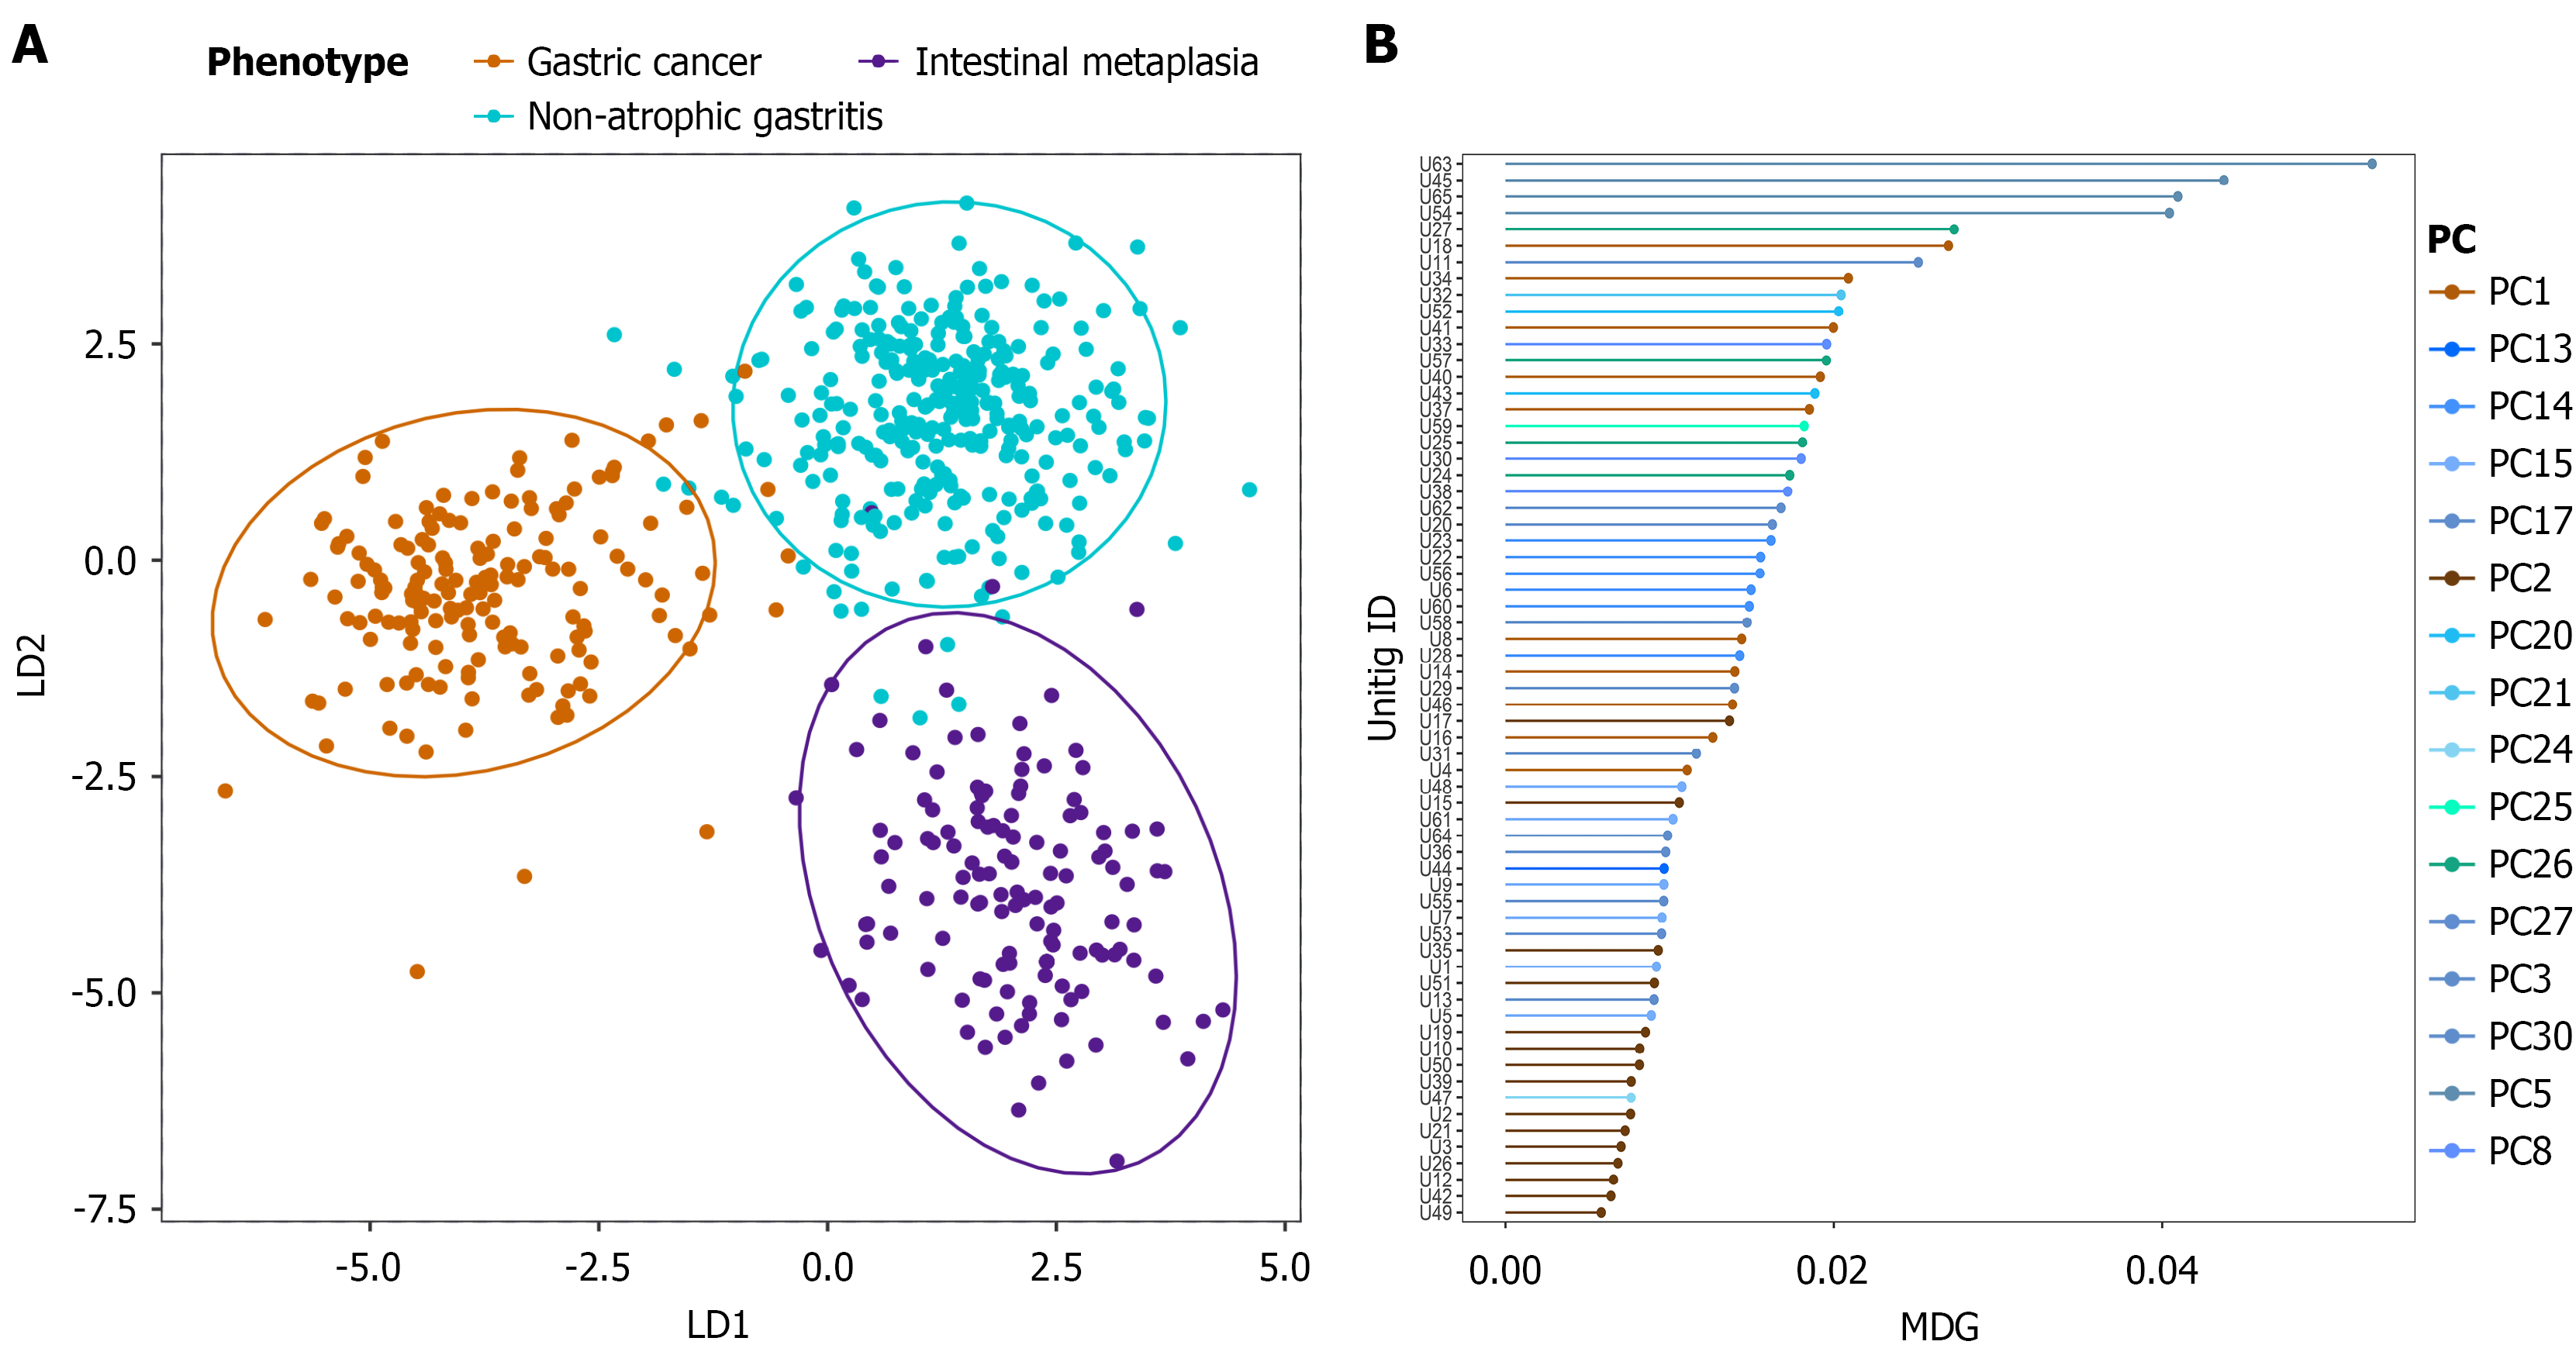
Figure 4 Machine learning analysis of cagY gene unitigs.
A: Linear discriminant analysis of the presence/absence matrix of unitigs. The analysis shows the clustering based on disease group; B: Mean decrease gini (MDG) values of significant unitigs, where the color represents the principal component (PC) associated with each unitig. The highest MDG values tend to be related with higher PCs, which in turn present the lowest association with population structure. LD: Linear discriminant; PC: Principal component; MDG: Mean decrease gini.
- Citation: López-Luis MA, Torres RC, Solnick JV, Camargo MC, Méndez-Tenorio A, Torres J. In-depth analysis of cagY in worldwide Helicobacter pylori strains unmasks a strong correlation between sequence diversity and gastric cancer. World J Gastroenterol 2027; 33(3): 123466
- URL: https://www.wjgnet.com/1007-9327/full/v33/i3/123466.htm
- DOI: https://dx.doi.org/10.3748/wjg.123466