
















Copyright: ©Author(s) 2026.
World J Gastroenterol. Oct 28, 2026; 32(40): 120447
Published online Oct 28, 2026. doi: 10.3748/wjg.120447
Published online Oct 28, 2026. doi: 10.3748/wjg.120447
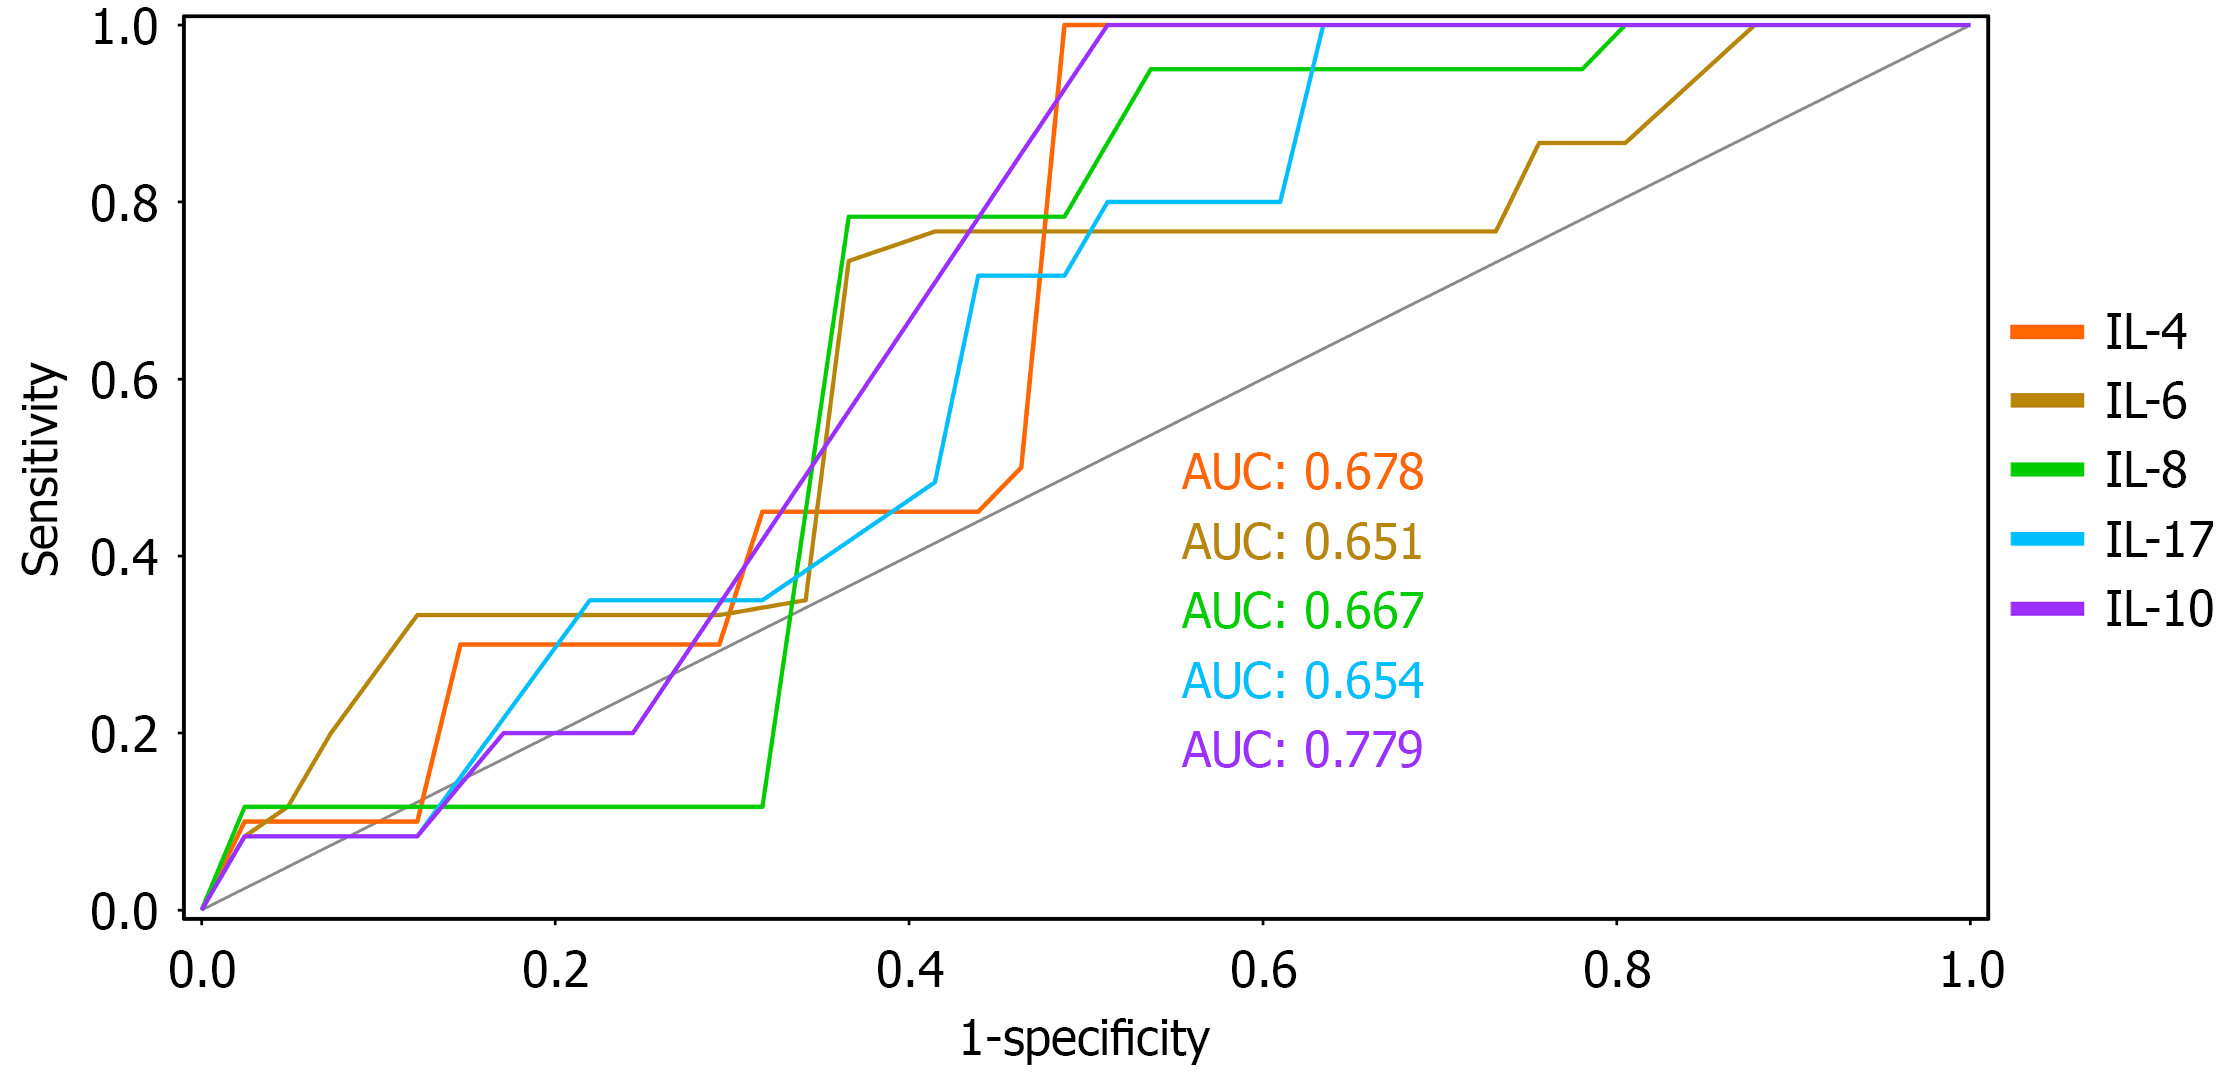
Figure 1 Receiver operating characteristic curves for prediction of death by pre-immunotherapy cytokine levels in gastric cancer patients.
ROC: Receiver operating characteristic; AUC: Area under the curve; IL: Interleukin; OS: Overall survival.
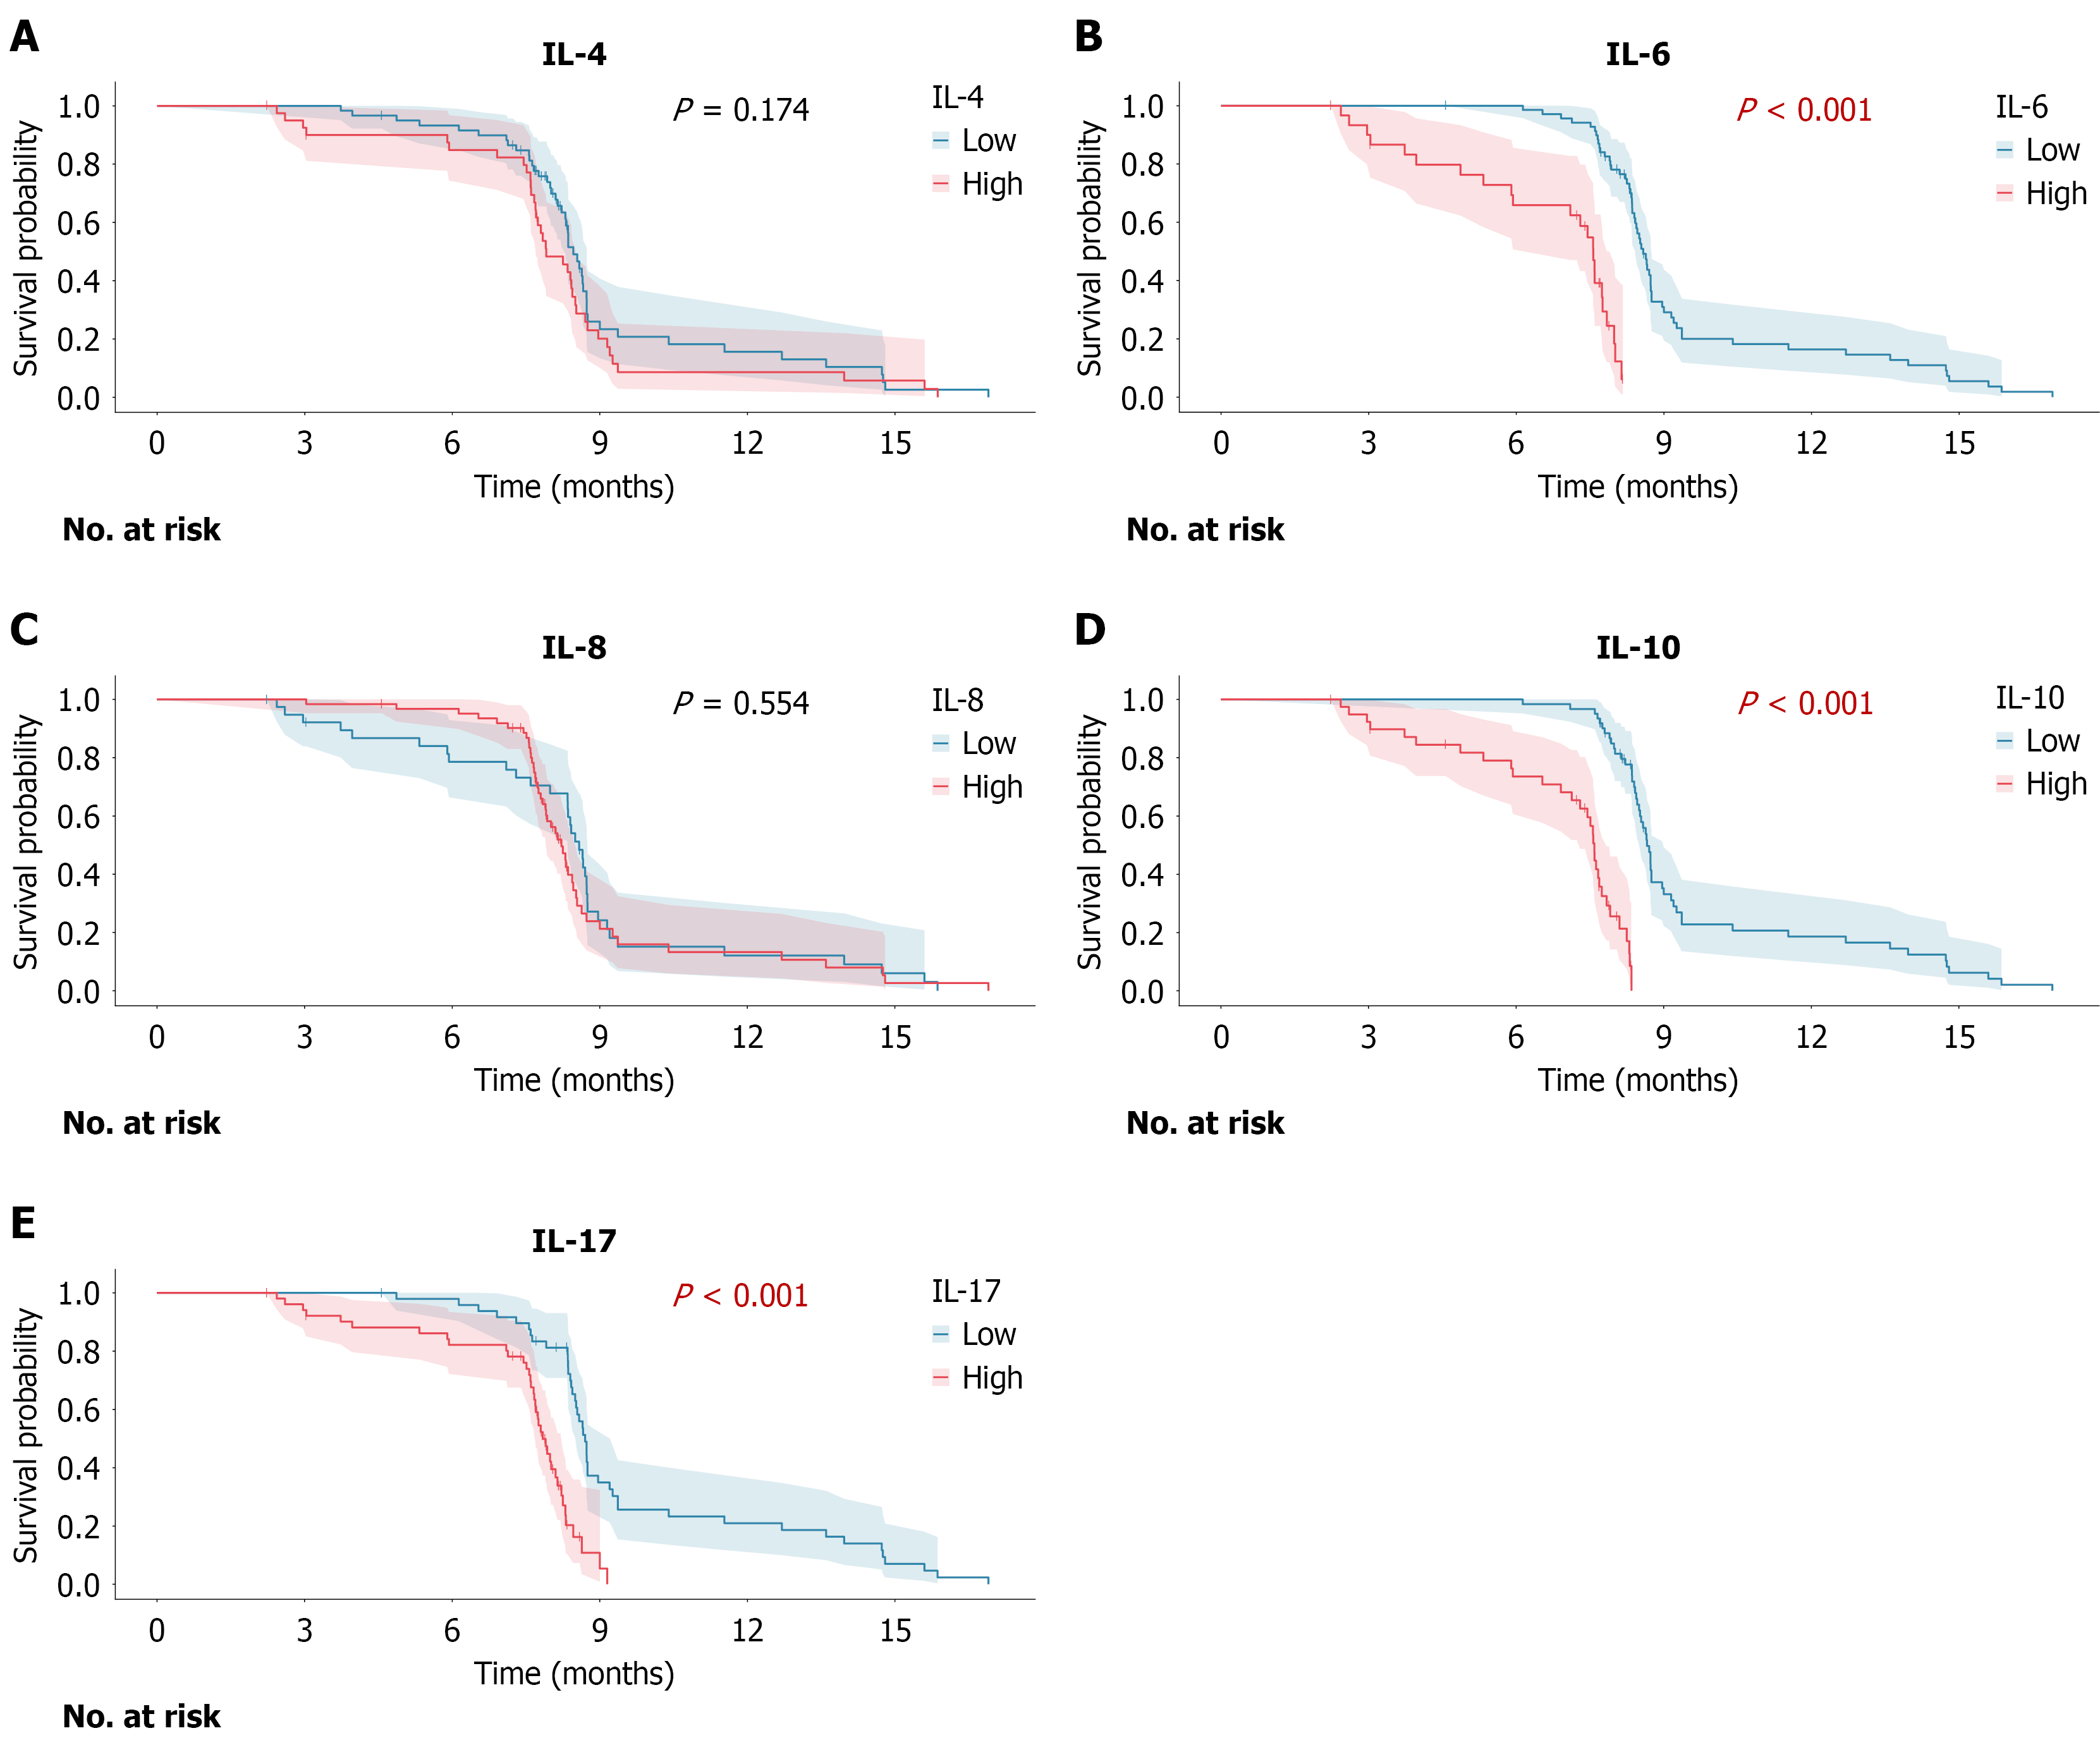
Figure 2 Survival curves of progression free survival for two groups of patients.
A: Interleukin (IL)-4; B: IL-6; C: IL-8; D: IL-10; E: IL-17. The shaded areas represent the 95%CIs. IL: Interleukin.
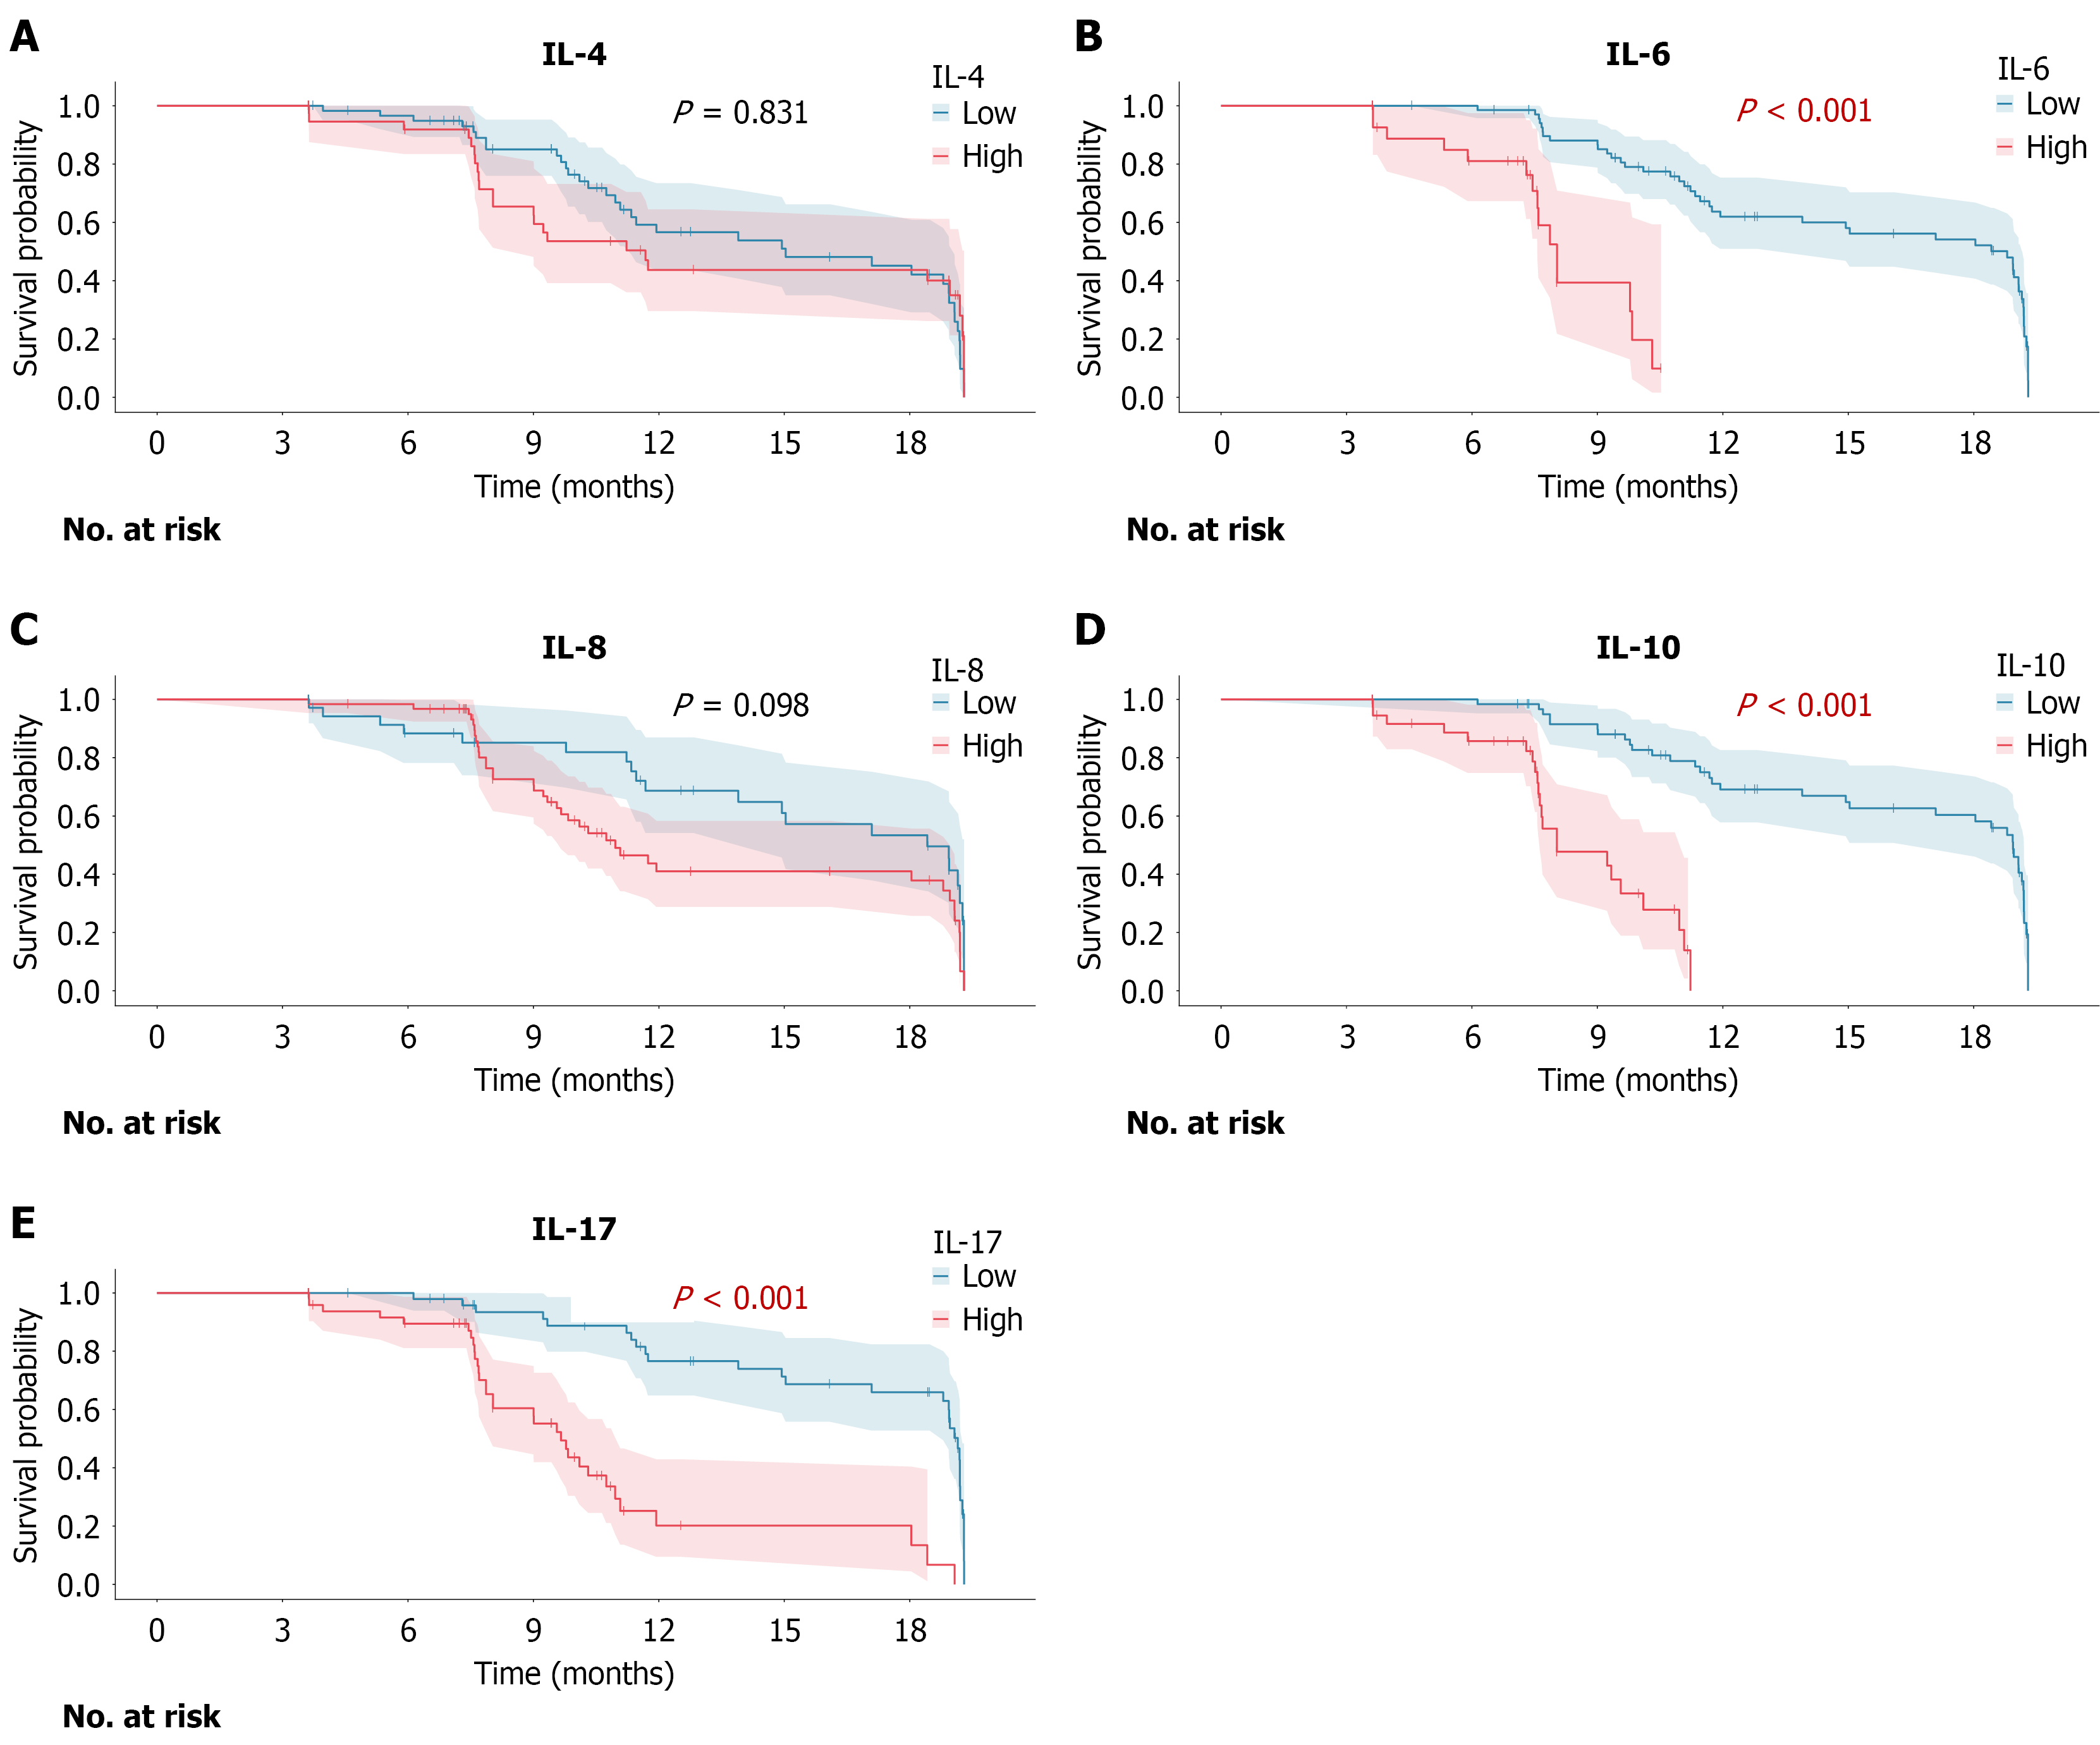
Figure 3 Survival curves of overall survival for two groups of patients.
A: Interleukin (IL)-4; B: IL-6; C: IL-8; D: IL-10; E: IL-17. The shaded areas represent the 95%CIs. IL: Interleukin.
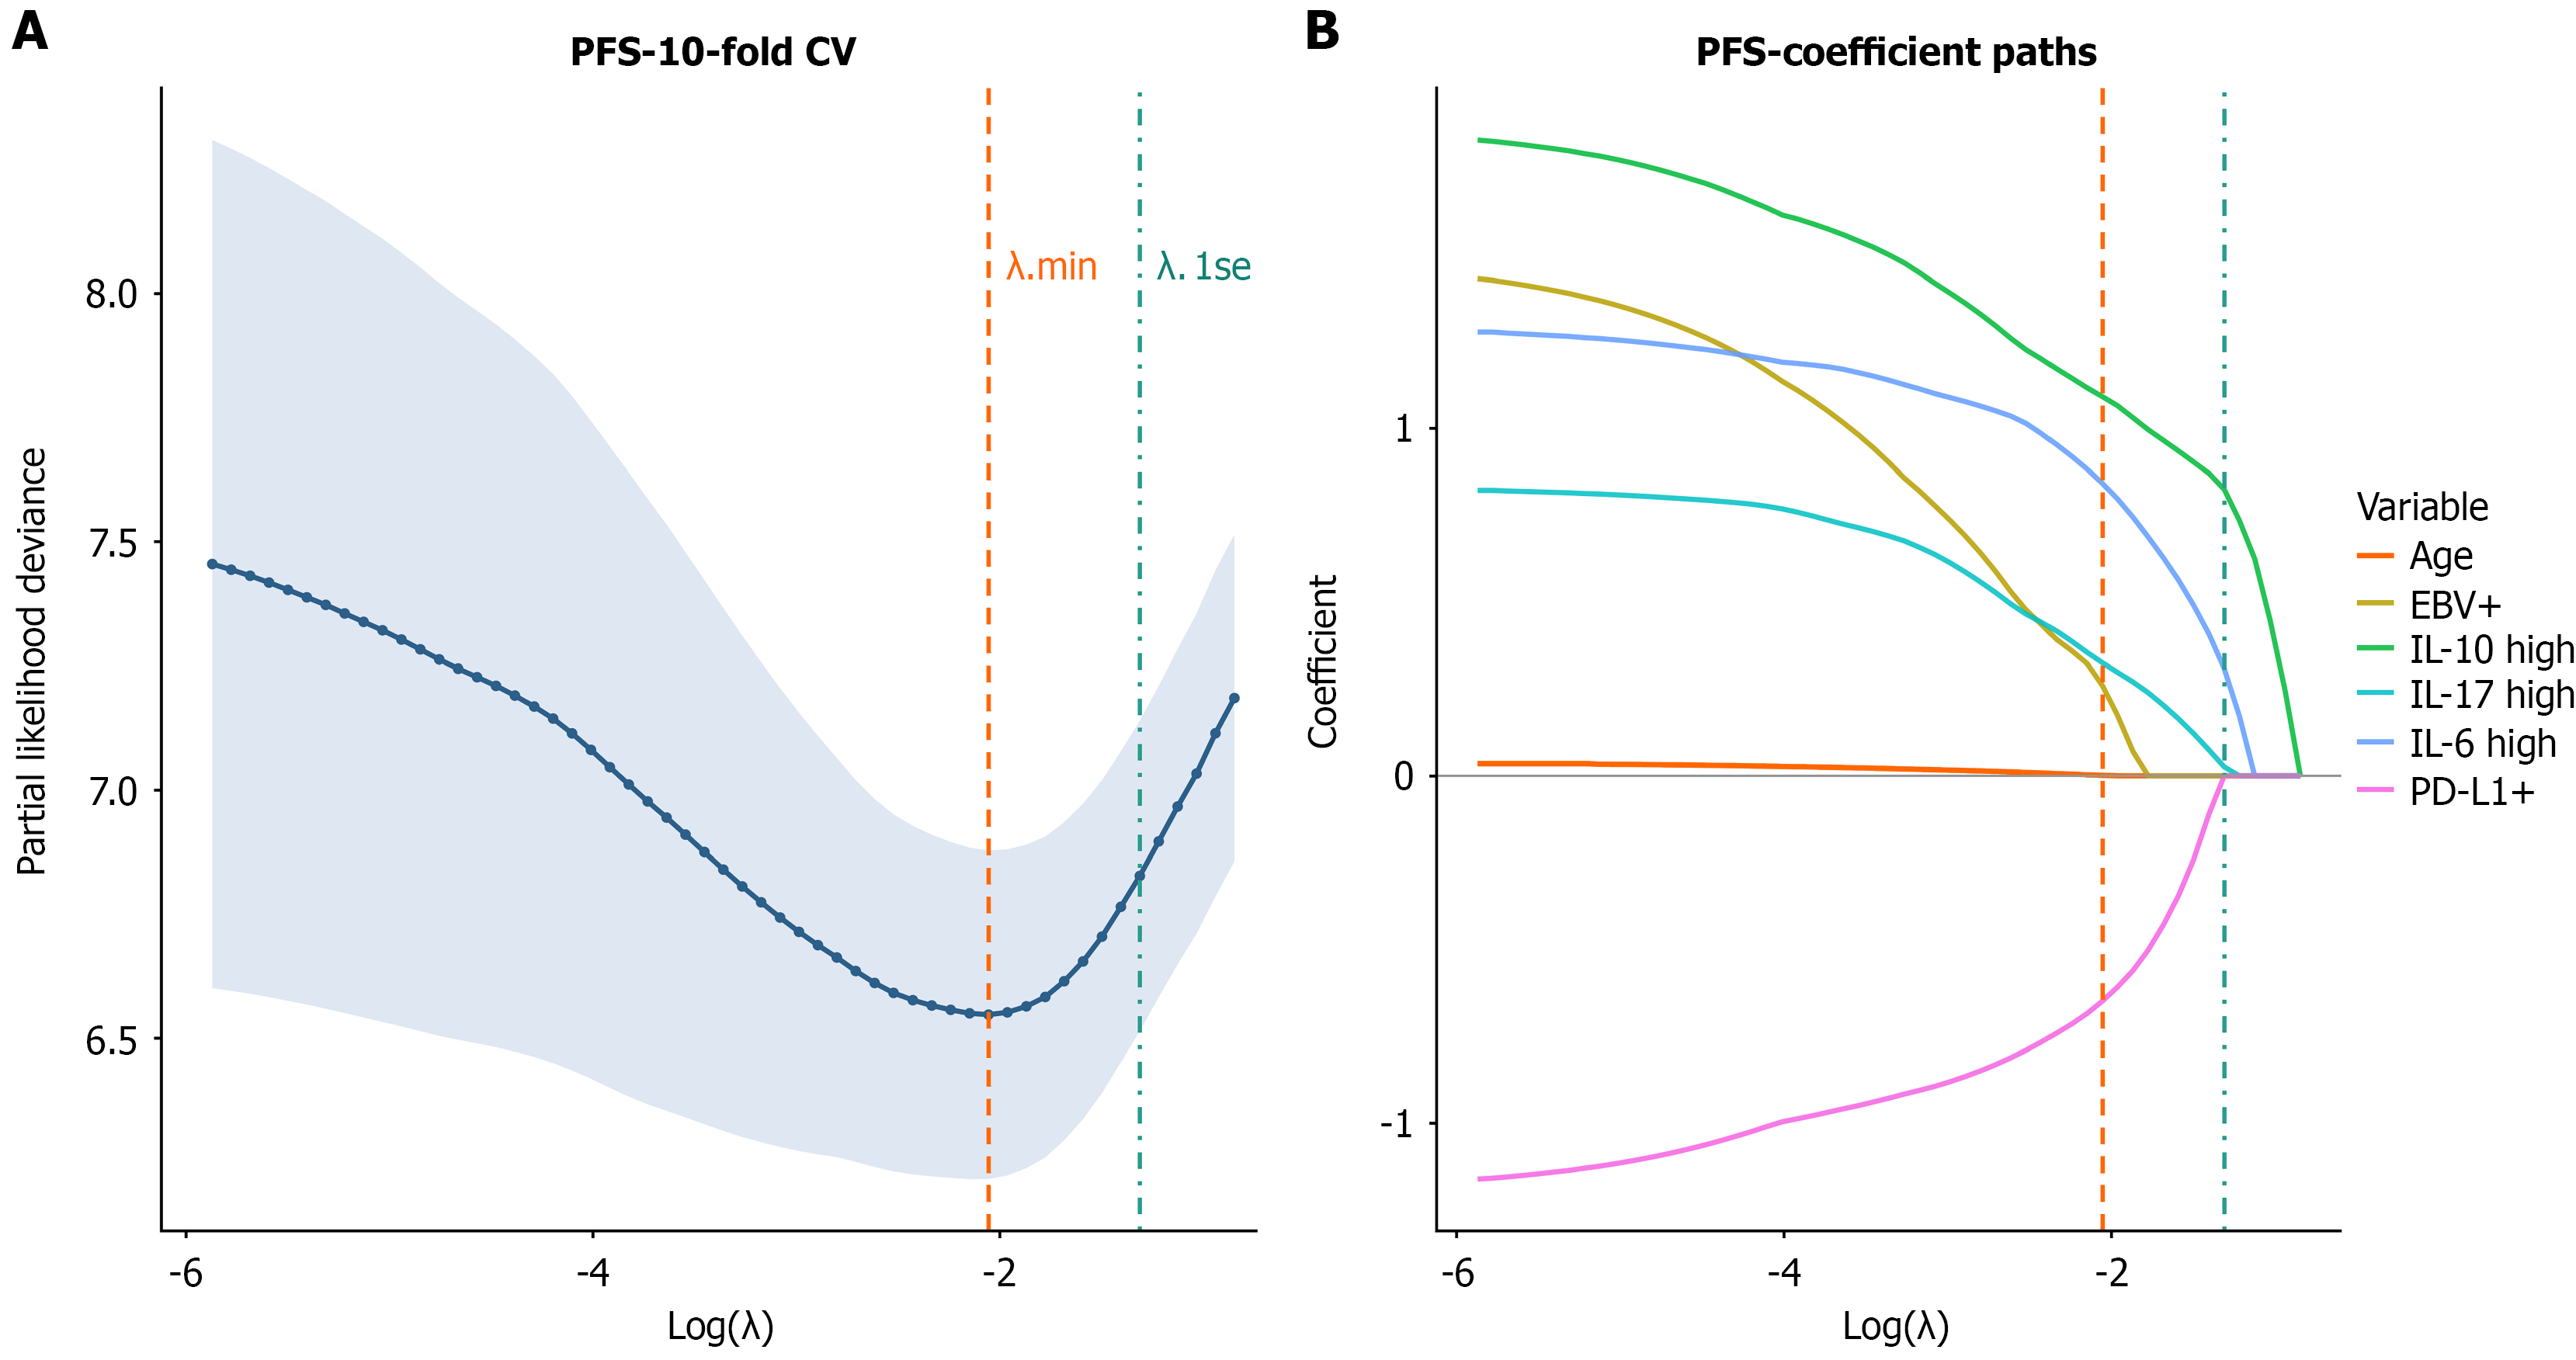
Figure 4 Least absolute shrinkage and selection operator-Cox regularization for progression-free survival.
A: Ten-fold cross-validation curve showing partial likelihood deviance as a function of log(λ); vertical dashed line indicates λ.min and dot-dashed line indicates λ.1se. Numbers along the top axis represent the count of non-zero coefficients at each λ; B: Coefficient shrinkage paths for all candidate variables; vertical lines correspond to λ.min and λ.1se. Three variables [interleukin (IL)-6 high, IL-10 high, IL-17 high] were retained at λ.1se. (n = 101). PFS: Progression-free survival; CV: Cross validation; EBV: Epstein-Barr virus; IL: Interleukin; PD-L1: Programmed death-ligand 1.
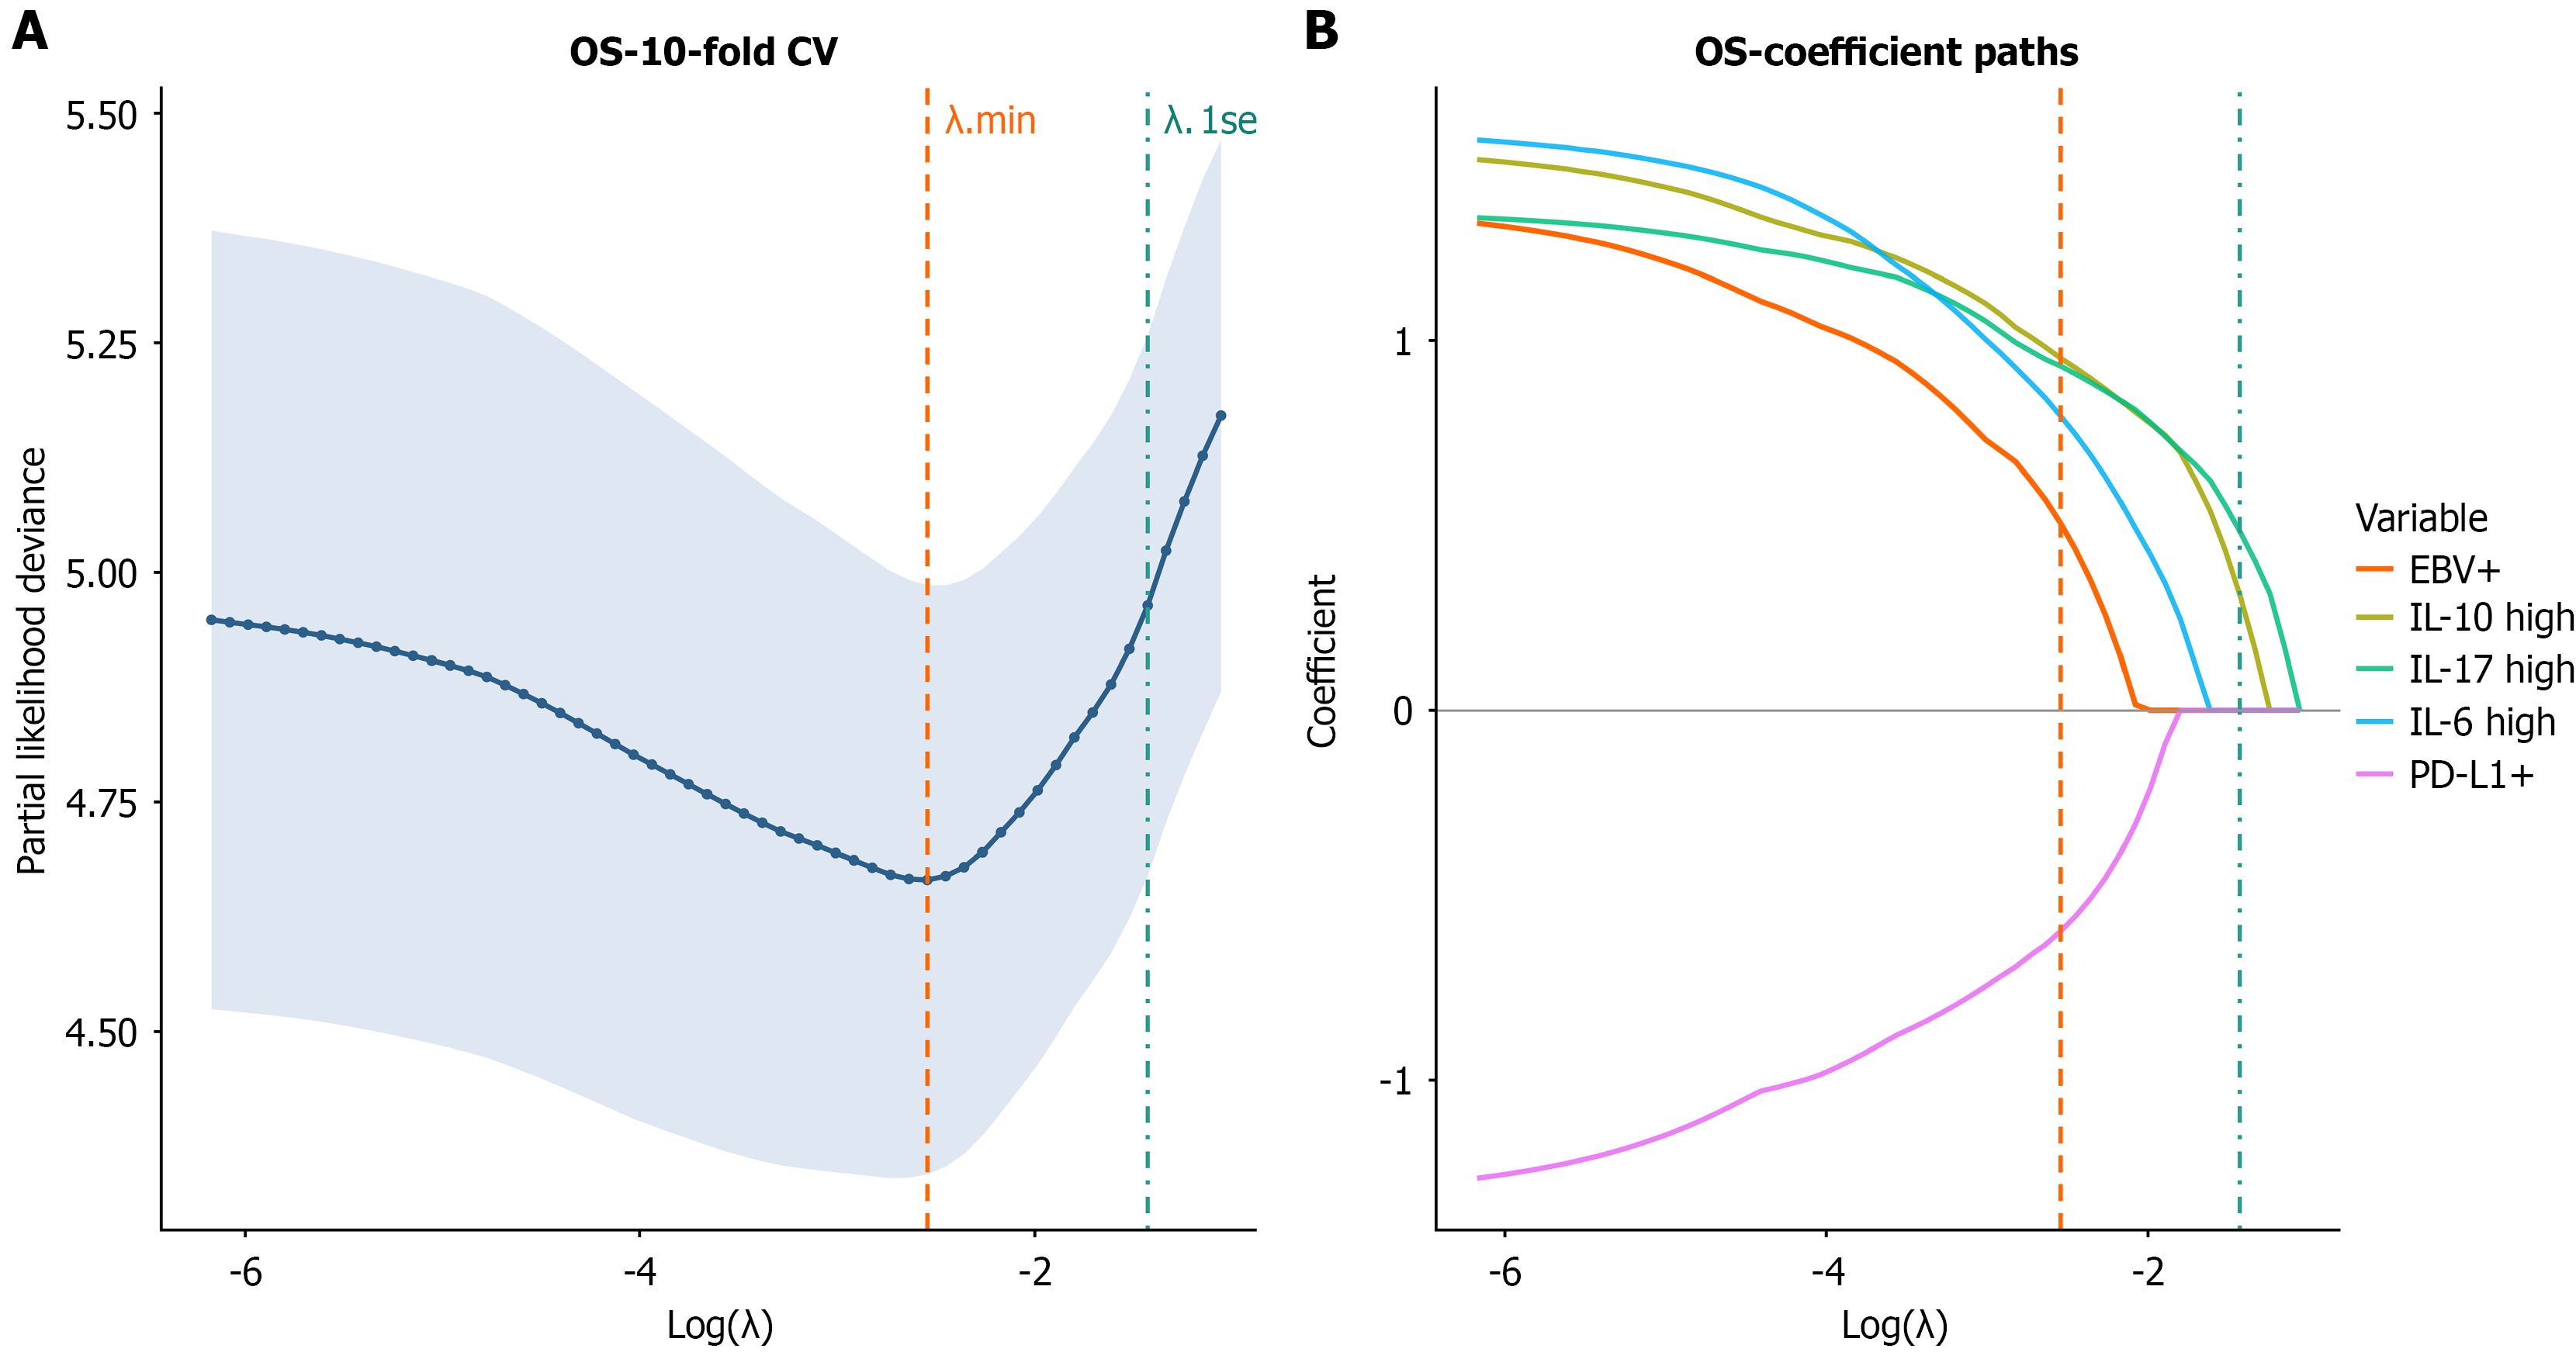
Figure 5 Least absolute shrinkage and selection operator-Cox regularization for overall survival.
A: Ten-fold cross-validation curve of partial likelihood deviance vs log(λ); vertical lines indicate λ.min and λ.1se; B: Coefficient shrinkage paths for all candidate variables. At λ.1se, interleukin (IL)-10 high and IL-17 high were retained as core predictors; IL-6, programmed death-ligand 1, and Epstein-Barr virus were additionally selected at λ.min (n = 101). OS: Overall survival; CV: Cross validation; EBV: Epstein-Barr virus; IL: Interleukin; PD-L1: Programmed death-ligand 1.
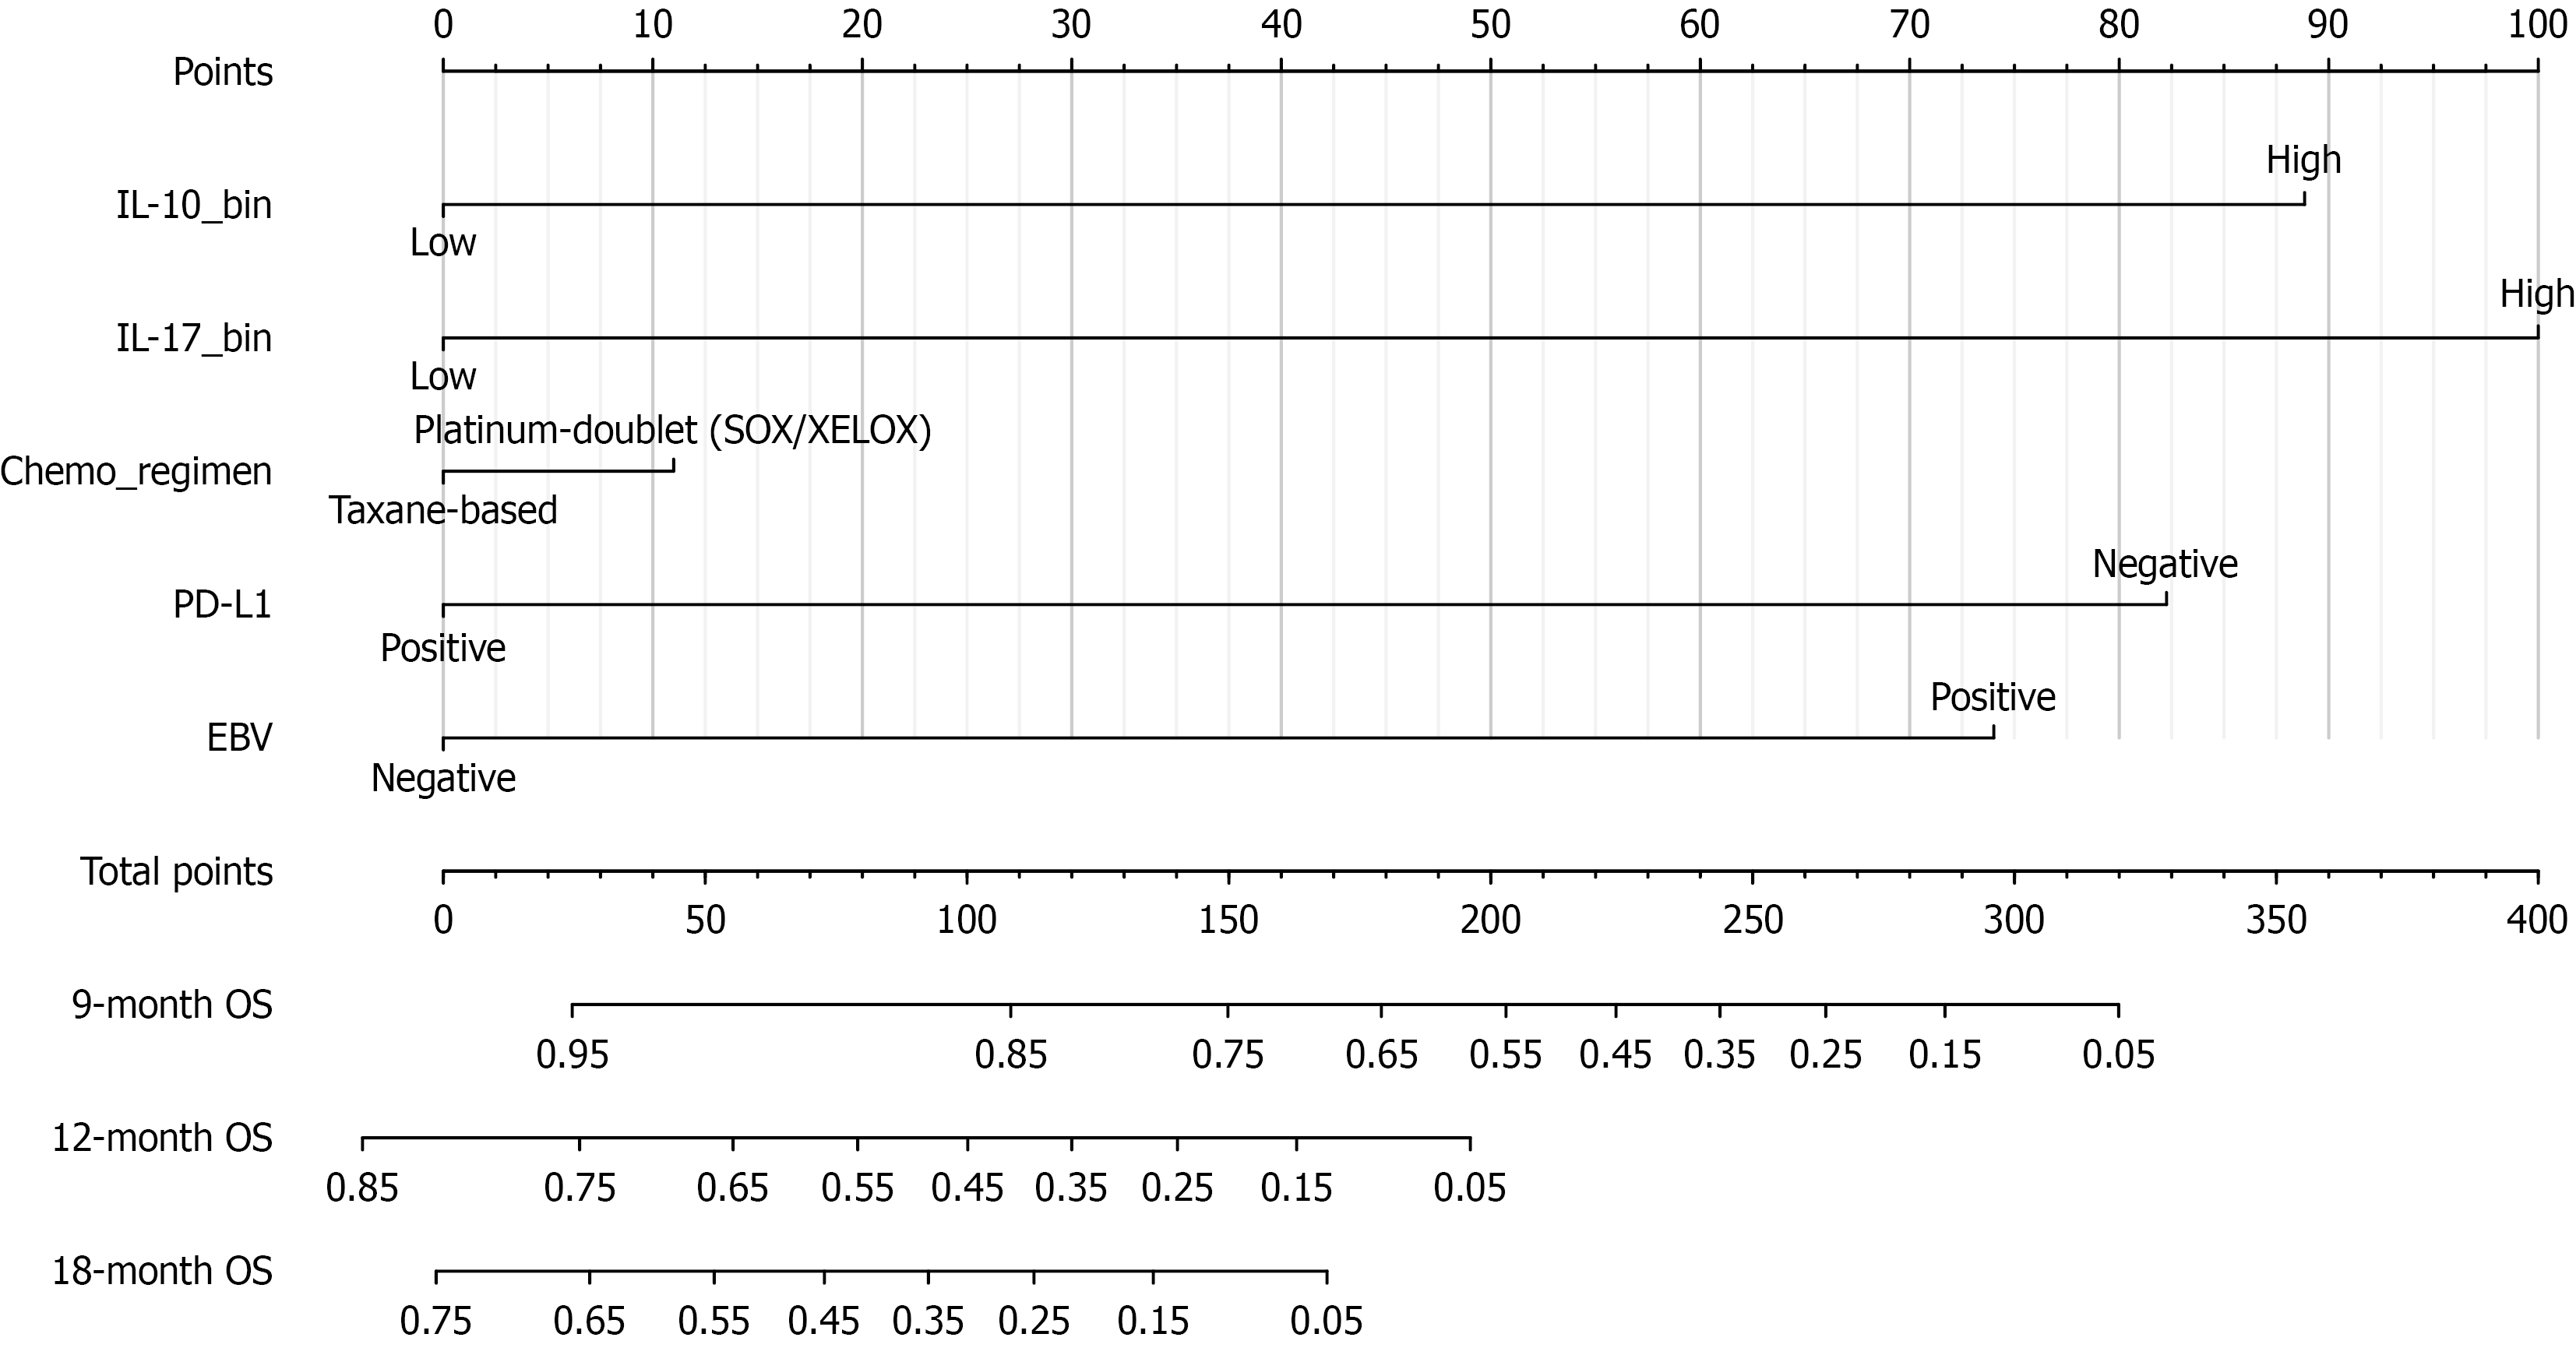
Figure 6 Nomogram for individualized prediction of 9-, 12-, and 18-month overall survival.
Each variable is assigned a point score based on its Firth-penalized Cox regression coefficient; the sum of individual scores corresponds to the predicted survival probability at each time point. The nomogram incorporates interleukin (IL)-10 expression status, IL-17 expression status, programmed death-ligand 1 expression, Epstein-Barr virus status, and chemotherapy regimen. OS: Overall survival; EBV: Epstein-Barr virus; IL: Interleukin; PD-L1: Programmed death-ligand 1.
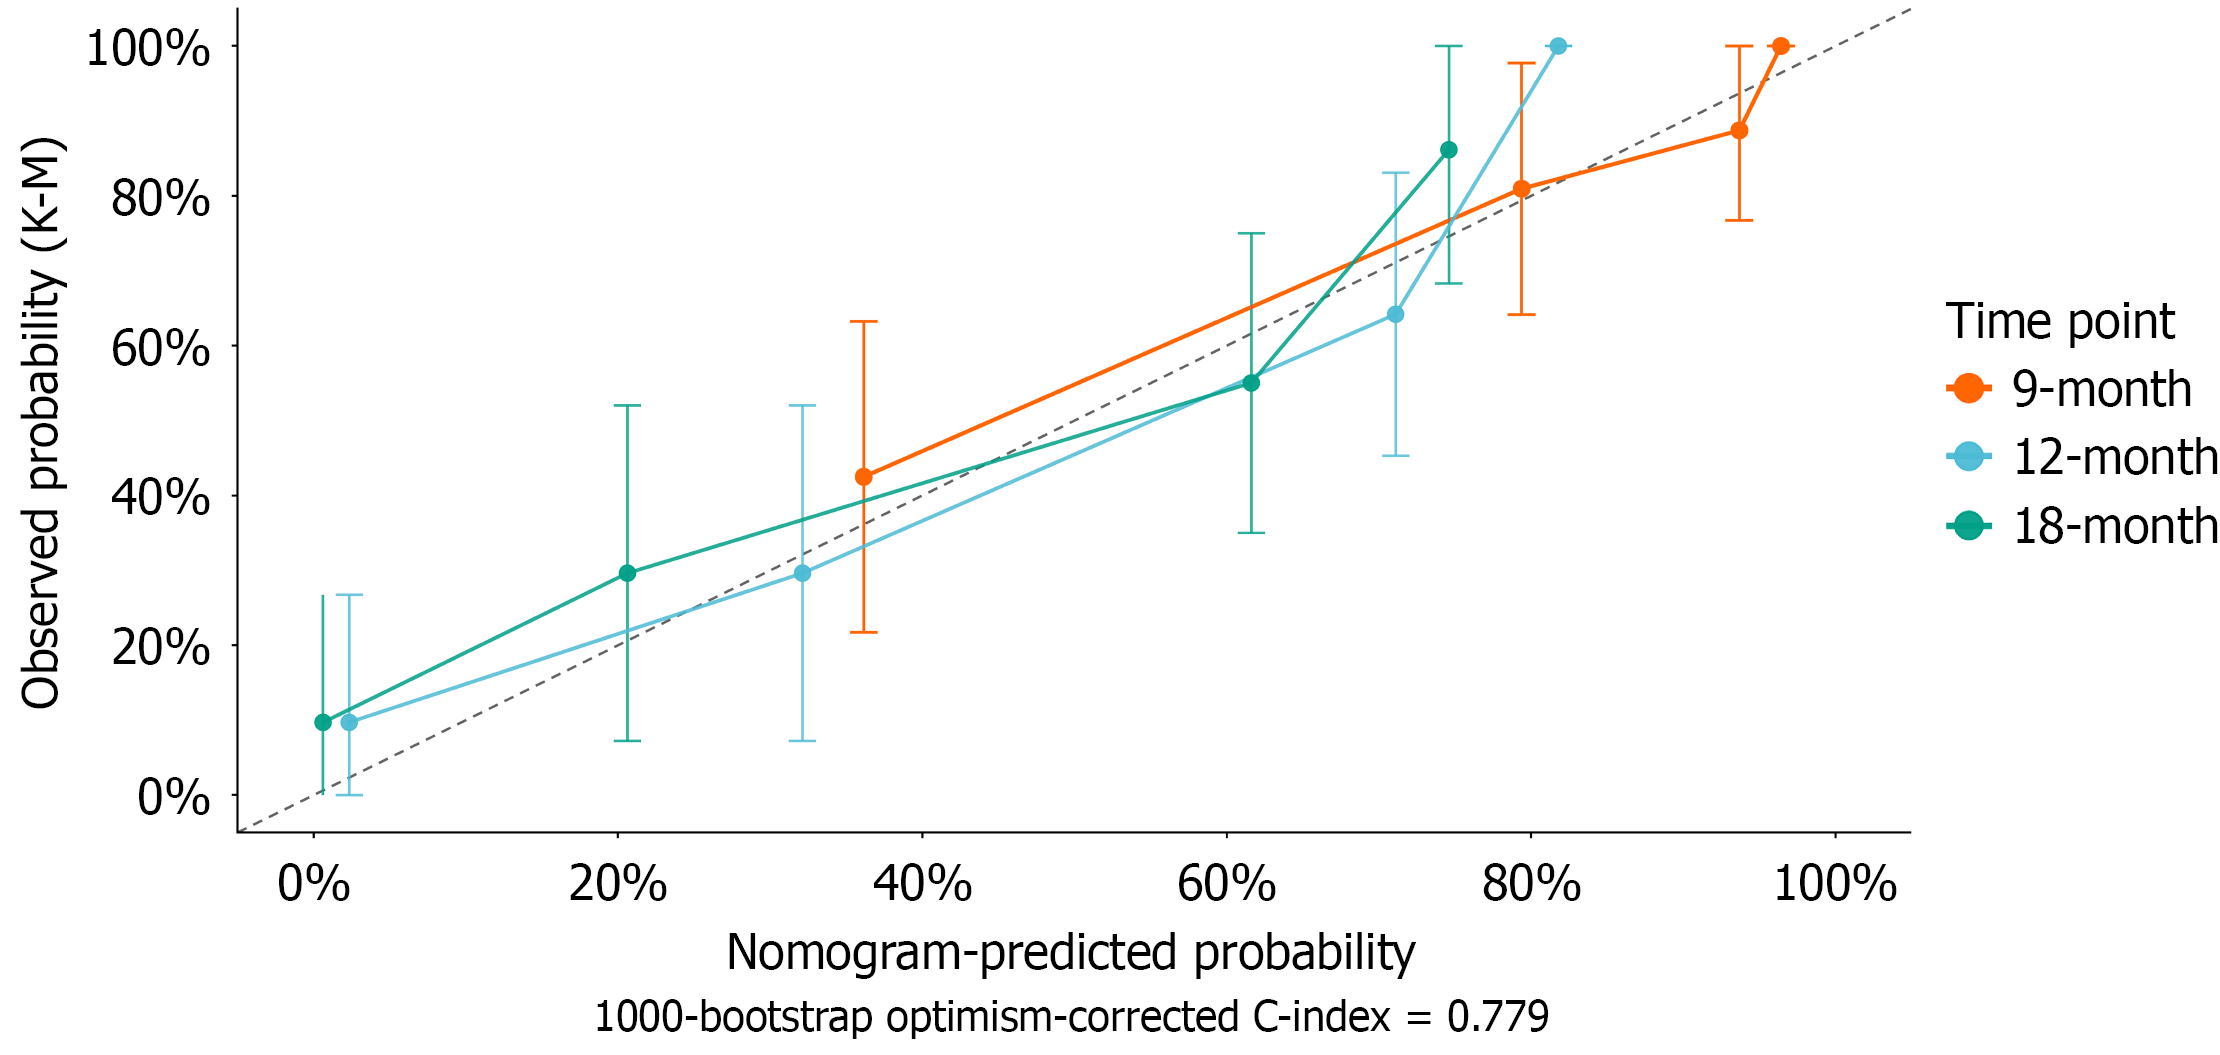
Figure 7 Calibration curves for the overall survival nomogram at 9-, 12-, and 18-month.
Patients were stratified into quartiles according to nomogram-predicted survival probability. Points represent the mean predicted probability vs Kaplan-Meier-observed survival for each quartile; error bars indicate 95% confidence intervals. The dashed diagonal represents perfect calibration. Original concordance index (C-index) = 0.792; 1000-bootstrap optimism-corrected C-index = 0.779 (optimism = 0.026). K-M: Kaplan-Meier; C-index: Concordance index.
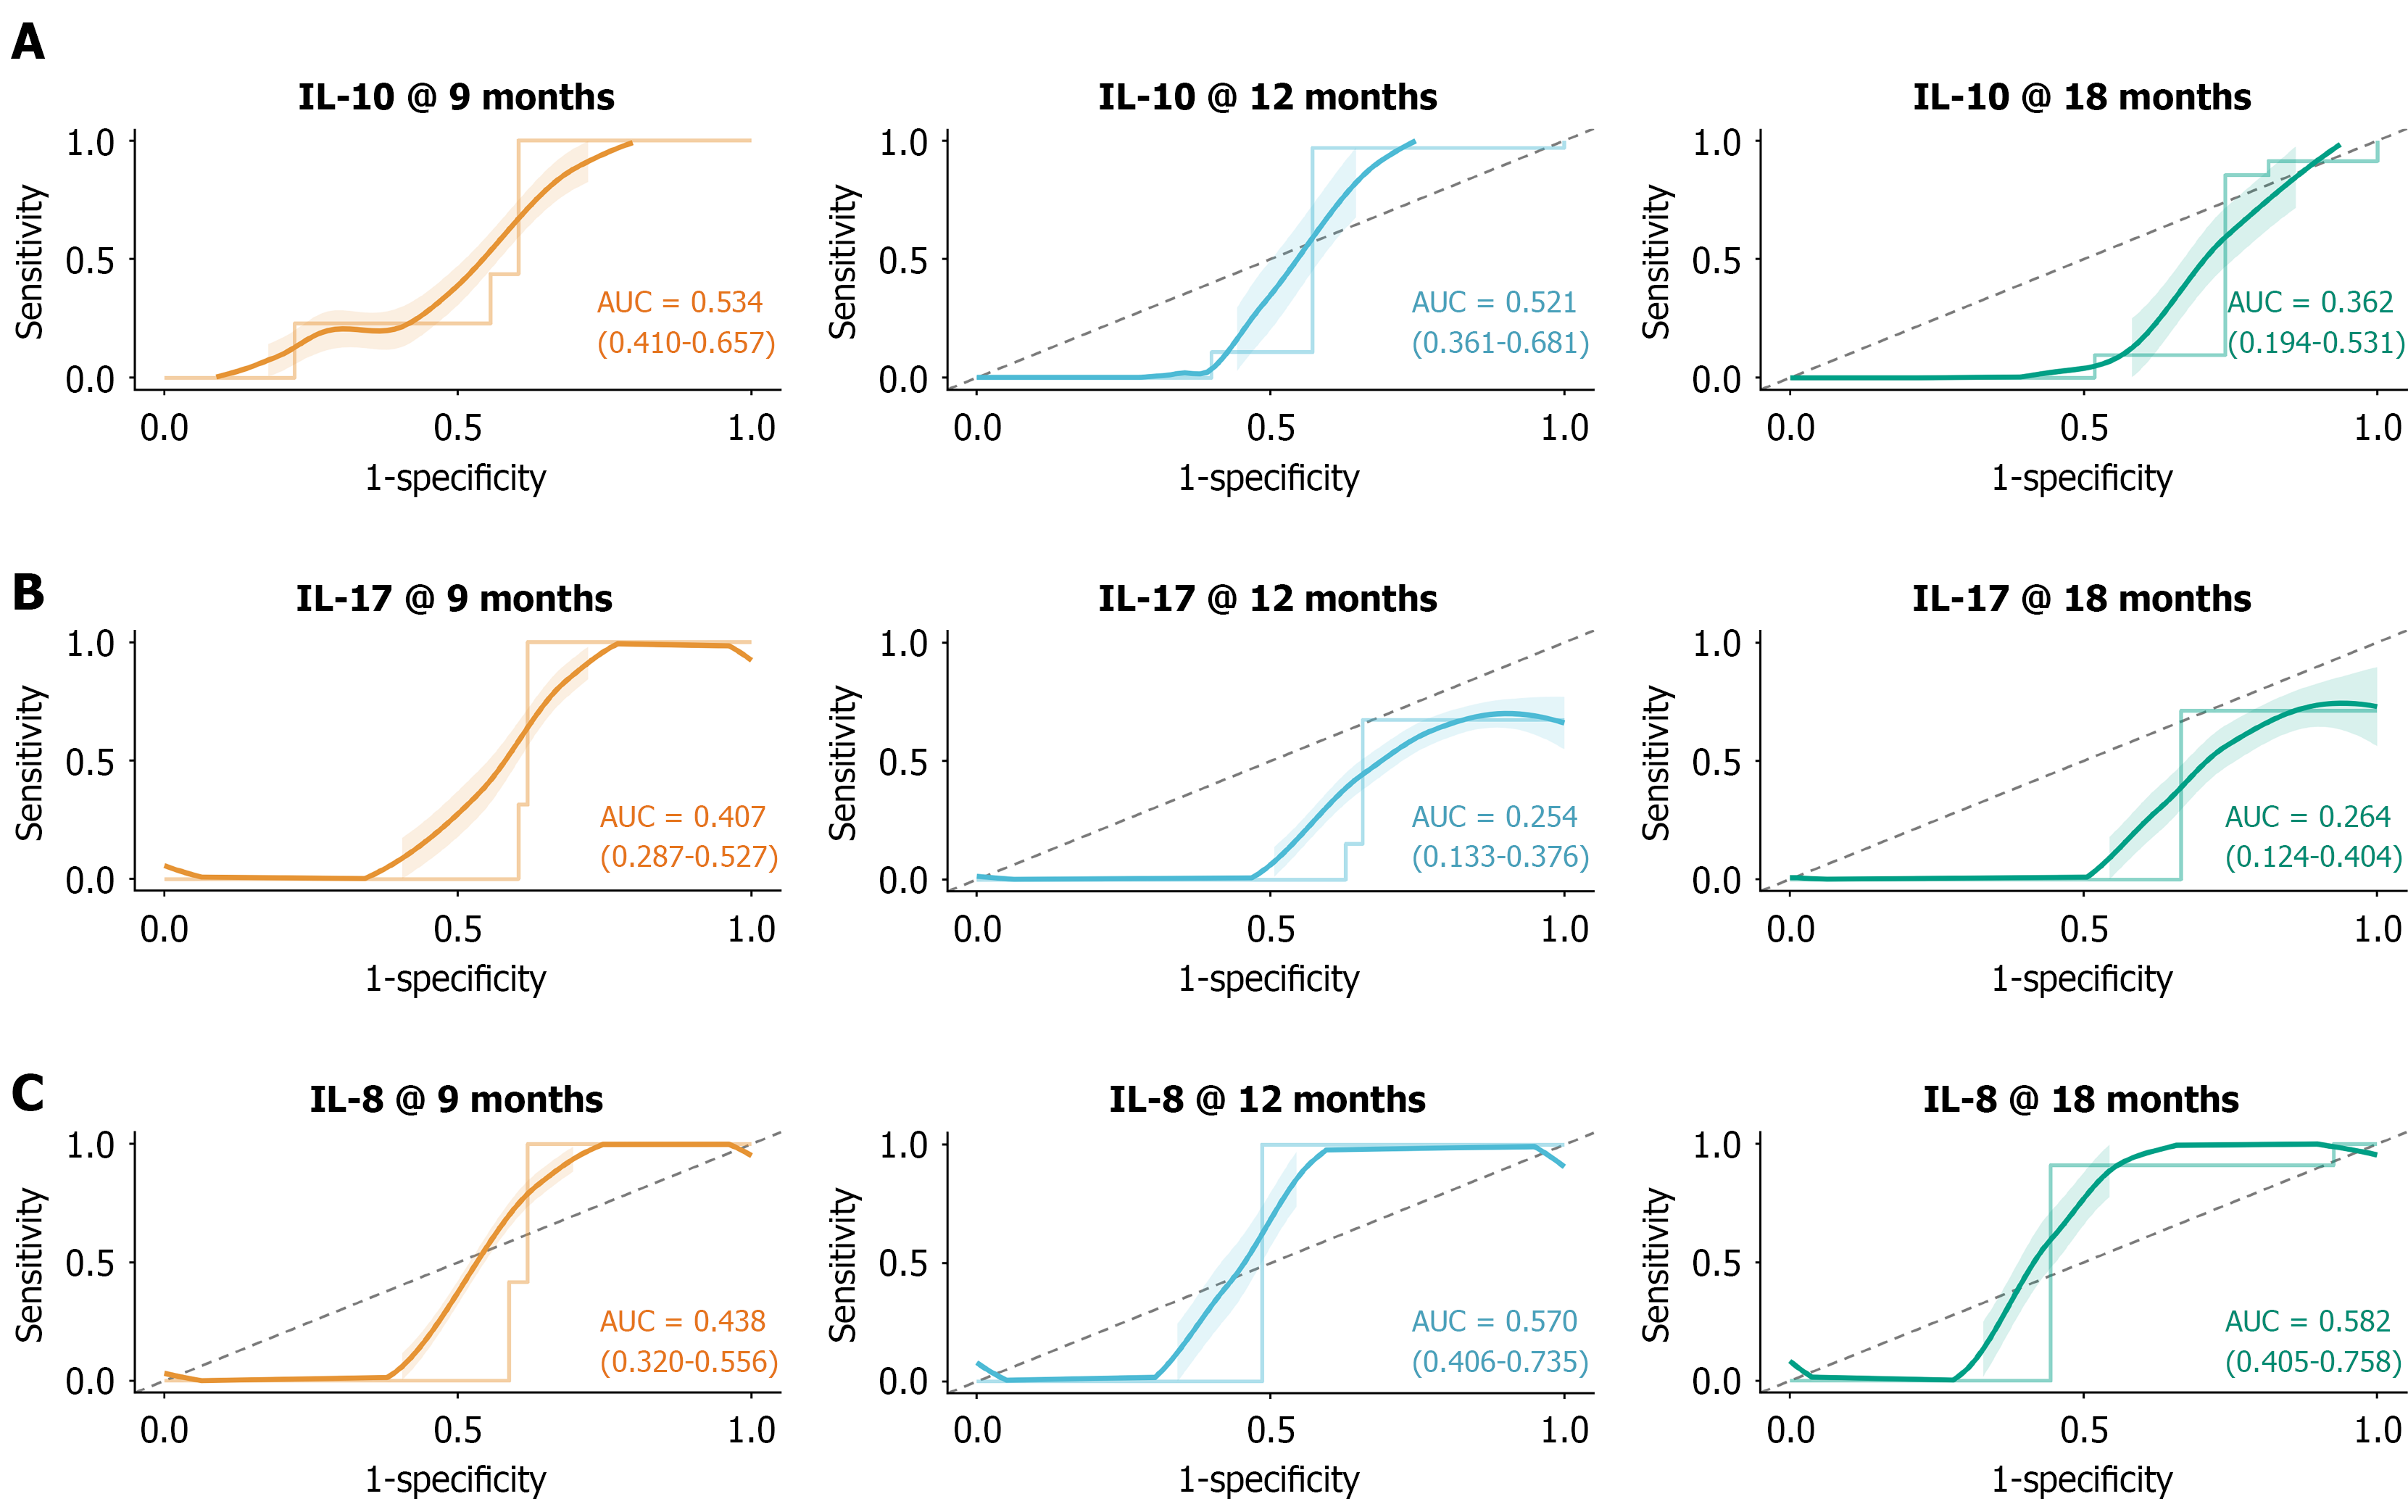
Figure 8 Time-dependent receiver operating characteristic curves for continuous cytokine markers predicting overall survival at 9-, 12-, and 18-month.
A-C: Interleukin (IL)-10 (A), IL-17 (B), and IL-8 (C) are shown. Area under the curve (AUC) values with 95% confidence intervals were estimated using the inverse probability of censoring weighting method. The dashed diagonal indicates the random classifier reference line (AUC = 0.50). ROC: Receiver operating characteristic; AUC: Area under the curve; IL: Interleukin.
- Citation: Li YC, Pan D, Liu HN, Pei ZC, Li YQ, Han ZX, Liu WL. Baseline cytokines and programmed death-ligand 1 prognostic value in advanced gastric cancer with sintilimab plus chemotherapy. World J Gastroenterol 2026; 32(40): 120447
- URL: https://www.wjgnet.com/1007-9327/full/v32/i40/120447.htm
- DOI: https://dx.doi.org/10.3748/wjg.120447