
















Copyright: ©Author(s) 2026.
World J Gastroenterol. Oct 28, 2026; 32(40): 120447
Published online Oct 28, 2026. doi: 10.3748/wjg.120447
Published online Oct 28, 2026. doi: 10.3748/wjg.120447
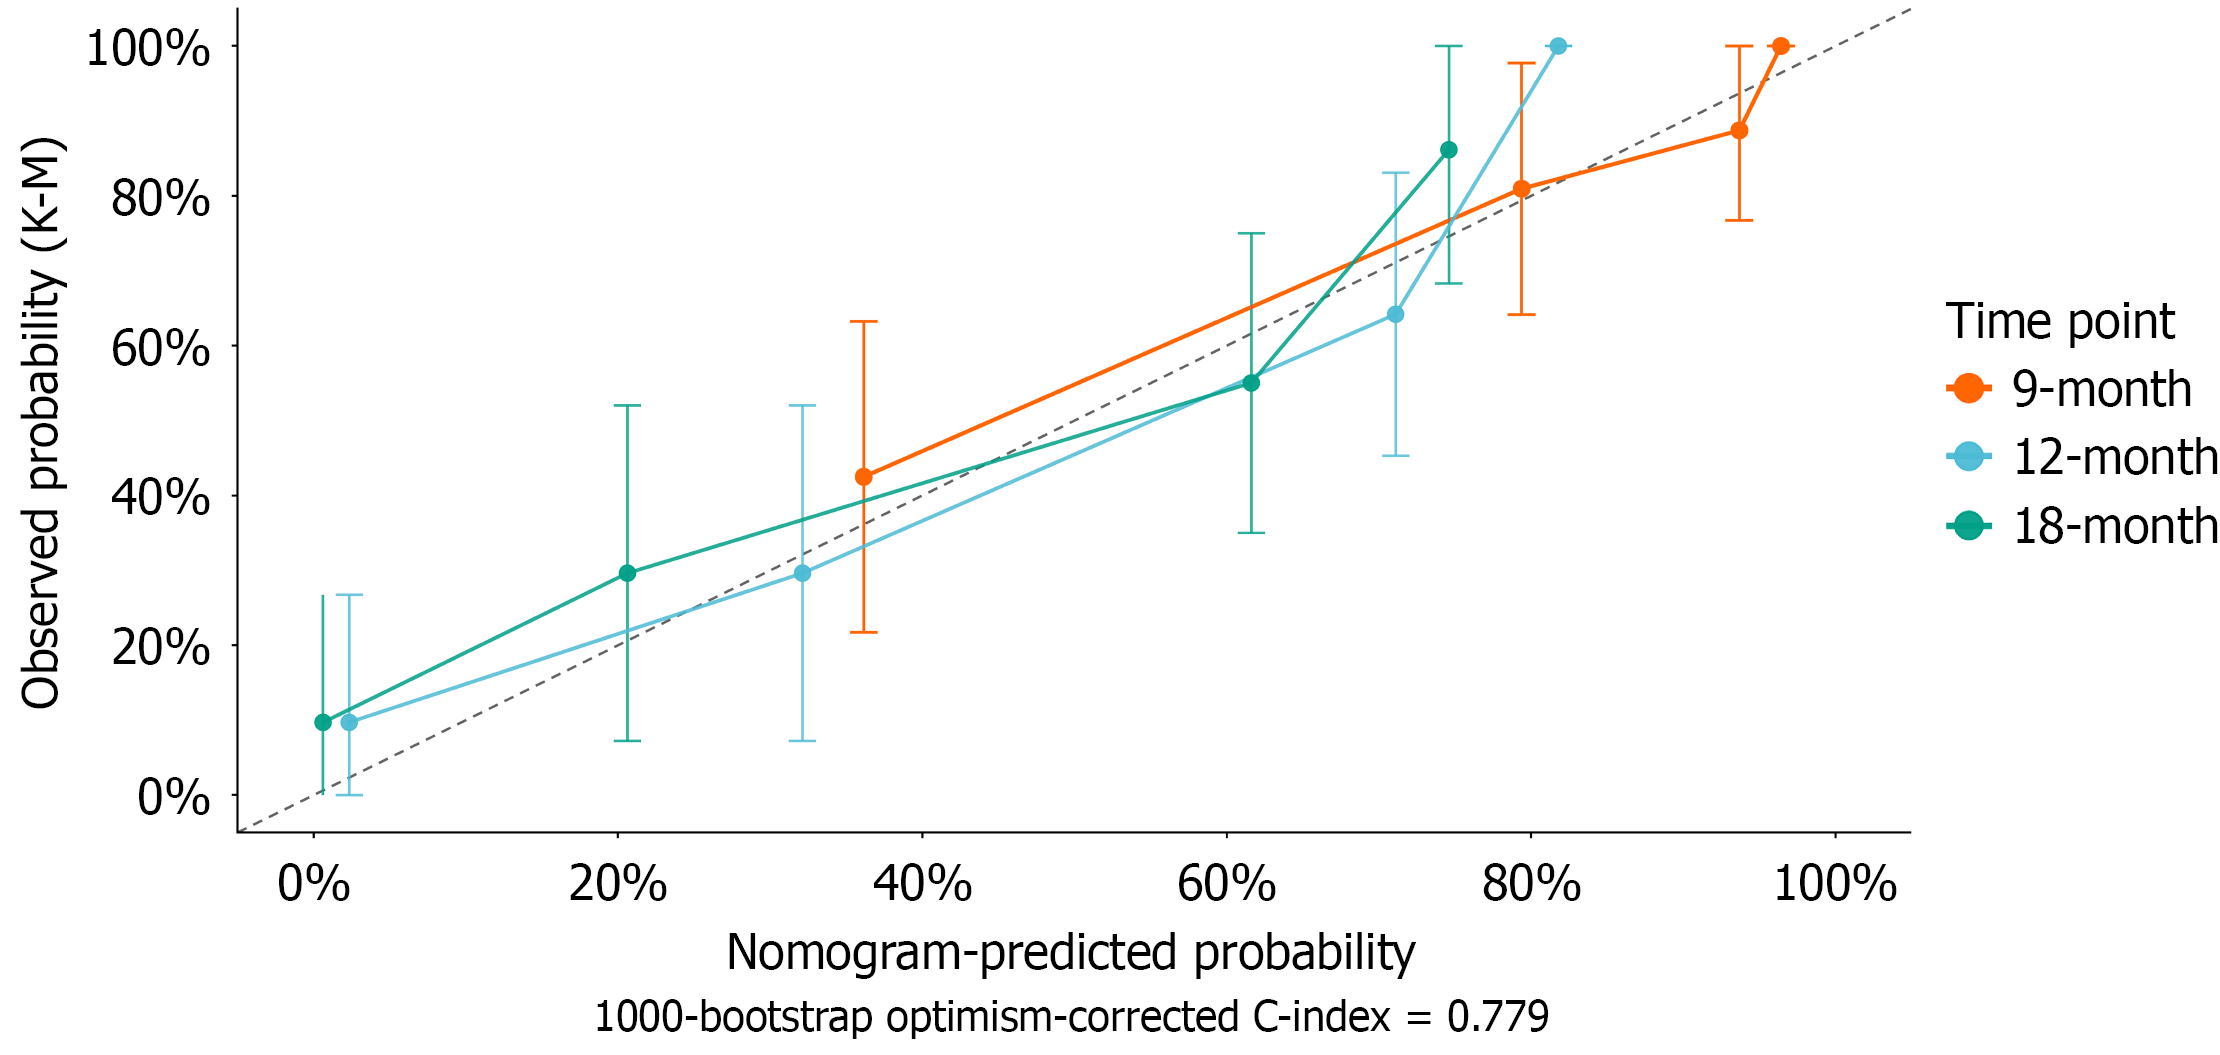
Figure 7 Calibration curves for the overall survival nomogram at 9-, 12-, and 18-month.
Patients were stratified into quartiles according to nomogram-predicted survival probability. Points represent the mean predicted probability vs Kaplan-Meier-observed survival for each quartile; error bars indicate 95% confidence intervals. The dashed diagonal represents perfect calibration. Original concordance index (C-index) = 0.792; 1000-bootstrap optimism-corrected C-index = 0.779 (optimism = 0.026). K-M: Kaplan-Meier; C-index: Concordance index.
- Citation: Li YC, Pan D, Liu HN, Pei ZC, Li YQ, Han ZX, Liu WL. Baseline cytokines and programmed death-ligand 1 prognostic value in advanced gastric cancer with sintilimab plus chemotherapy. World J Gastroenterol 2026; 32(40): 120447
- URL: https://www.wjgnet.com/1007-9327/full/v32/i40/120447.htm
- DOI: https://dx.doi.org/10.3748/wjg.120447