Copyright
©The Author(s) 2025.
World J Gastroenterol. Jun 28, 2025; 31(24): 104437
Published online Jun 28, 2025. doi: 10.3748/wjg.v31.i24.104437
Published online Jun 28, 2025. doi: 10.3748/wjg.v31.i24.104437
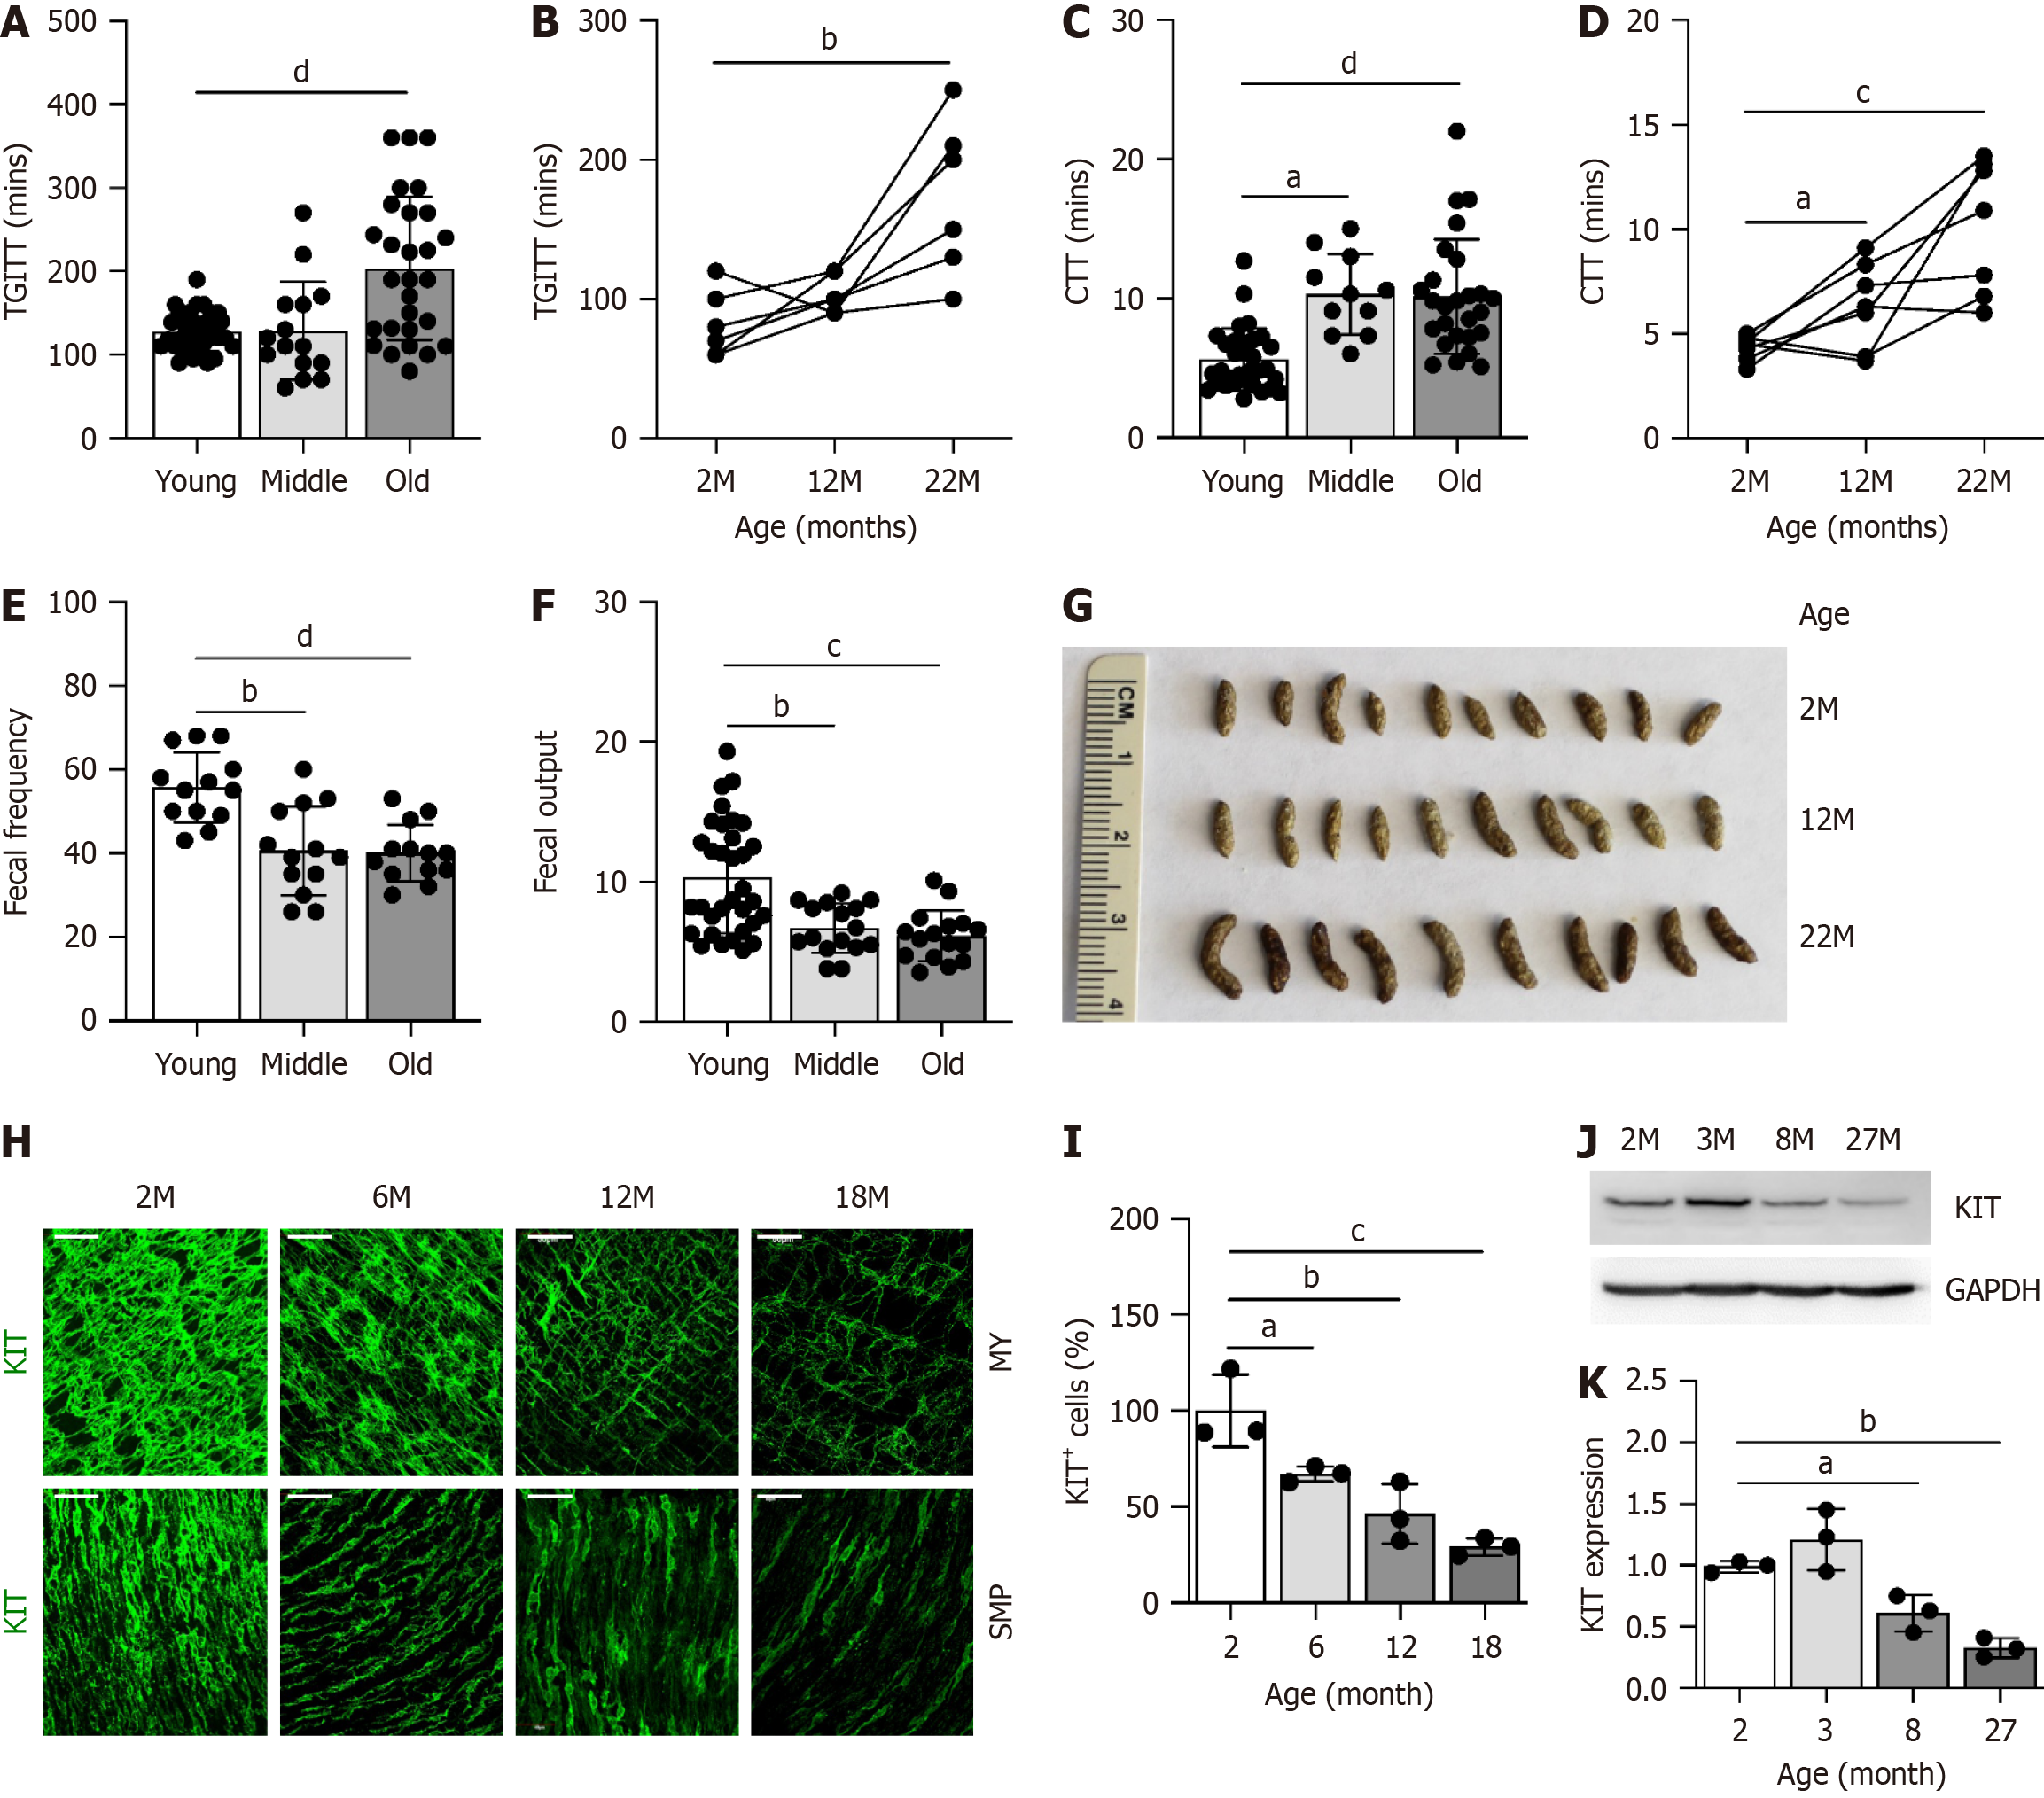
Figure 1 Aged mice develop gastrointestinal dysmotility with a progressive reduction in interstitial cells of Cajal.
A: Total gastrointestinal transit time (TGITT) in young (2-6 months), middle age (8-14 months), and old (18-30 months) C57BL/6J mice. n ≥ 16 per group; B: Changes in TGITT in individual mice at 2, 12, and 22 months. n = 6; C: Colonic transit time (CTT) in young, middle age, and old mice, n ≥ 11 per group; D: Changes in CTT in individual mice at 2, 12, and 22 months. n = 6; E: Fecal frequency. n = 13; F: Fecal pellet output. n = 18; G: Fecal pellets collected; H: Whole-mount confocal images of interstitial cells of Cajal (ICC) in submucosal plexus (SMP) and myenteric plexus layer (MY) ICC in colonic smooth muscle detected by KIT antibody (green) in mice at 2, 6, 12, and 18 months. Scale bars were 50 μm; I: Quantification of KIT+ cells in panel H, presented as a percentage of the total across both MY and SMP layers. n = 3; J and K: Western blot and quantification of KIT in the proximal colonic smooth muscle in mice at 2, 3, 8 and 27 months. n = 3. aP < 0.05; bP < 0.01; cP < 0.001; dP < 0.0001; TGITT: Total gastrointestinal transit time; CTT: Colonic transit time; MY: Myenteric plexus; SMP: Submucosal plexus.
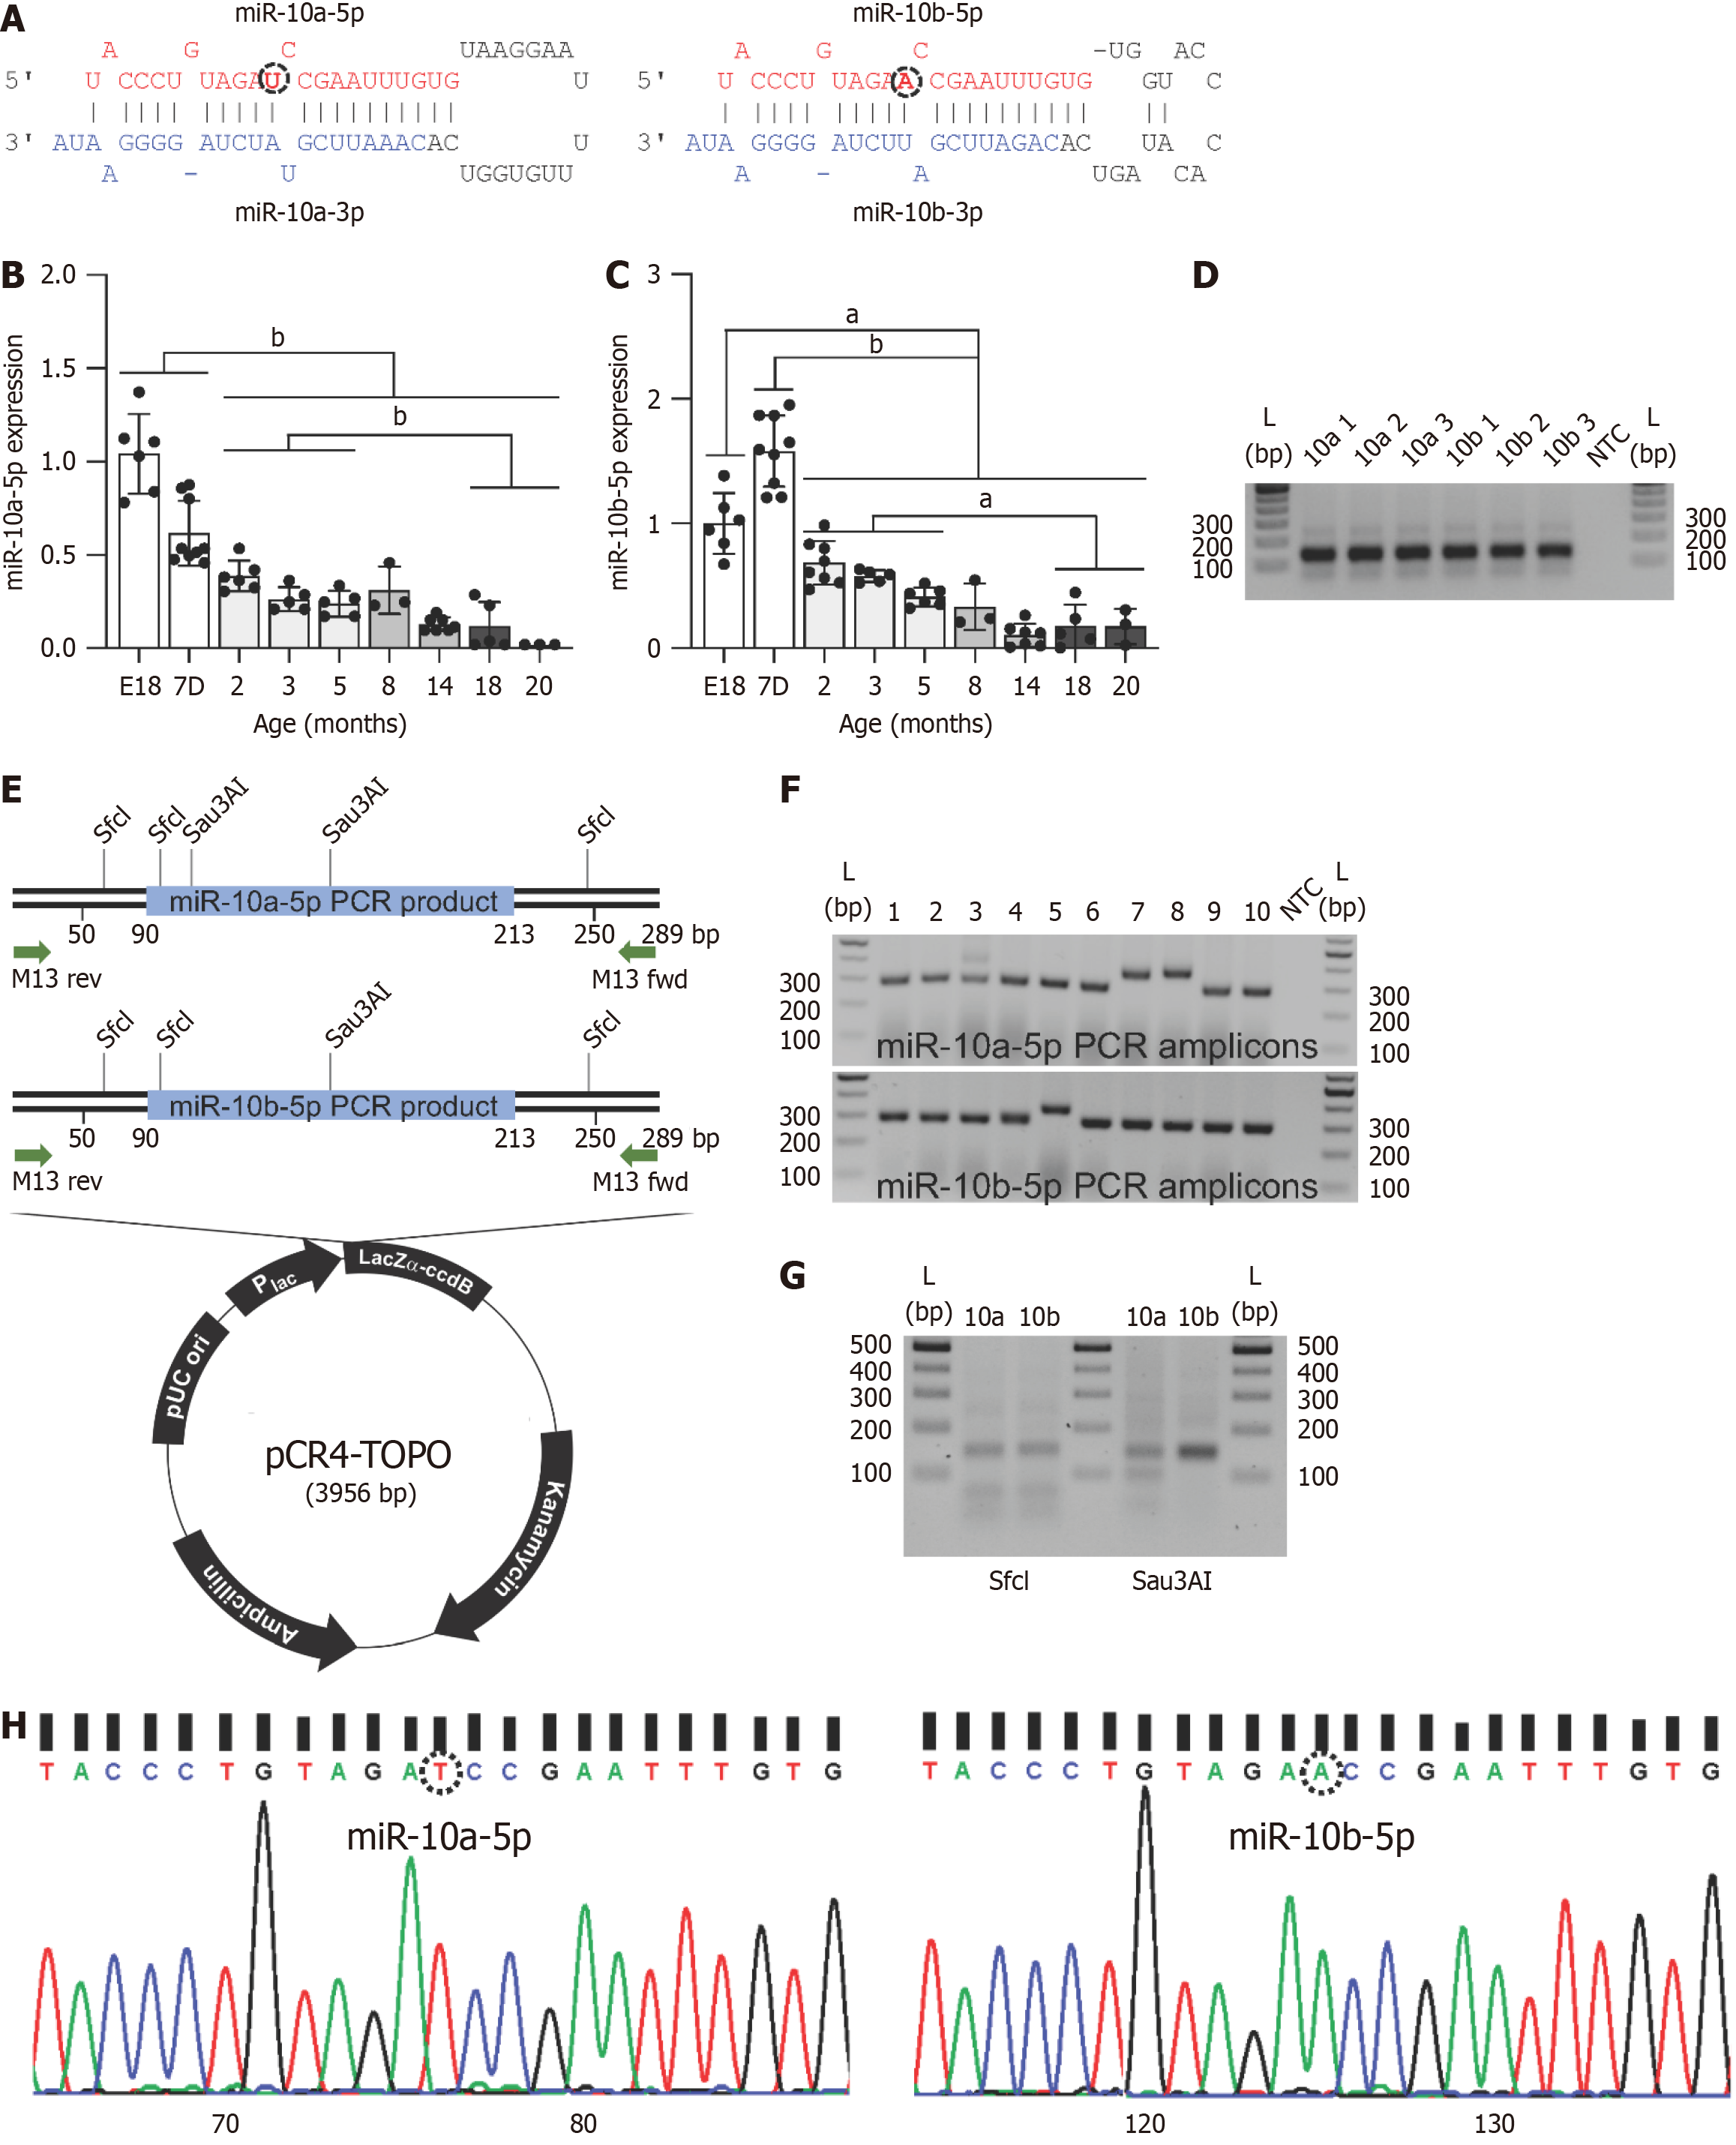
Figure 2 Expression of miR-10a-5p and miR-10b-5p decreases with age.
A: RNA sequence and structure of mouse miR-10a and 10b precursors encoding homologous miR-10a-5p and miR-10b-5p. One nucleotide, U or A differing between miR-10a-5p and miR-10b-5p, is circled; B and C: Expression of miR-10a-5p and miR-10b-5p in the whole gastrointestinal tissue at embryonic stage 18 (E18) and the whole blood from 7 days (7D) to 20 months across different age groups of C57BL/6J mice, measured by qPCR. Data were presented as mean ± SD. n ≥ 3 per group. aP < 0.05; bP < 0.01; D: QPCR amplicons of miR-10a-5p and miR-10b-5p electrophoresed on a 2% agarose gel. NTC stands for a non-template control. A DNA ladder was loaded on each side the gel; E: Construction of a TOPO®TA based expression vector cloned with miR-10a-5p or miR-10b-5p PCR products. A primer set, M13 forward and reverse primers, used to amplify PCR products (289 bp) is shown. Restriction enzyme sites for SfcI and Sau3AI are indicated; F: Colony PCR products electrophoresed on 2% agarose gels; G: PCR-amplified products digested with Sfcl and Sau3AI electrophoresed on a 1% agarose gel; H: MiR-10a-5p and miR-10b-5p sequencing chromatograms. One nucleotide, T or A differing between miR-10a-5p and miR-10b-5p, is circled.
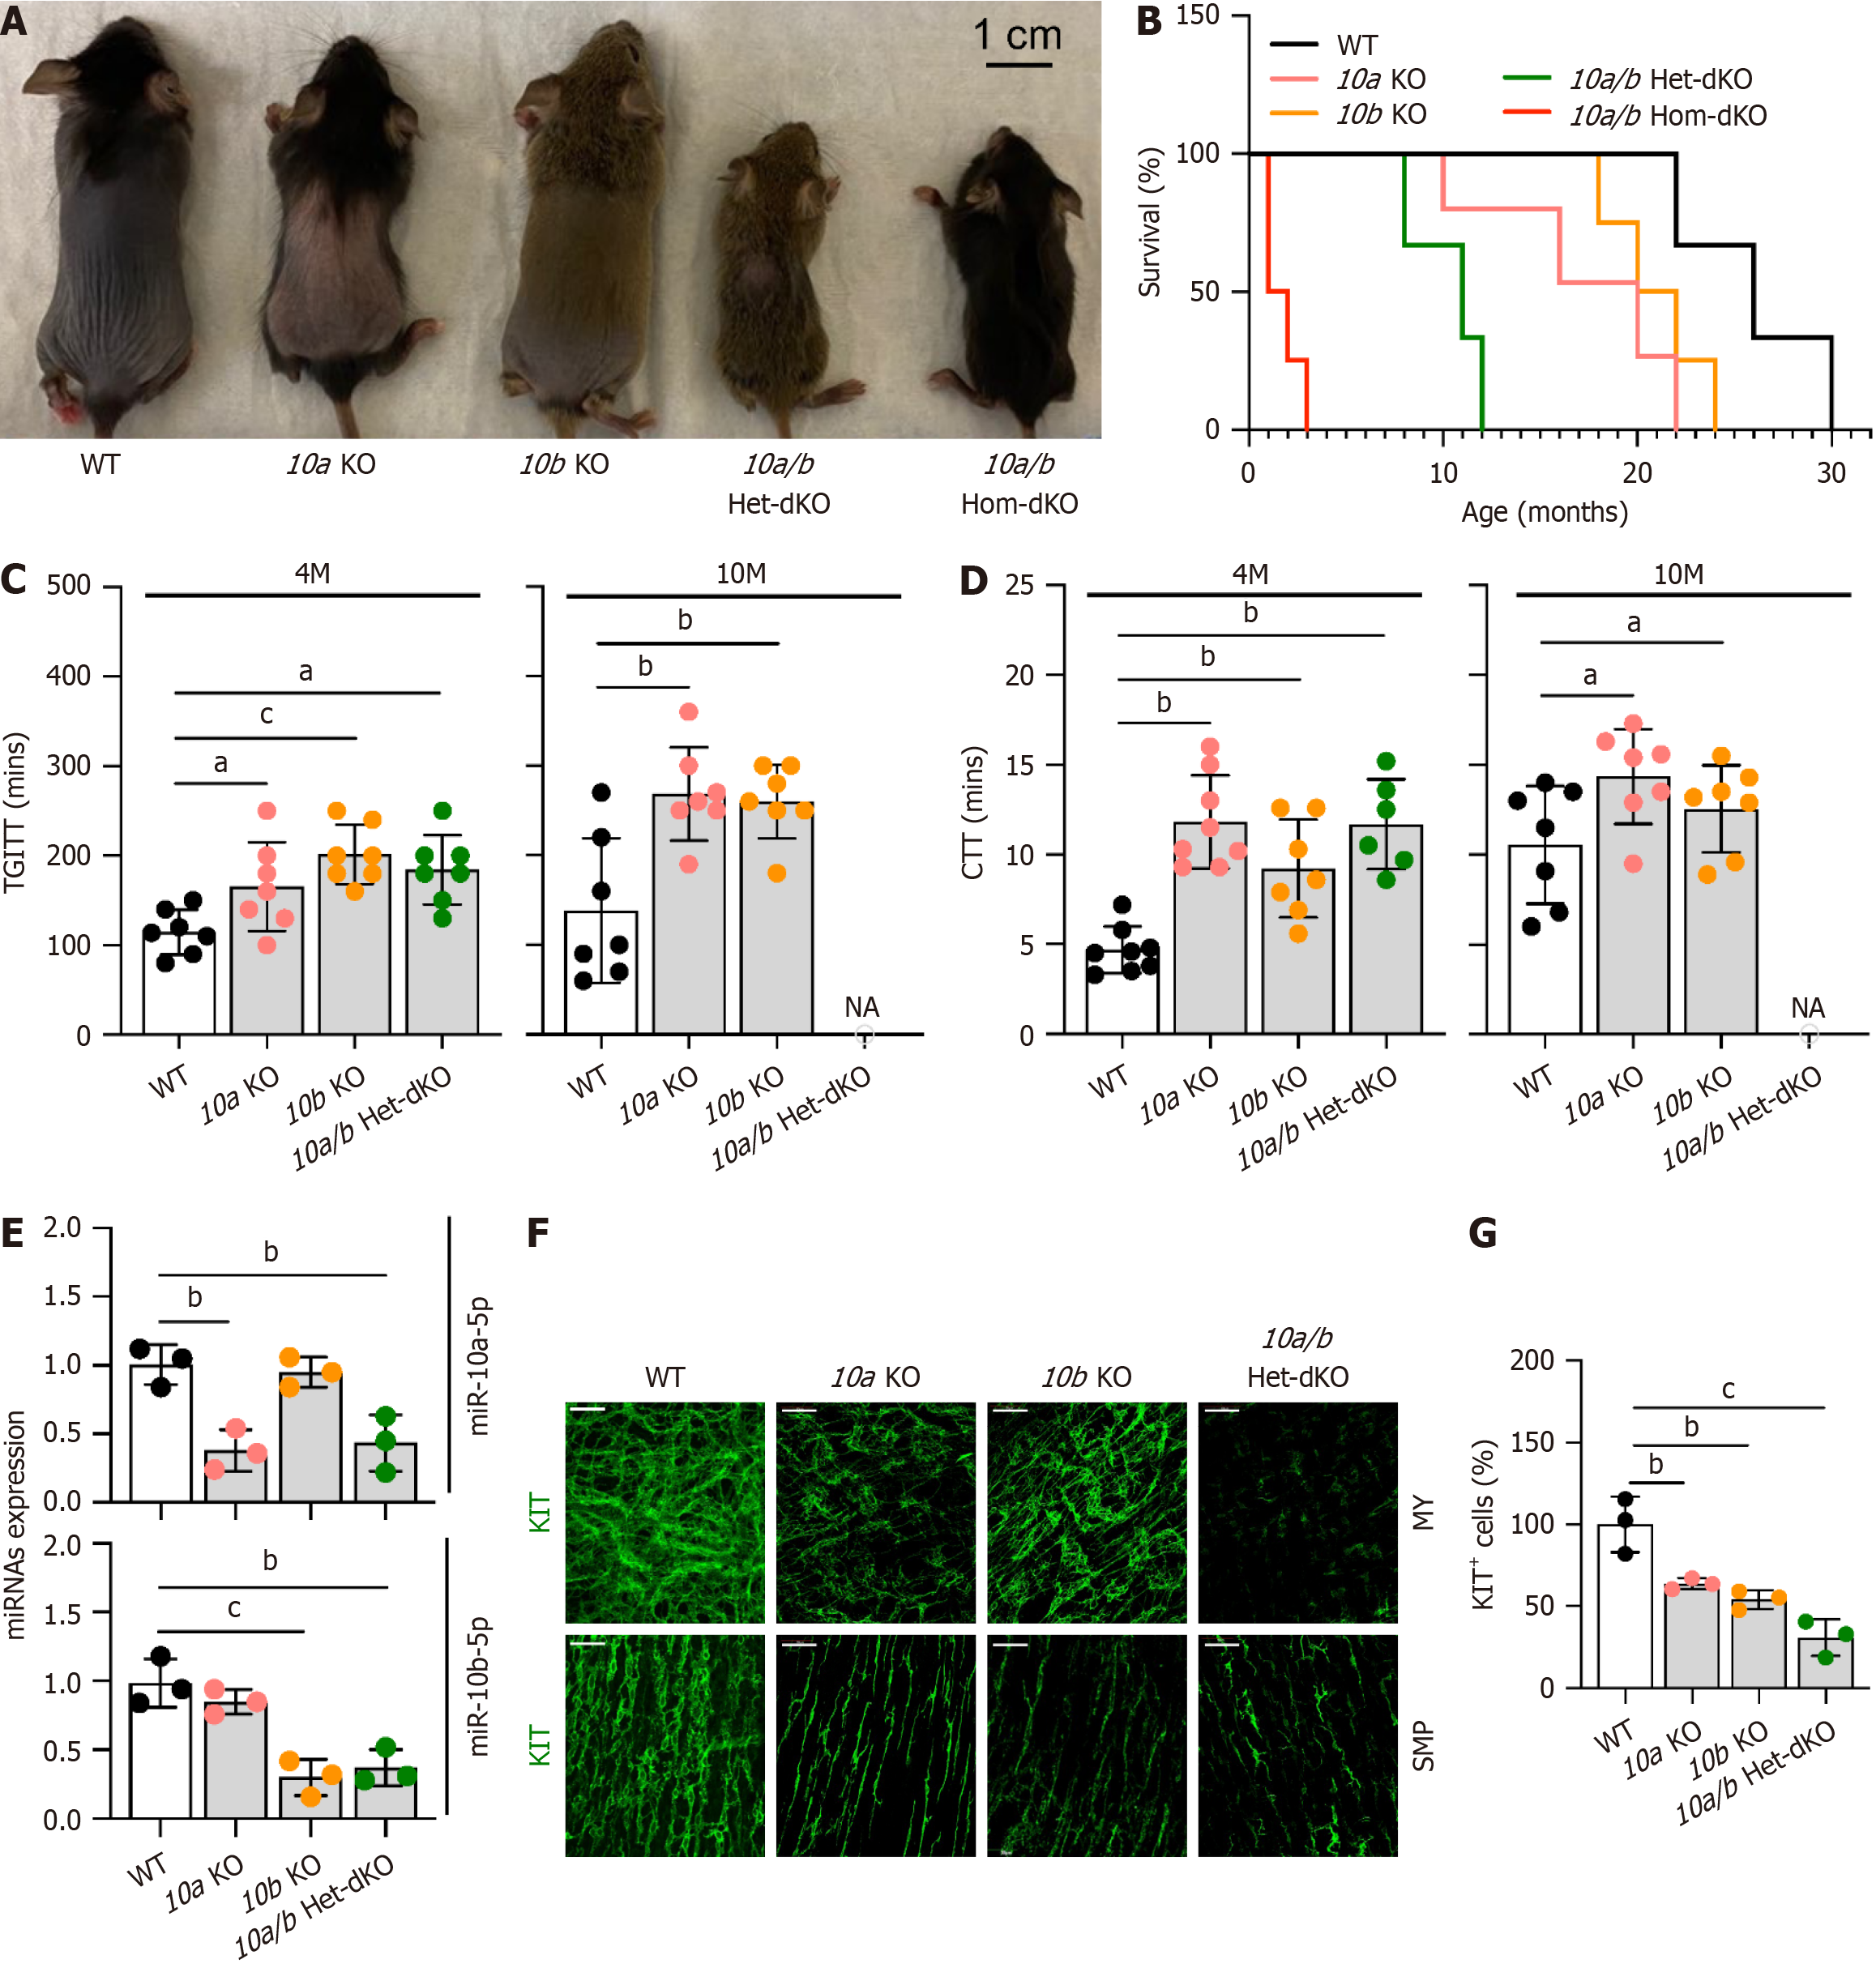
Figure 3 mir-10a and/or mir-10b knockout mice develop gastrointestinal dysmotility with a substantial reduction in interstitial cells of Cajal.
A: Gross image in mir-10a knockout (KO), mir-10b KO and mir-10ab double heterozygous knockout (Het-dKO) and homozygous (Hom-dKO) mice; B: Survival percentages of mir-10a KO, mir-10b KO, mir-10ab Het-dKO, and mir-10ab Hom-dKO mice (n = 7-10, mir-10a, mir-10b KO, and wild-type (WT); n = 5, mir-10ab Het-dKO; n = 4, mir-10ab Hom-dKO); C and D: Total gastrointestinal transit time and Colonic transit time at 4-month and 10-month-old age in WT, mir-10a KO, mir-10b KO, and mir-10ab Het-dKO mice. n = 6-8 per group; E: Expression levels of miR-10a-5p and miR-10b-5p in the proximal colonic smooth muscle in WT, mir-10a KO, mir-10b KO, and mir-10ab Het-dKO mice, as measured by qPCR. n = 3 each group; F: Whole-mount confocal images of interstitial cells of Cajal (ICC) (KIT+) cells in submucosal plexus (SMP) and myenteric plexus layer (MY) ICC in proximal colonic smooth muscle in WT, mir-10a KO, mir-10b KO, and mir-10ab Het-dKO mice. Scale bars were 50 μm; G: Quantification of KIT+ cells in panel F, presented as a percentage of the total across both MY and SMP layers. n = 3 per group. Error bars indicate SEM, 1-way ANOVA. aP < 0.05; bP < 0.01 and cP < 0.001; TGITT: Total gastrointestinal transit time; WT: Wild-type; KO: Knockout; CTT: Colonic transit time; NA: Not available; MY: Myenteric plexus; SMP: Submucosal plexus.
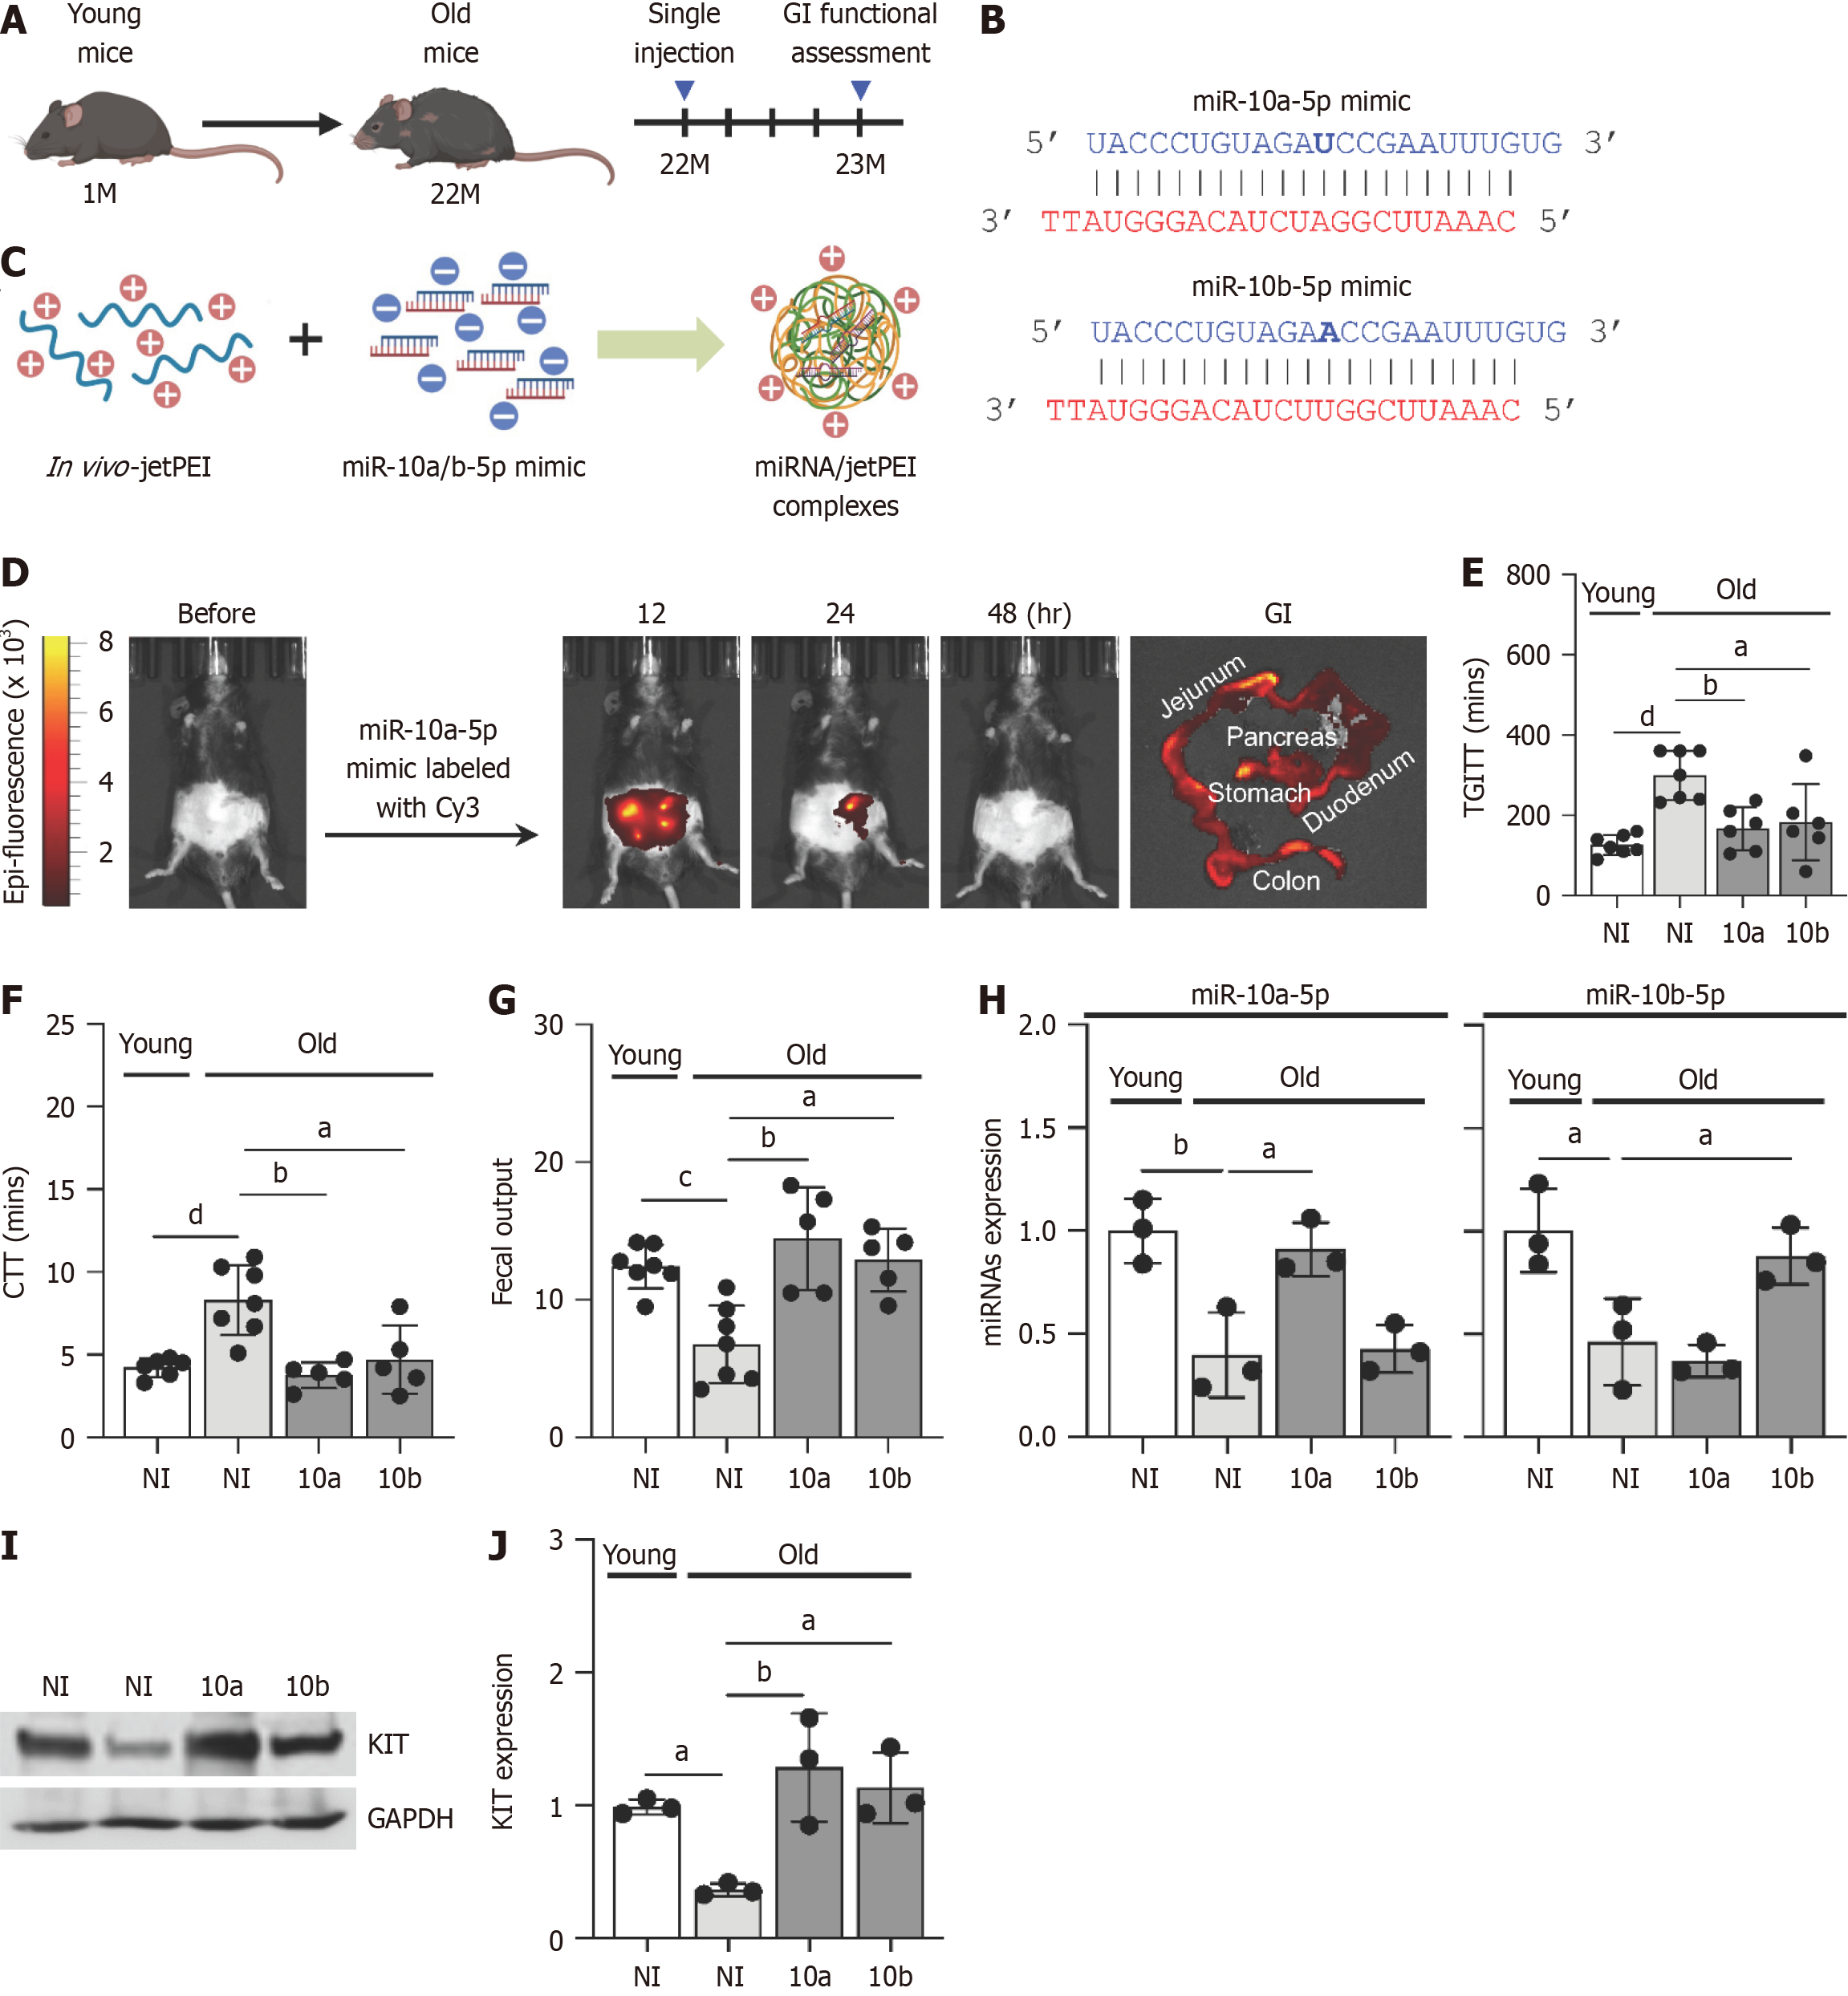
Figure 4 miR-10a-5p mimic and miR-10b-5p mimic rescue gastrointestinal dysmotility in aged mice.
A: Experimental design illustrating the intraperitoneal administration of miR-10a-5p or miR-10b-5p mimics in 22-month-old (aged) mice. Mice received a single intraperitoneal injection of either miR-10a-5p or miR-10b-5p mimics at a dosage of 500 ng/g body weight. Subsequent gastrointestinal (GI) functional assessments were conducted at 4 weeks post-injection; B: Duplex sequence and structure of the miR-10a-5p mimic or miR-10b-5p mimic; C: Complex formation of miR-10a-5p or miR-10b-5p mimic duplexes with in vivo-jet PEI; D: Verification of in vivo delivery of in vivo-jet PEI/miR-10a-5p mimic-Cy3 complexes in 8-months old mice. Cy3 fluorescence in the GI tract was assessed at 12-, 24-, and 48-hours post-injections, as well as pre-injection; E and F: Total gastrointestinal transit time and colonic transit time measurements in aged (22 months old) mice injected with the miR-10a-5p mimic (10a), miR-10b-5p mimic (10b), or left untreated [no injection (NI)], compared with young control (2-4 months old) mice. G: Fecal output in aged mice injected with the 10a or 10b mimic, or untreated (NI), compared with young controls. n = 5-6 per group; H-J: Expression levels of miR-10a-5p and miR-10b-5p and KIT in colonic muscle in aged mice injected with the miR-10a-5p mimic (10a), miR-10b-5p mimic (10b), or left untreated (no injection, NI), compared with young control mice (2-4 months old, n = 3). Error bars indicate SEM, 1-way ANOVA. aP < 0.05; bP < 0.01; cP < 0.001; dP < 0.0001; TGITT: Total gastrointestinal transit time; CTT: Colonic transit time.
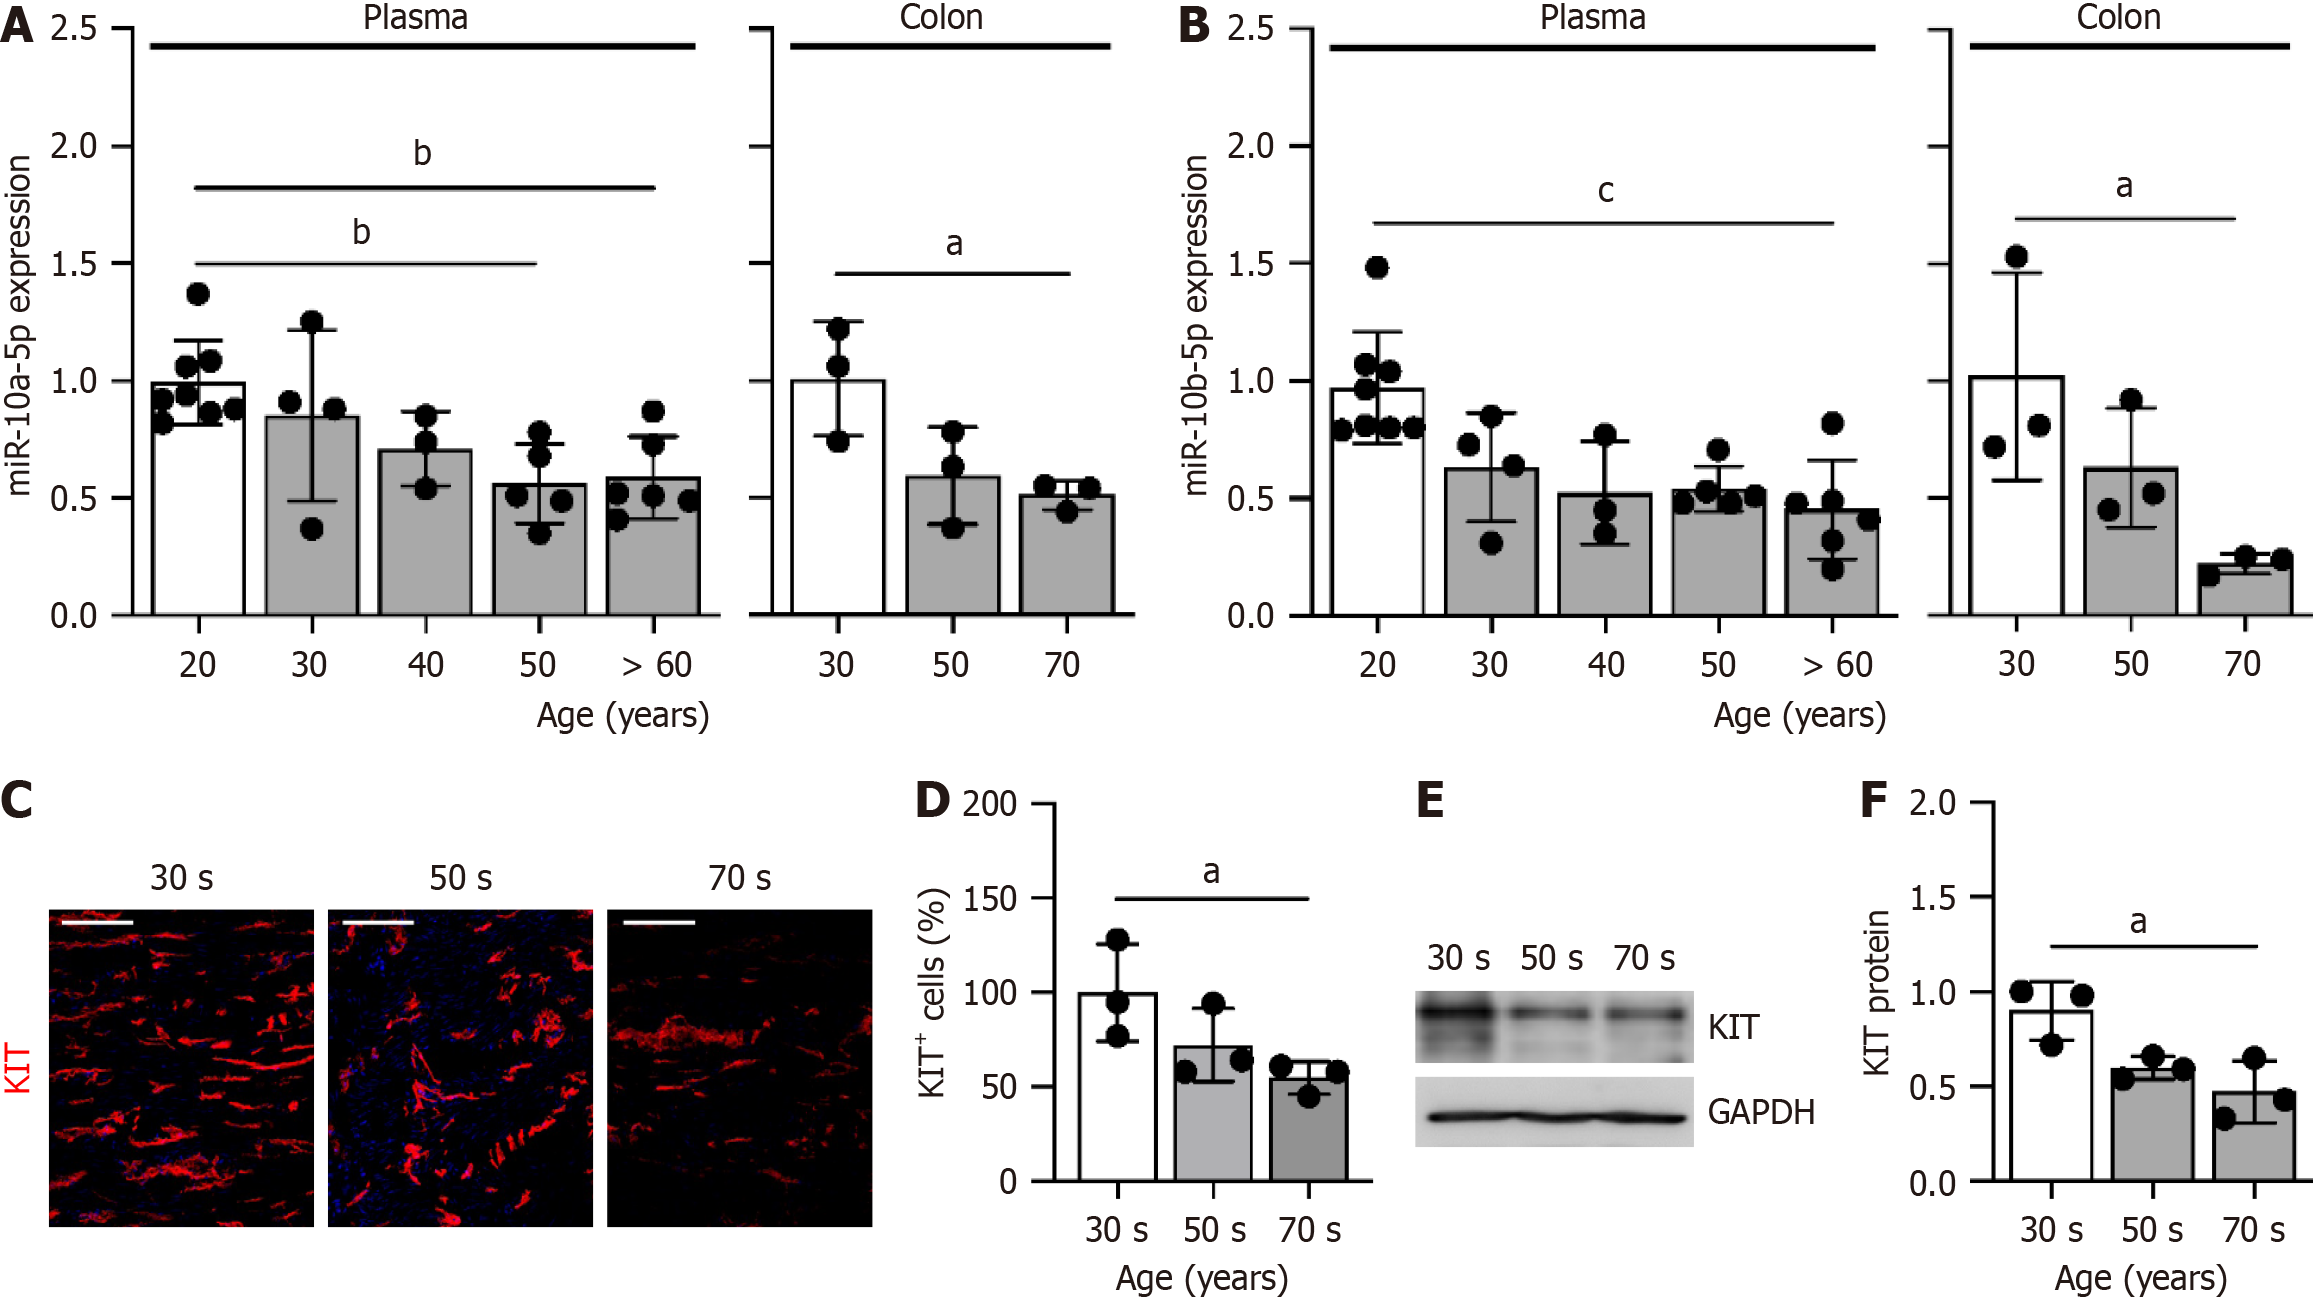
Figure 5 Validation of altered expression of miR-10a-5p and miR-10b-5p, and KIT in aged patients.
A and B: Expression of miR-10a-5p and miR-10b-5p in plasma and colonic tissue samples across different aged groups. (n = 3-8); C: KIT antibody staining in colonic tissue from different aged groups; D: Quantification of KIT+ cells in panel C; E and F: Western blot and quantification of KIT in the colonic tissue from different aged groups. n = 3. Error bars indicate SEM, 1-way ANOVA. aP < 0.05; bP < 0.01; cP < 0.001.
- Citation: Baek G, Singh R, Ha SE, Cho H, Padmanabhan S, Vishwanath V, Kim MS, Seon D, You J, Lee MY, Ro S. miR-10a-5p and miR-10b-5p restore colonic motility in aged mice. World J Gastroenterol 2025; 31(24): 104437
- URL: https://www.wjgnet.com/1007-9327/full/v31/i24/104437.htm
- DOI: https://dx.doi.org/10.3748/wjg.v31.i24.104437


