Copyright
©The Author(s) 2025.
World J Gastroenterol. Jun 28, 2025; 31(24): 104437
Published online Jun 28, 2025. doi: 10.3748/wjg.v31.i24.104437
Published online Jun 28, 2025. doi: 10.3748/wjg.v31.i24.104437
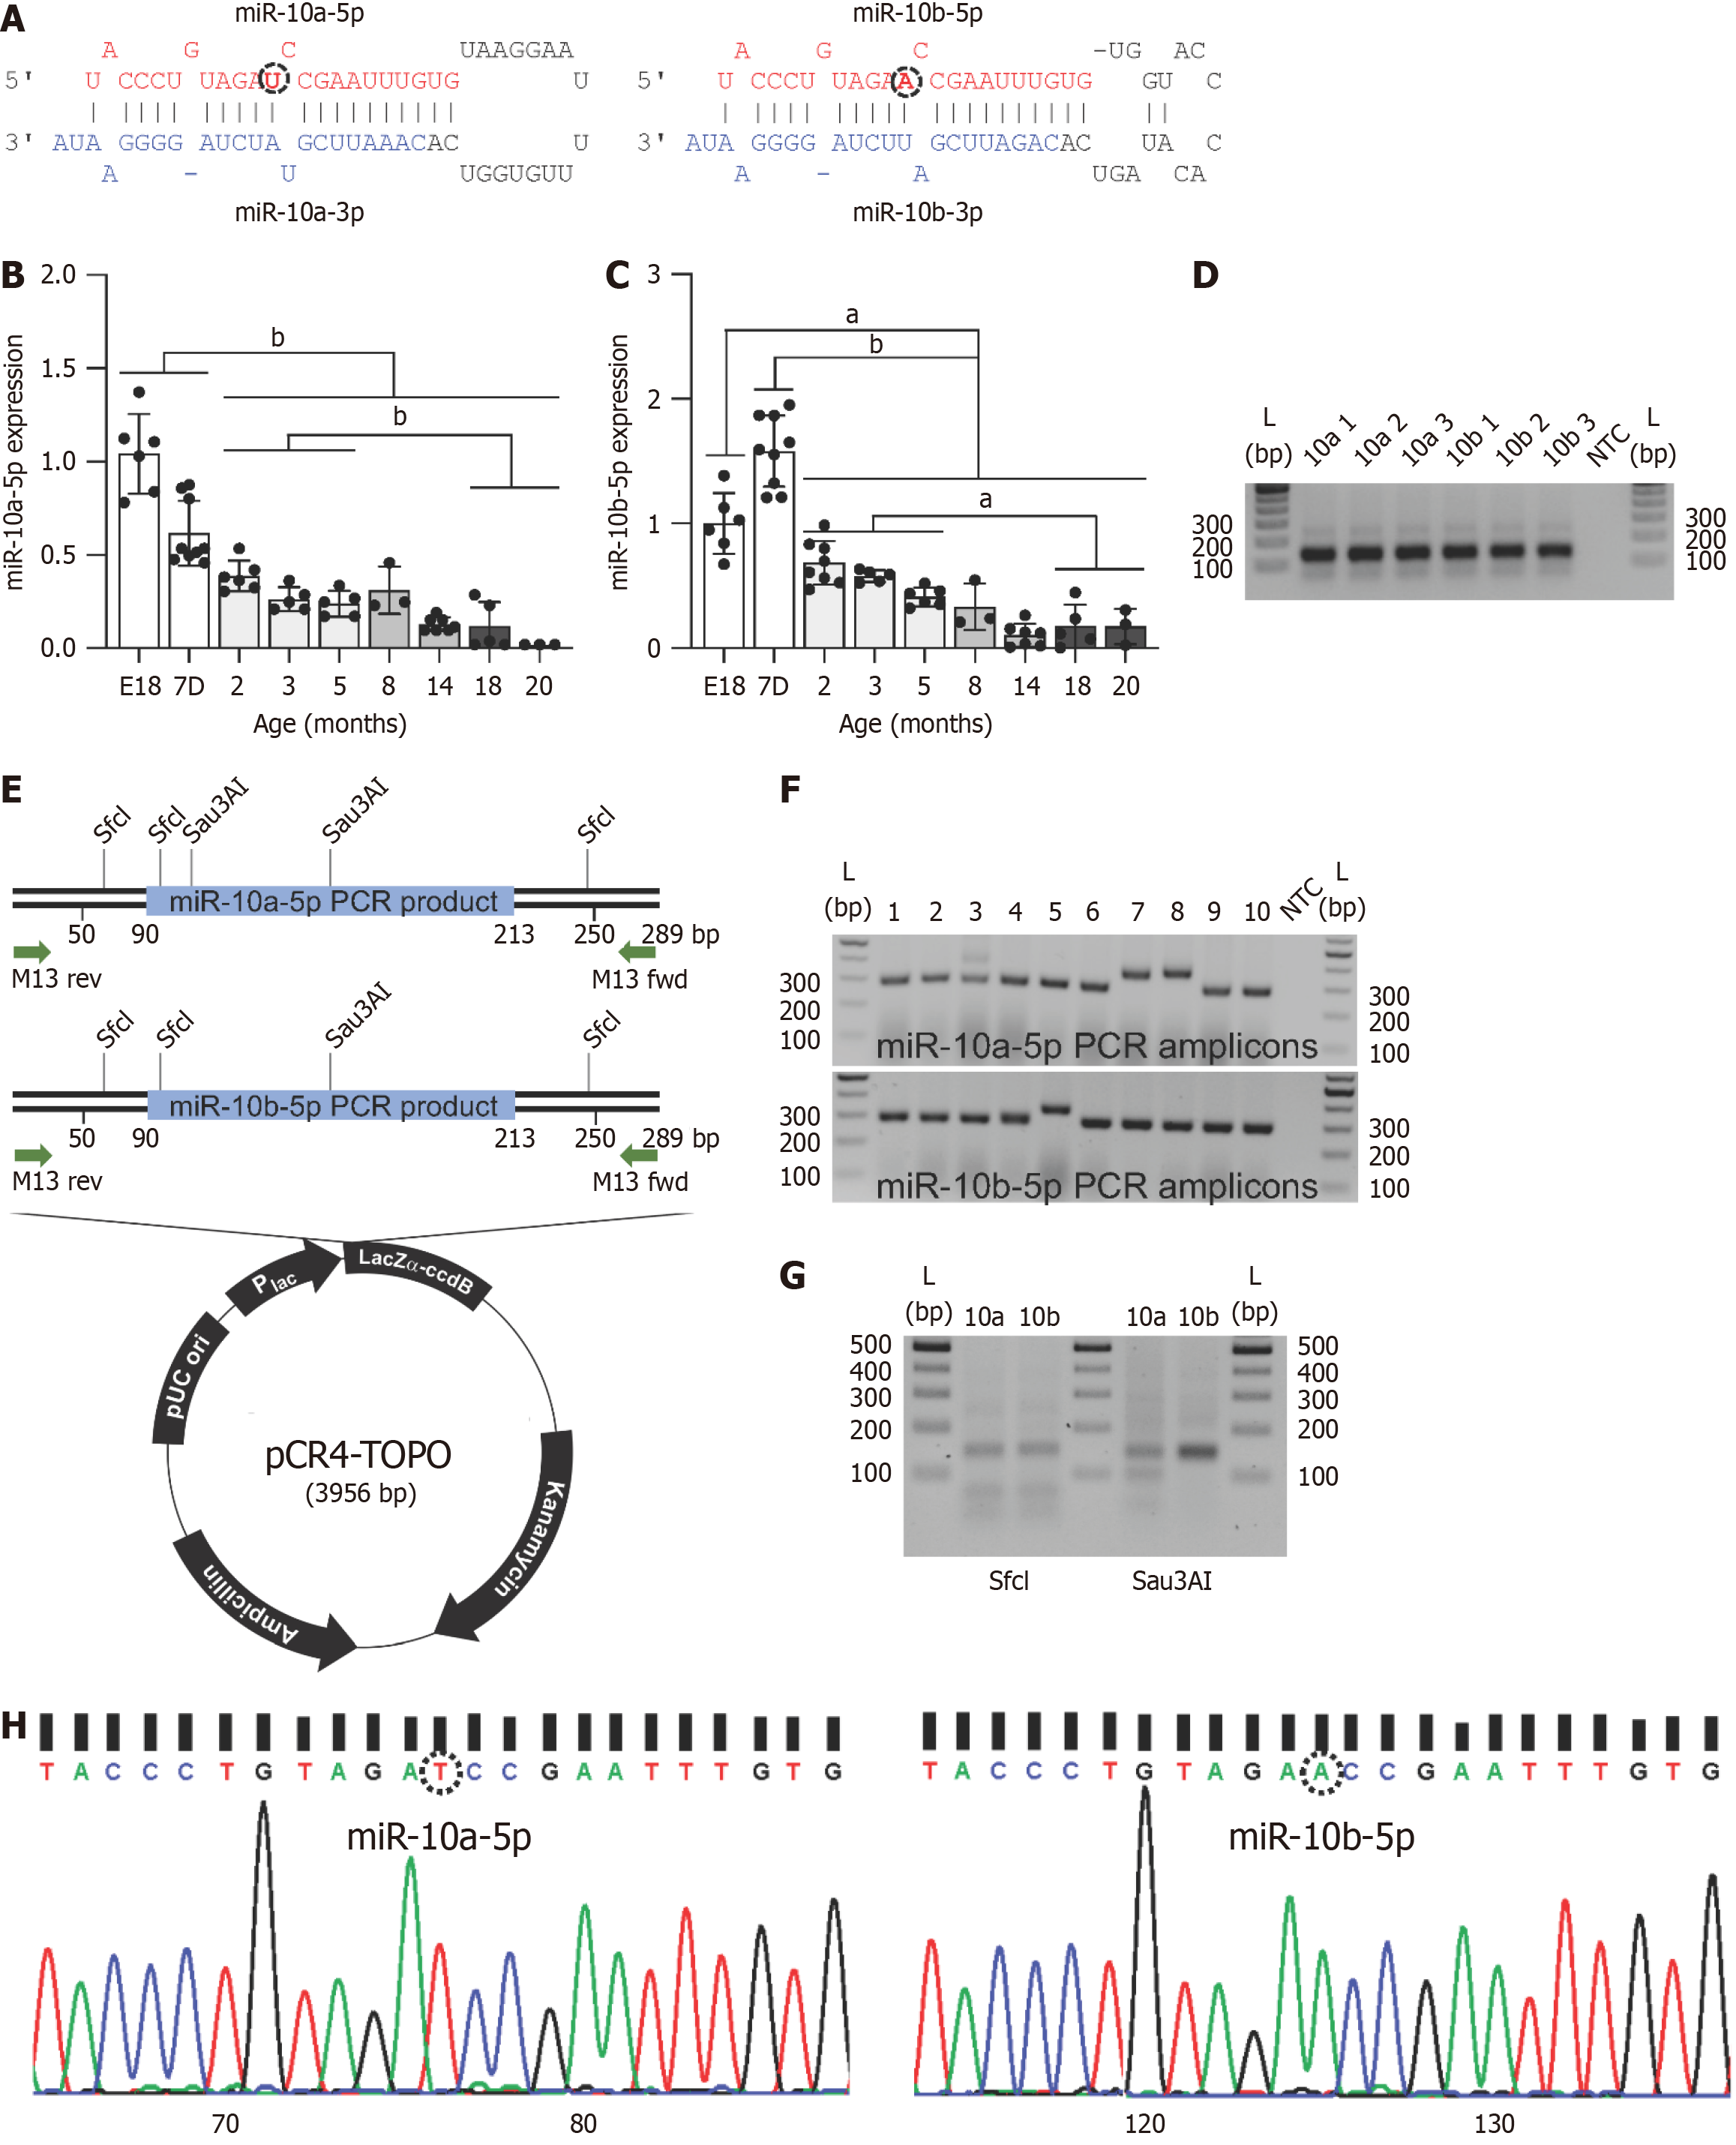
Figure 2 Expression of miR-10a-5p and miR-10b-5p decreases with age.
A: RNA sequence and structure of mouse miR-10a and 10b precursors encoding homologous miR-10a-5p and miR-10b-5p. One nucleotide, U or A differing between miR-10a-5p and miR-10b-5p, is circled; B and C: Expression of miR-10a-5p and miR-10b-5p in the whole gastrointestinal tissue at embryonic stage 18 (E18) and the whole blood from 7 days (7D) to 20 months across different age groups of C57BL/6J mice, measured by qPCR. Data were presented as mean ± SD. n ≥ 3 per group. aP < 0.05; bP < 0.01; D: QPCR amplicons of miR-10a-5p and miR-10b-5p electrophoresed on a 2% agarose gel. NTC stands for a non-template control. A DNA ladder was loaded on each side the gel; E: Construction of a TOPO®TA based expression vector cloned with miR-10a-5p or miR-10b-5p PCR products. A primer set, M13 forward and reverse primers, used to amplify PCR products (289 bp) is shown. Restriction enzyme sites for SfcI and Sau3AI are indicated; F: Colony PCR products electrophoresed on 2% agarose gels; G: PCR-amplified products digested with Sfcl and Sau3AI electrophoresed on a 1% agarose gel; H: MiR-10a-5p and miR-10b-5p sequencing chromatograms. One nucleotide, T or A differing between miR-10a-5p and miR-10b-5p, is circled.
- Citation: Baek G, Singh R, Ha SE, Cho H, Padmanabhan S, Vishwanath V, Kim MS, Seon D, You J, Lee MY, Ro S. miR-10a-5p and miR-10b-5p restore colonic motility in aged mice. World J Gastroenterol 2025; 31(24): 104437
- URL: https://www.wjgnet.com/1007-9327/full/v31/i24/104437.htm
- DOI: https://dx.doi.org/10.3748/wjg.v31.i24.104437


