Copyright
©The Author(s) 2020.
World J Gastroenterol. Oct 28, 2020; 26(40): 6224-6240
Published online Oct 28, 2020. doi: 10.3748/wjg.v26.i40.6224
Published online Oct 28, 2020. doi: 10.3748/wjg.v26.i40.6224
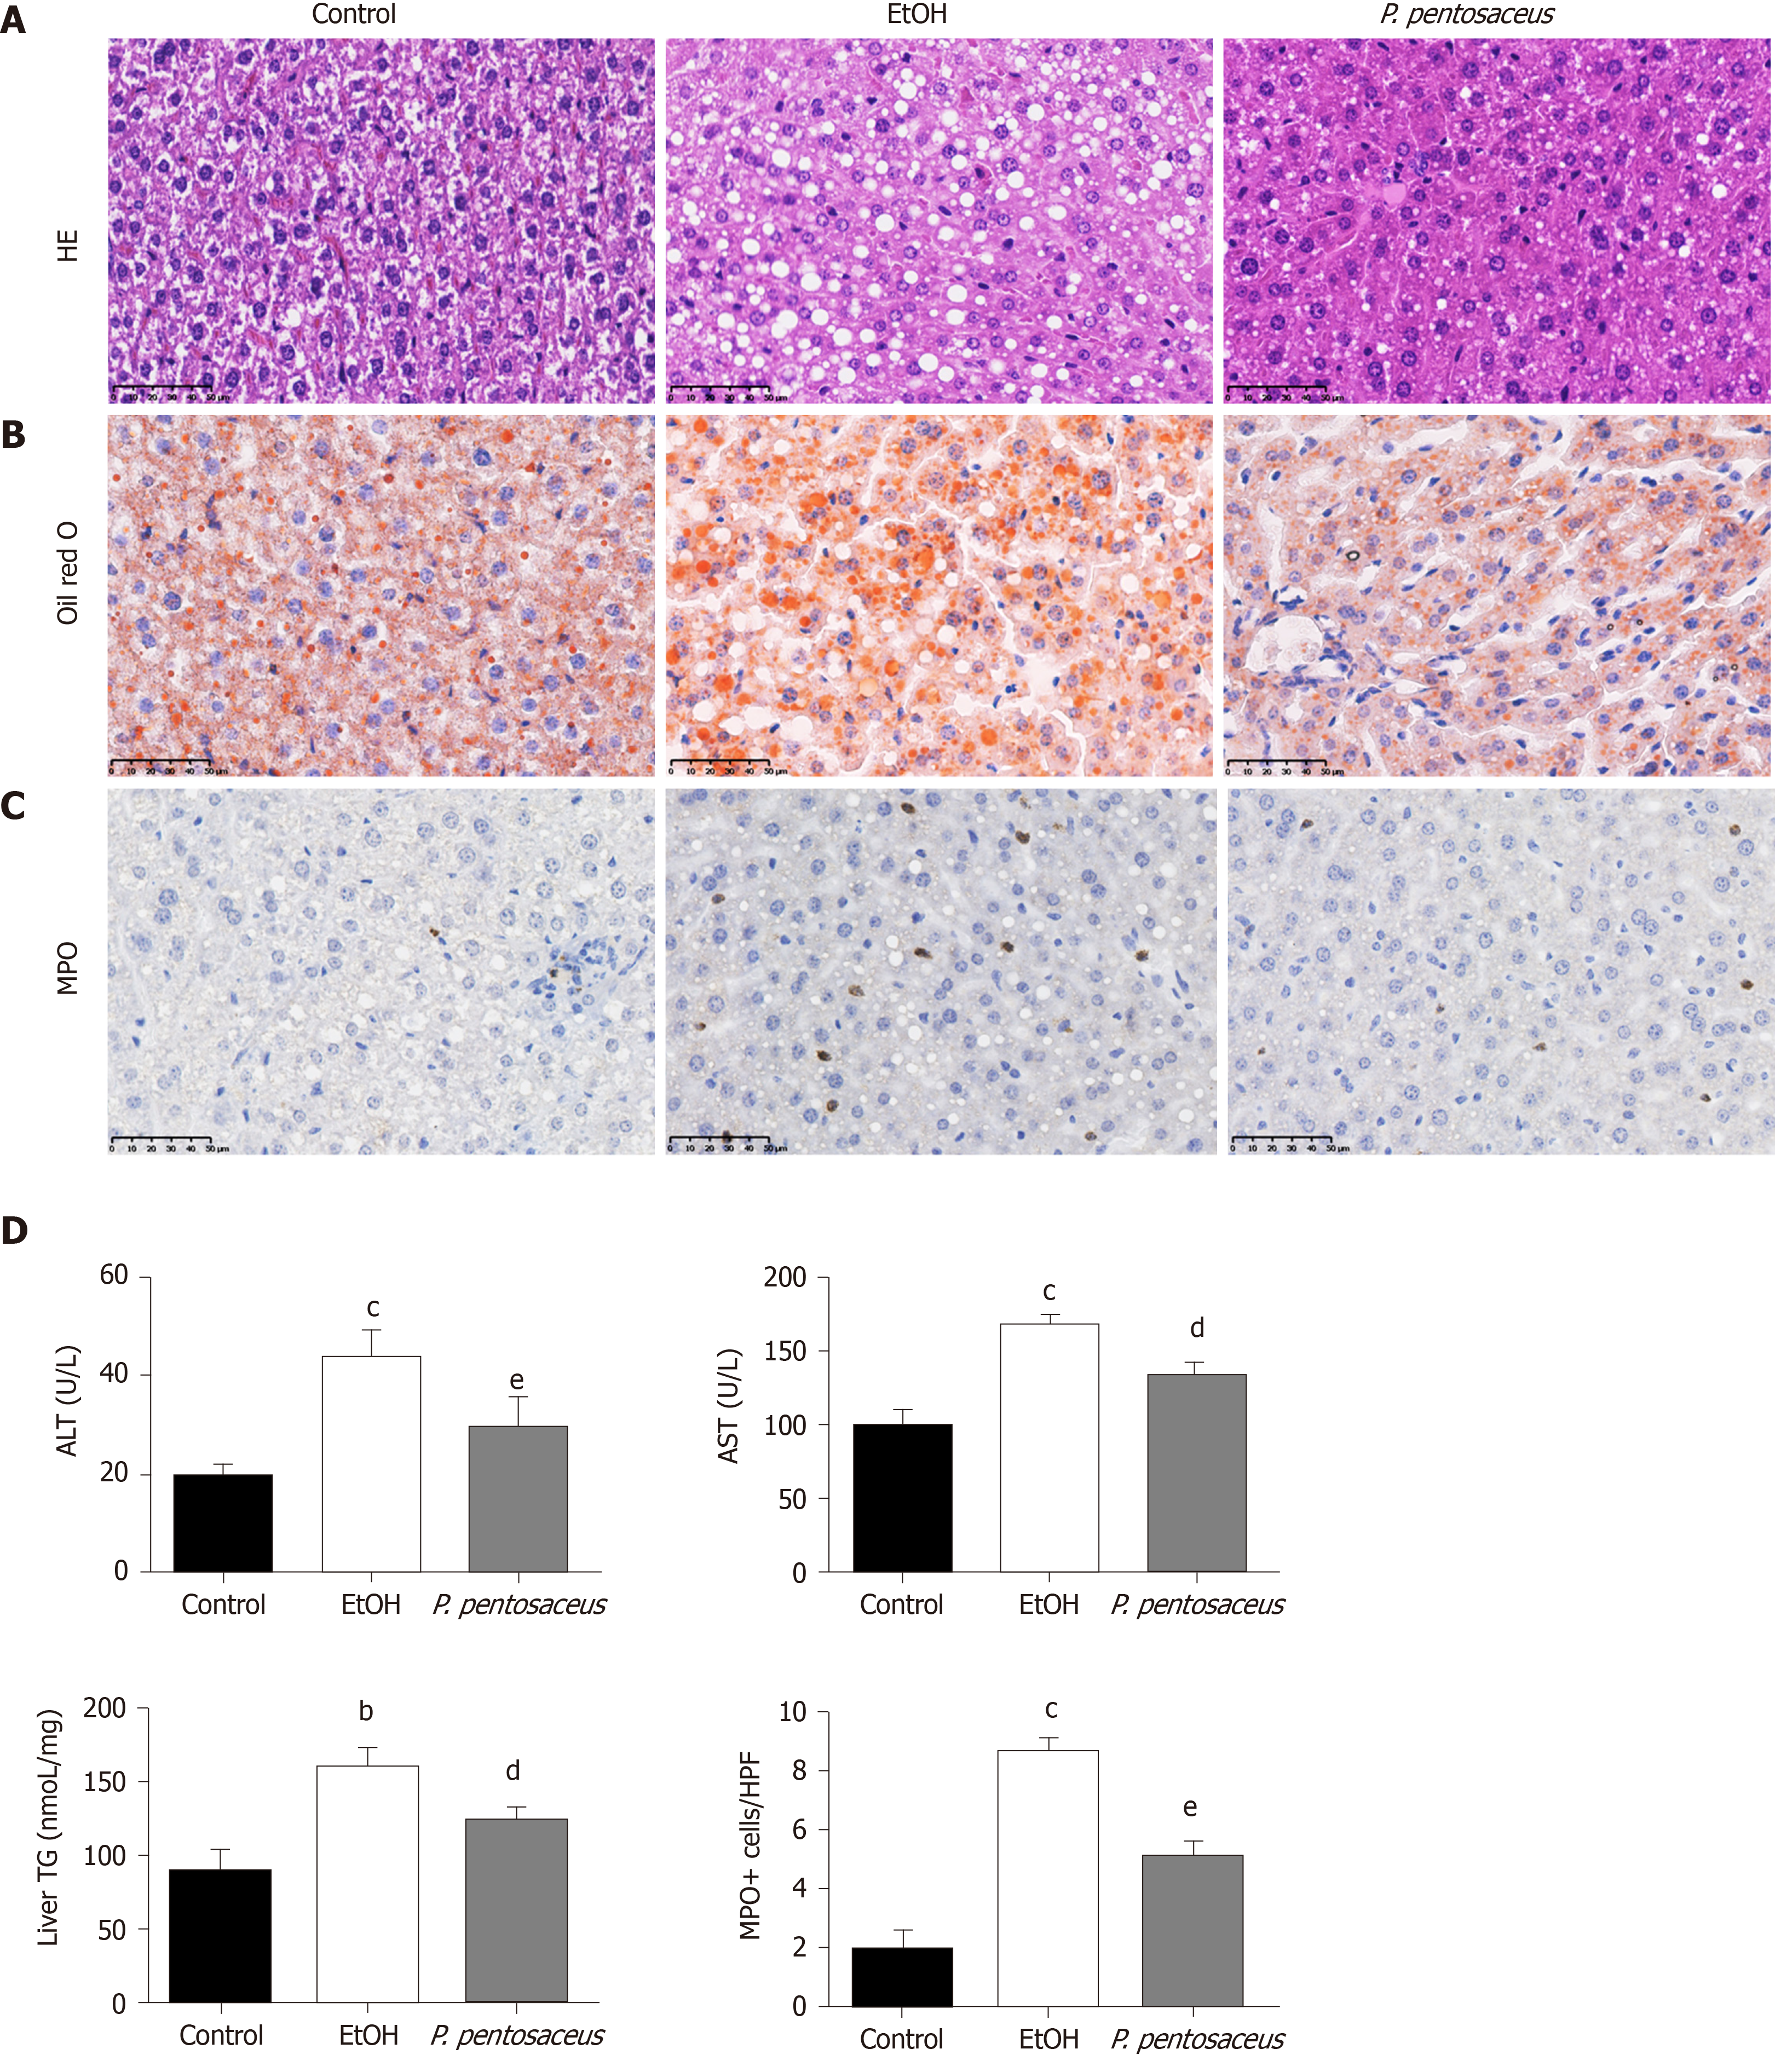
Figure 1 The hepatic histopathological examination and liver inflammation and steatosis parameters.
A: Representative histological images of the liver stained with HE. Scale bar: 50 μm; B: Representative images of oil red O-stained liver sections. Scale bar: 50 μm; C: Immunohistochemical staining for myeloperoxidase. Scale bar: 50 μm; D: Quantification of triglyceride and myeloperoxidase-positive cells in the liver and alanine aminotransferase and aspartate transaminase levels. All data are presented as means ± SE. bP < 0.01, cP < 0.001 vs the Control group. dP < 0.05, eP < 0.01 vs the EtOH group. P. pentosaceus: Pediococcus pentosaceus; HE: Hematoxylin and eosin; MPO: Myeloperoxidase; ALT: Alanine aminotransferase; AST: Aspartate transaminase; TG: Triglyceride.
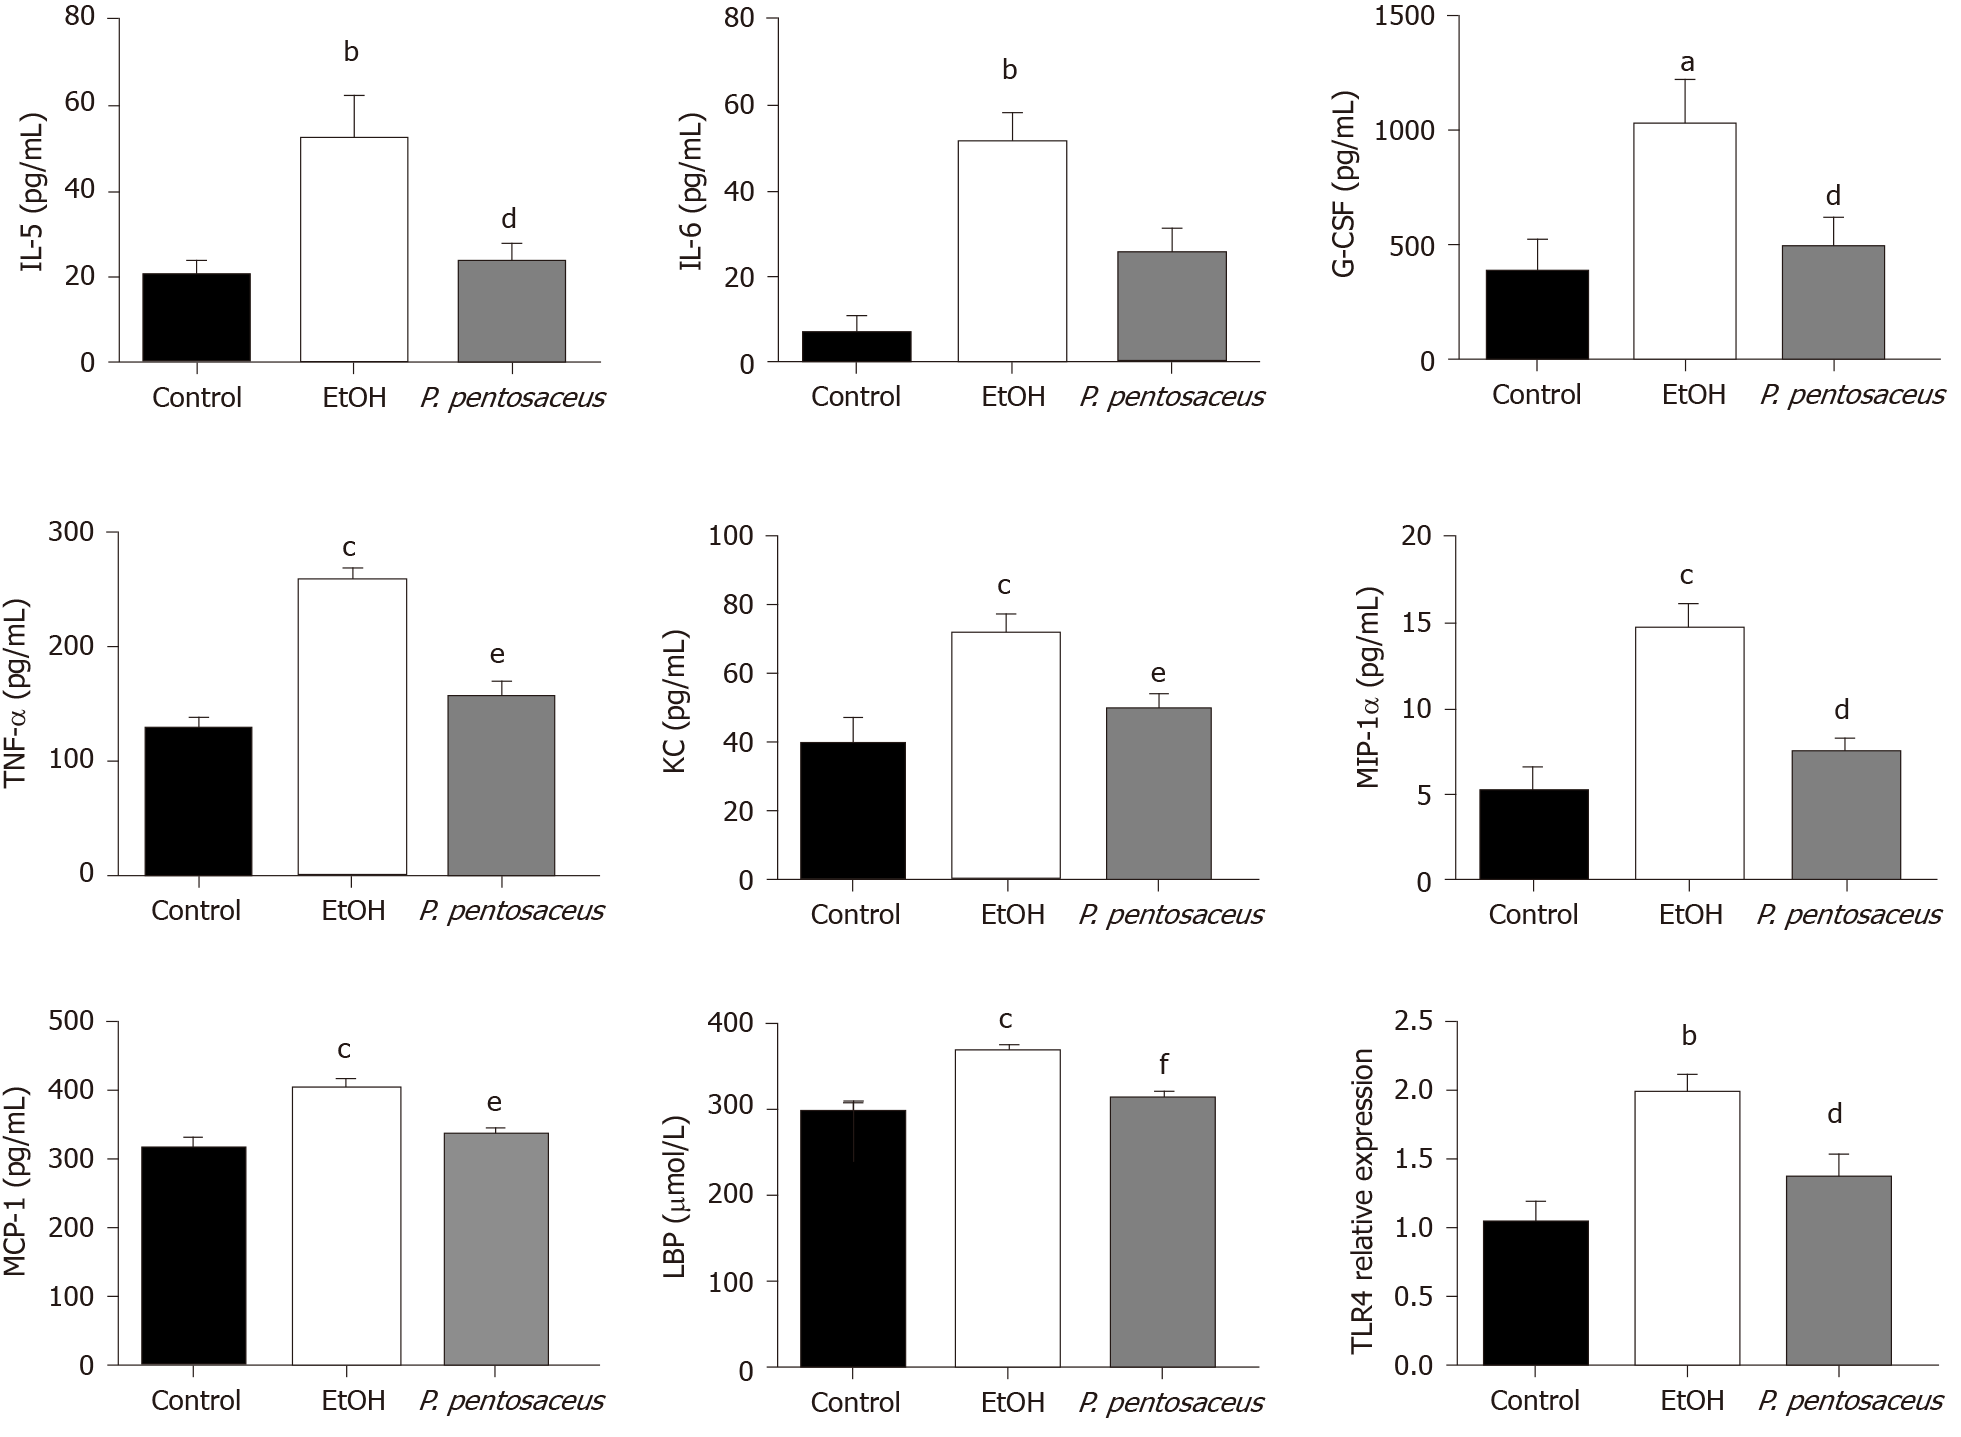
Figure 2 Effects of the Pediococcus pentosaceus treatment on lipopolysaccharide-binding protein and proinflammatory cytokine levels during ethanol-induced liver injury.
The serum levels of interleukin (IL)-5, IL-6, granulocyte colony-stimulating factor, tumor necrosis factor-α, keratinocyte-derived protein chemokine, macrophage inflammatory protein-1α, monocyte chemoattractant protein-1 and lipopolysaccharide-binding protein and expression of the Toll-like receptor 4 mRNA in the liver. All data are presented as means ± SE. aP < 0.05, bP < 0.01, cP < 0.001 vs the Control group. dP < 0.05, eP < 0.01, fP < 0.001 vs the EtOH group. P. pentosaceus: Pediococcus pentosaceus; IL: Interleukin; G-CSF: Granulocyte colony-stimulating factor; TNF-α: Tumor necrosis factor-α; KC: Keratinocyte-derived protein chemokine; MIP-1α: Macrophage inflammatory protein-1α; MCP-1: Monocyte chemoattractant protein-1; LBP: Lipopolysaccharide-binding protein; TLR4: Toll-like receptor 4.
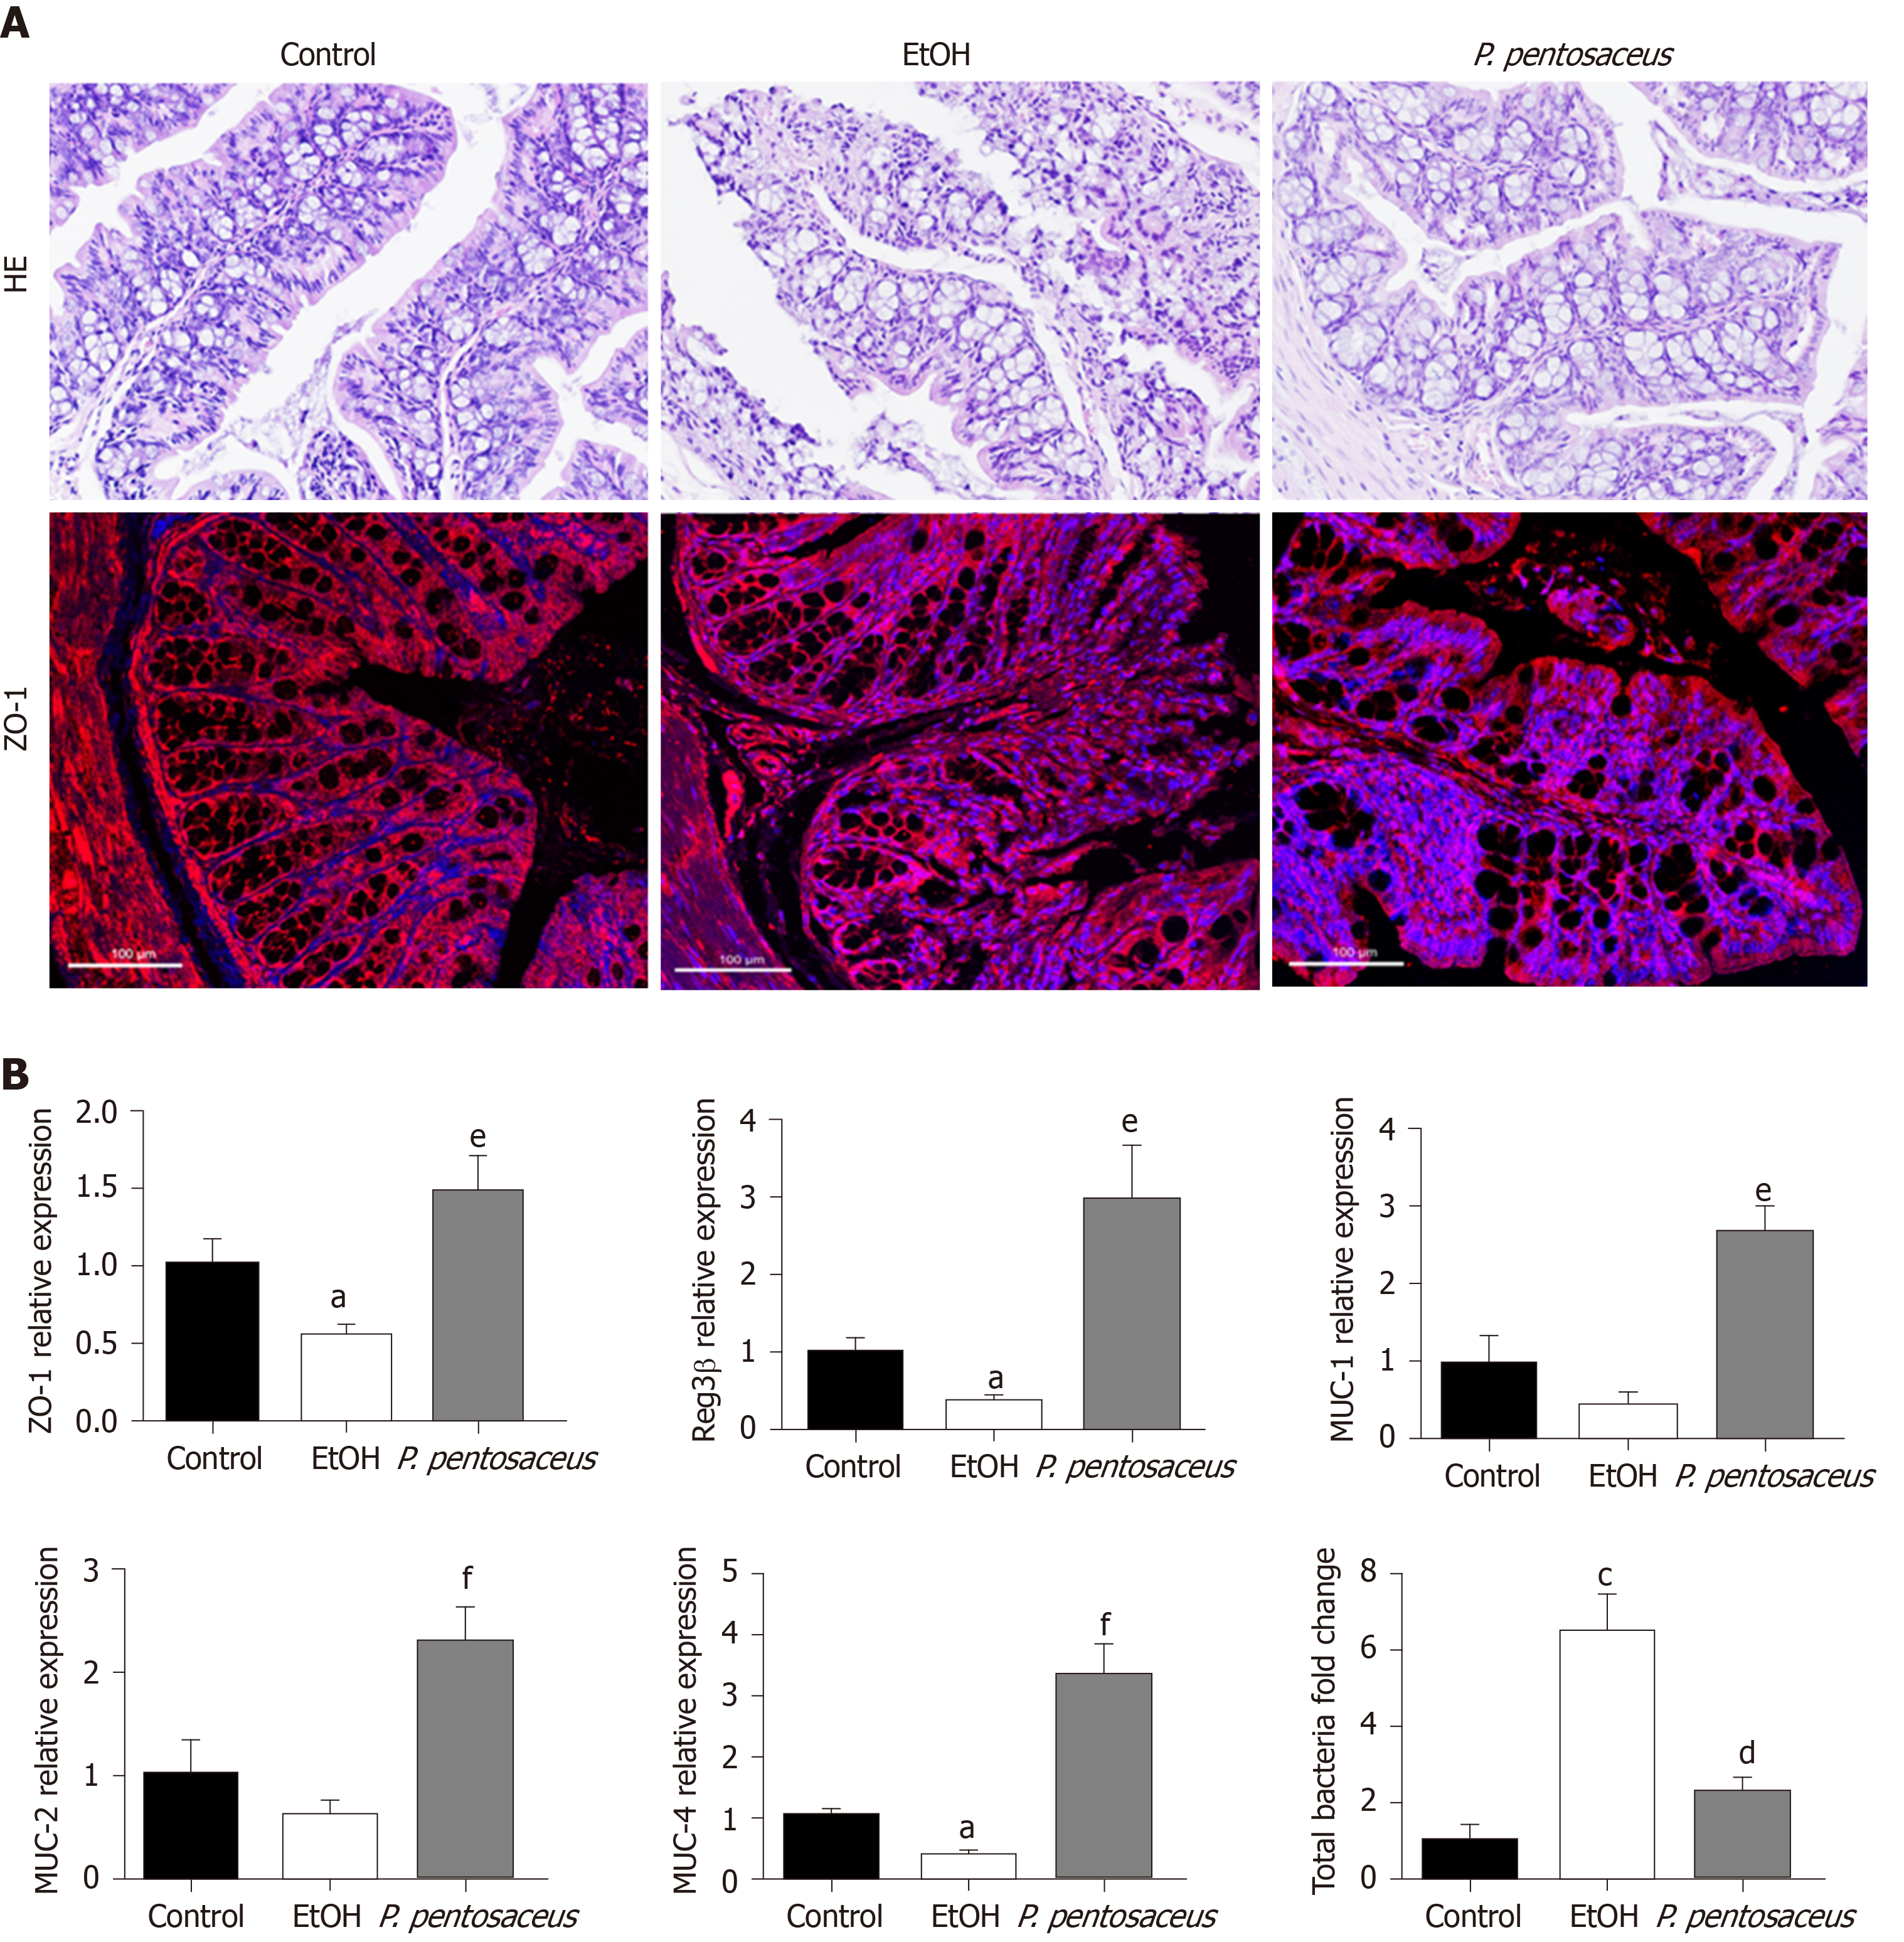
Figure 3 Histopathological examination of the colon and the expression of intestinal barrier markers.
A: Representative histological images of the colon stained with hematoxylin and eosin and images of immunofluorescence staining for ZO-1. Scale bar: 100 μm; B: Relative mRNA levels of ZO-1, mucin (MUC)-1, MUC-2, MUC-4, Reg3β and the total bacterial 16S rRNA. All data are presented as means ± SE. aP < 0.05, cP < 0.001 vs the Control group. dP < 0.05, eP < 0.01, fP < 0.001 vs the EtOH group. P. pentosaceus: Pediococcus pentosaceus; HE: Hematoxylin and eosin; MUC: Mucin.
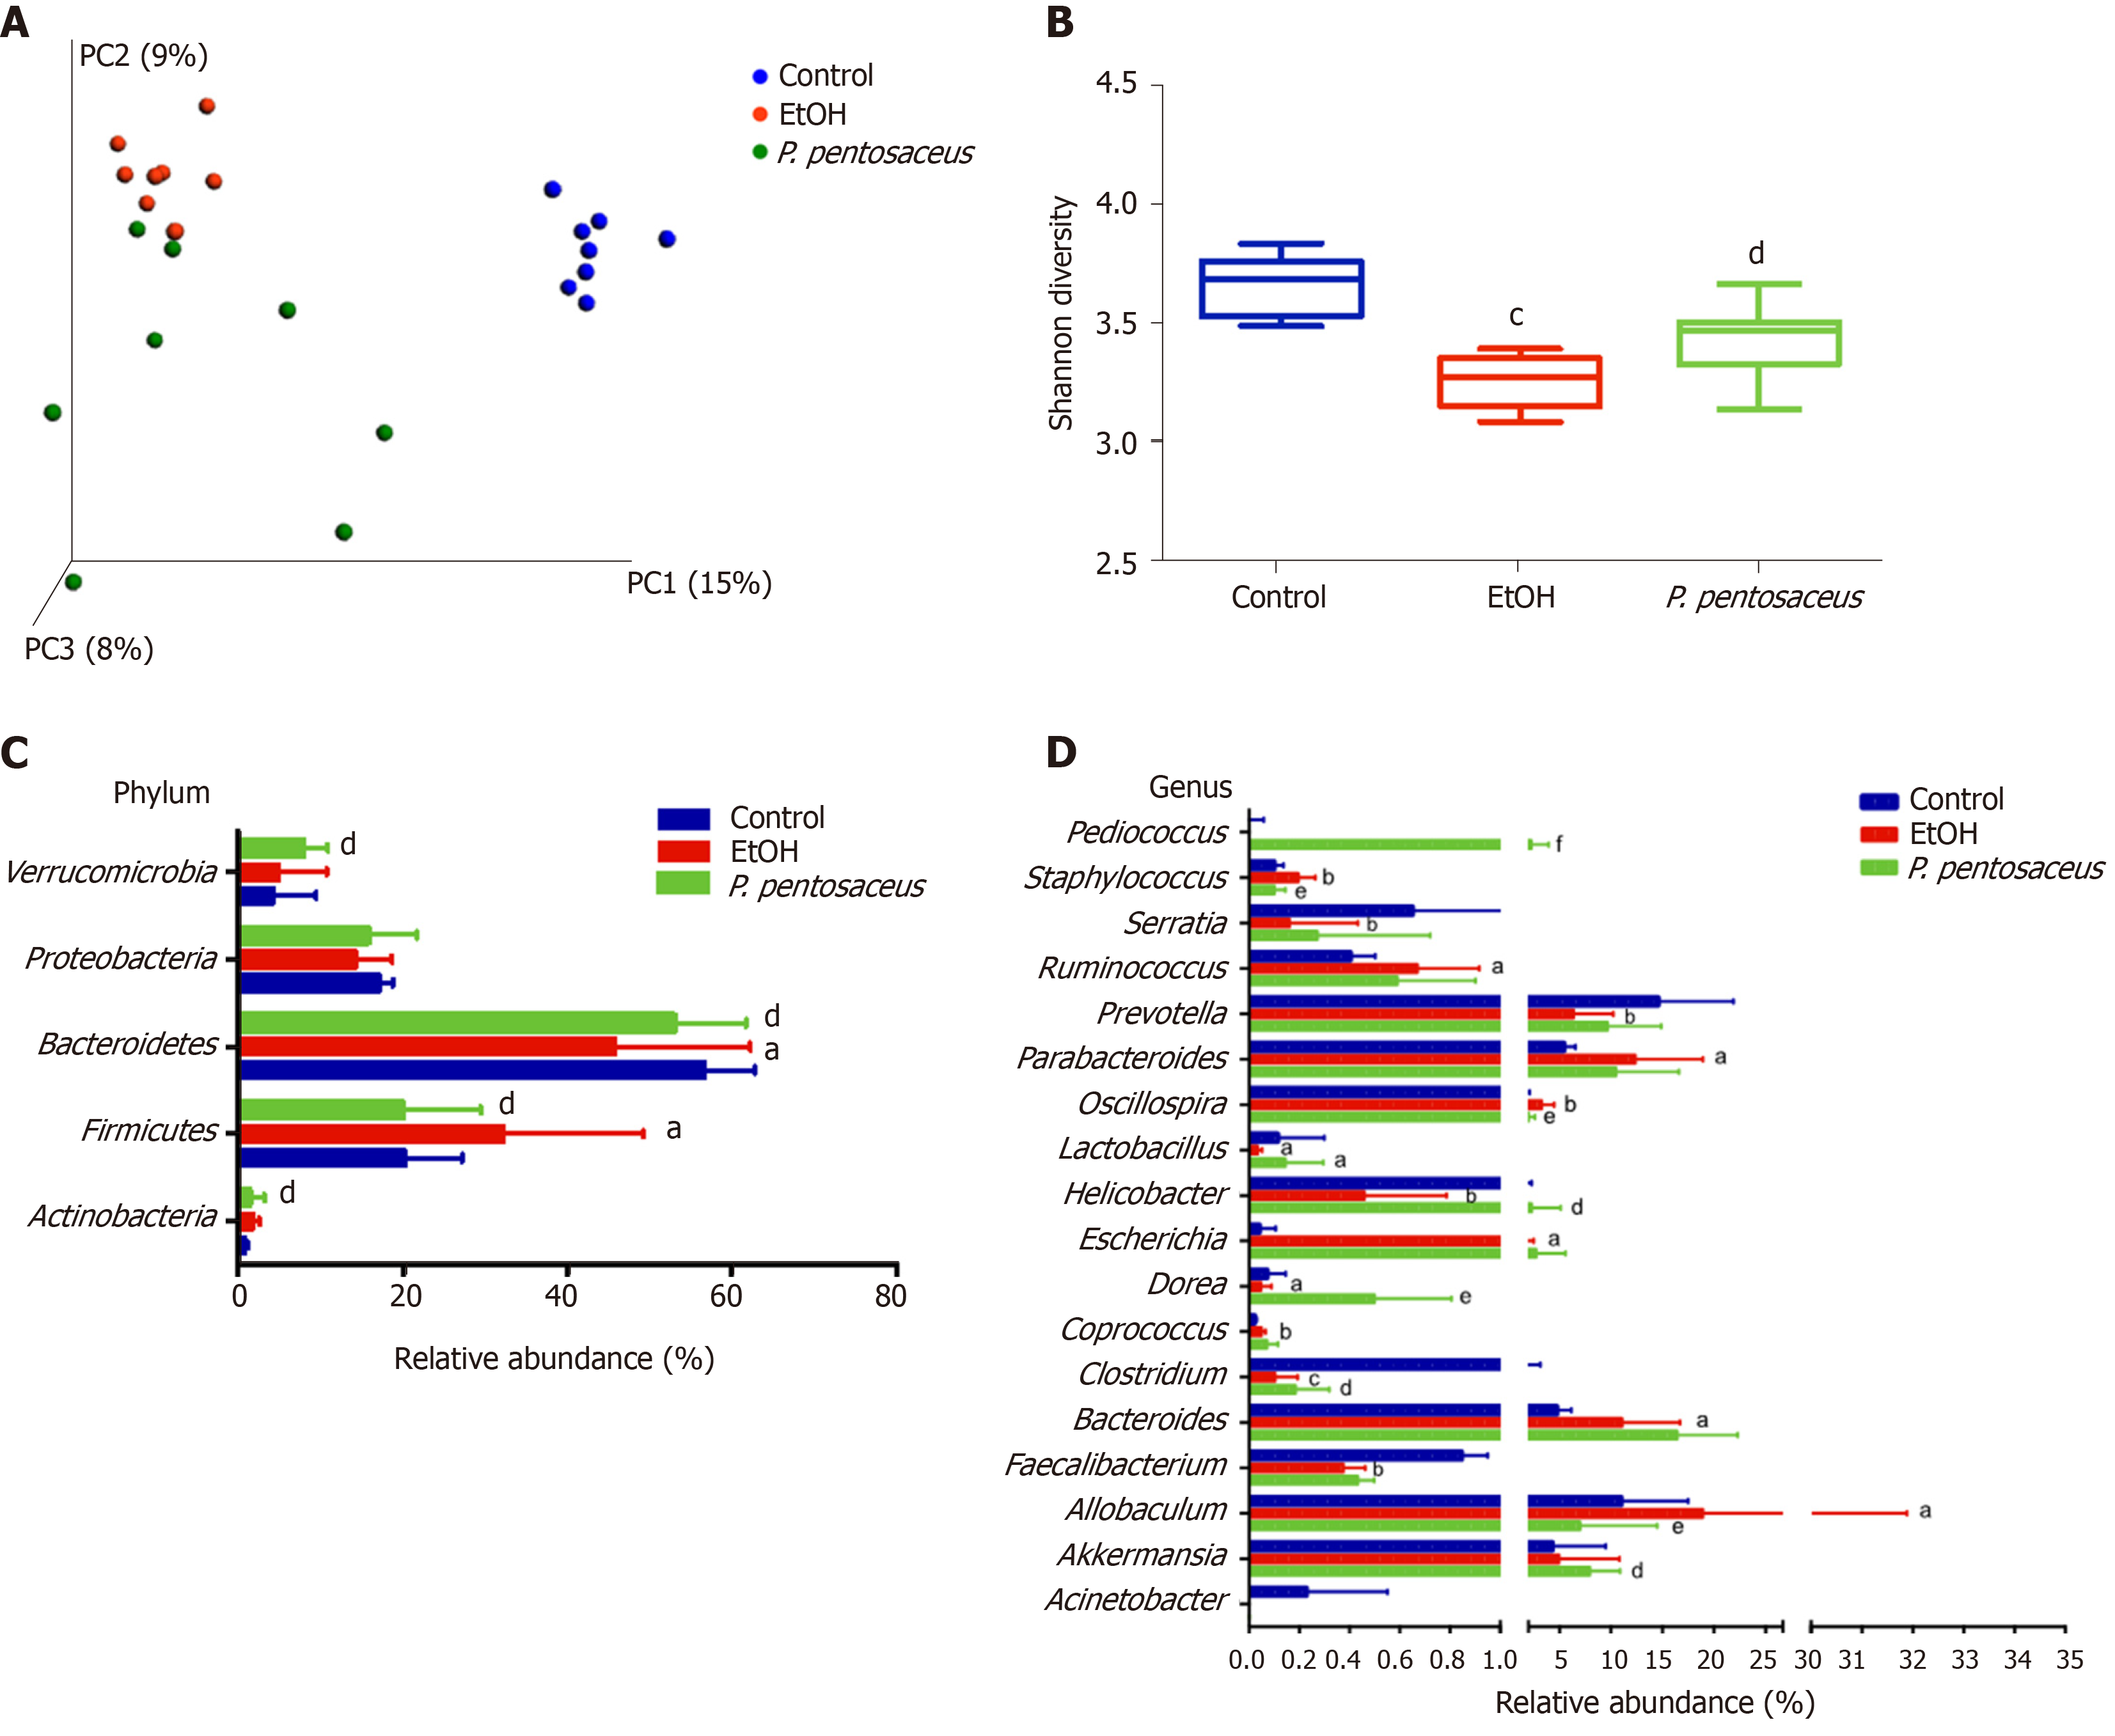
Figure 4 Alterations in the bacterial diversity and microbial composition.
A: Principal co-ordinates analysis plot of the microbiomes of different groups; each symbol represents one sample; B: Shannon diversity indices among the three groups; C: The relative abundance of taxa at the phylum level; D: The relative abundance of taxa at the genus level. All data are presented as means ± SE. aP < 0.05, bP < 0.01, cP < 0.001 vs the Control group. dP < 0.05, eP < 0.01, fP < 0.001 vs the EtOH group. PC: principal co-ordinates; P. pentosaceus: Pediococcus pentosaceus.
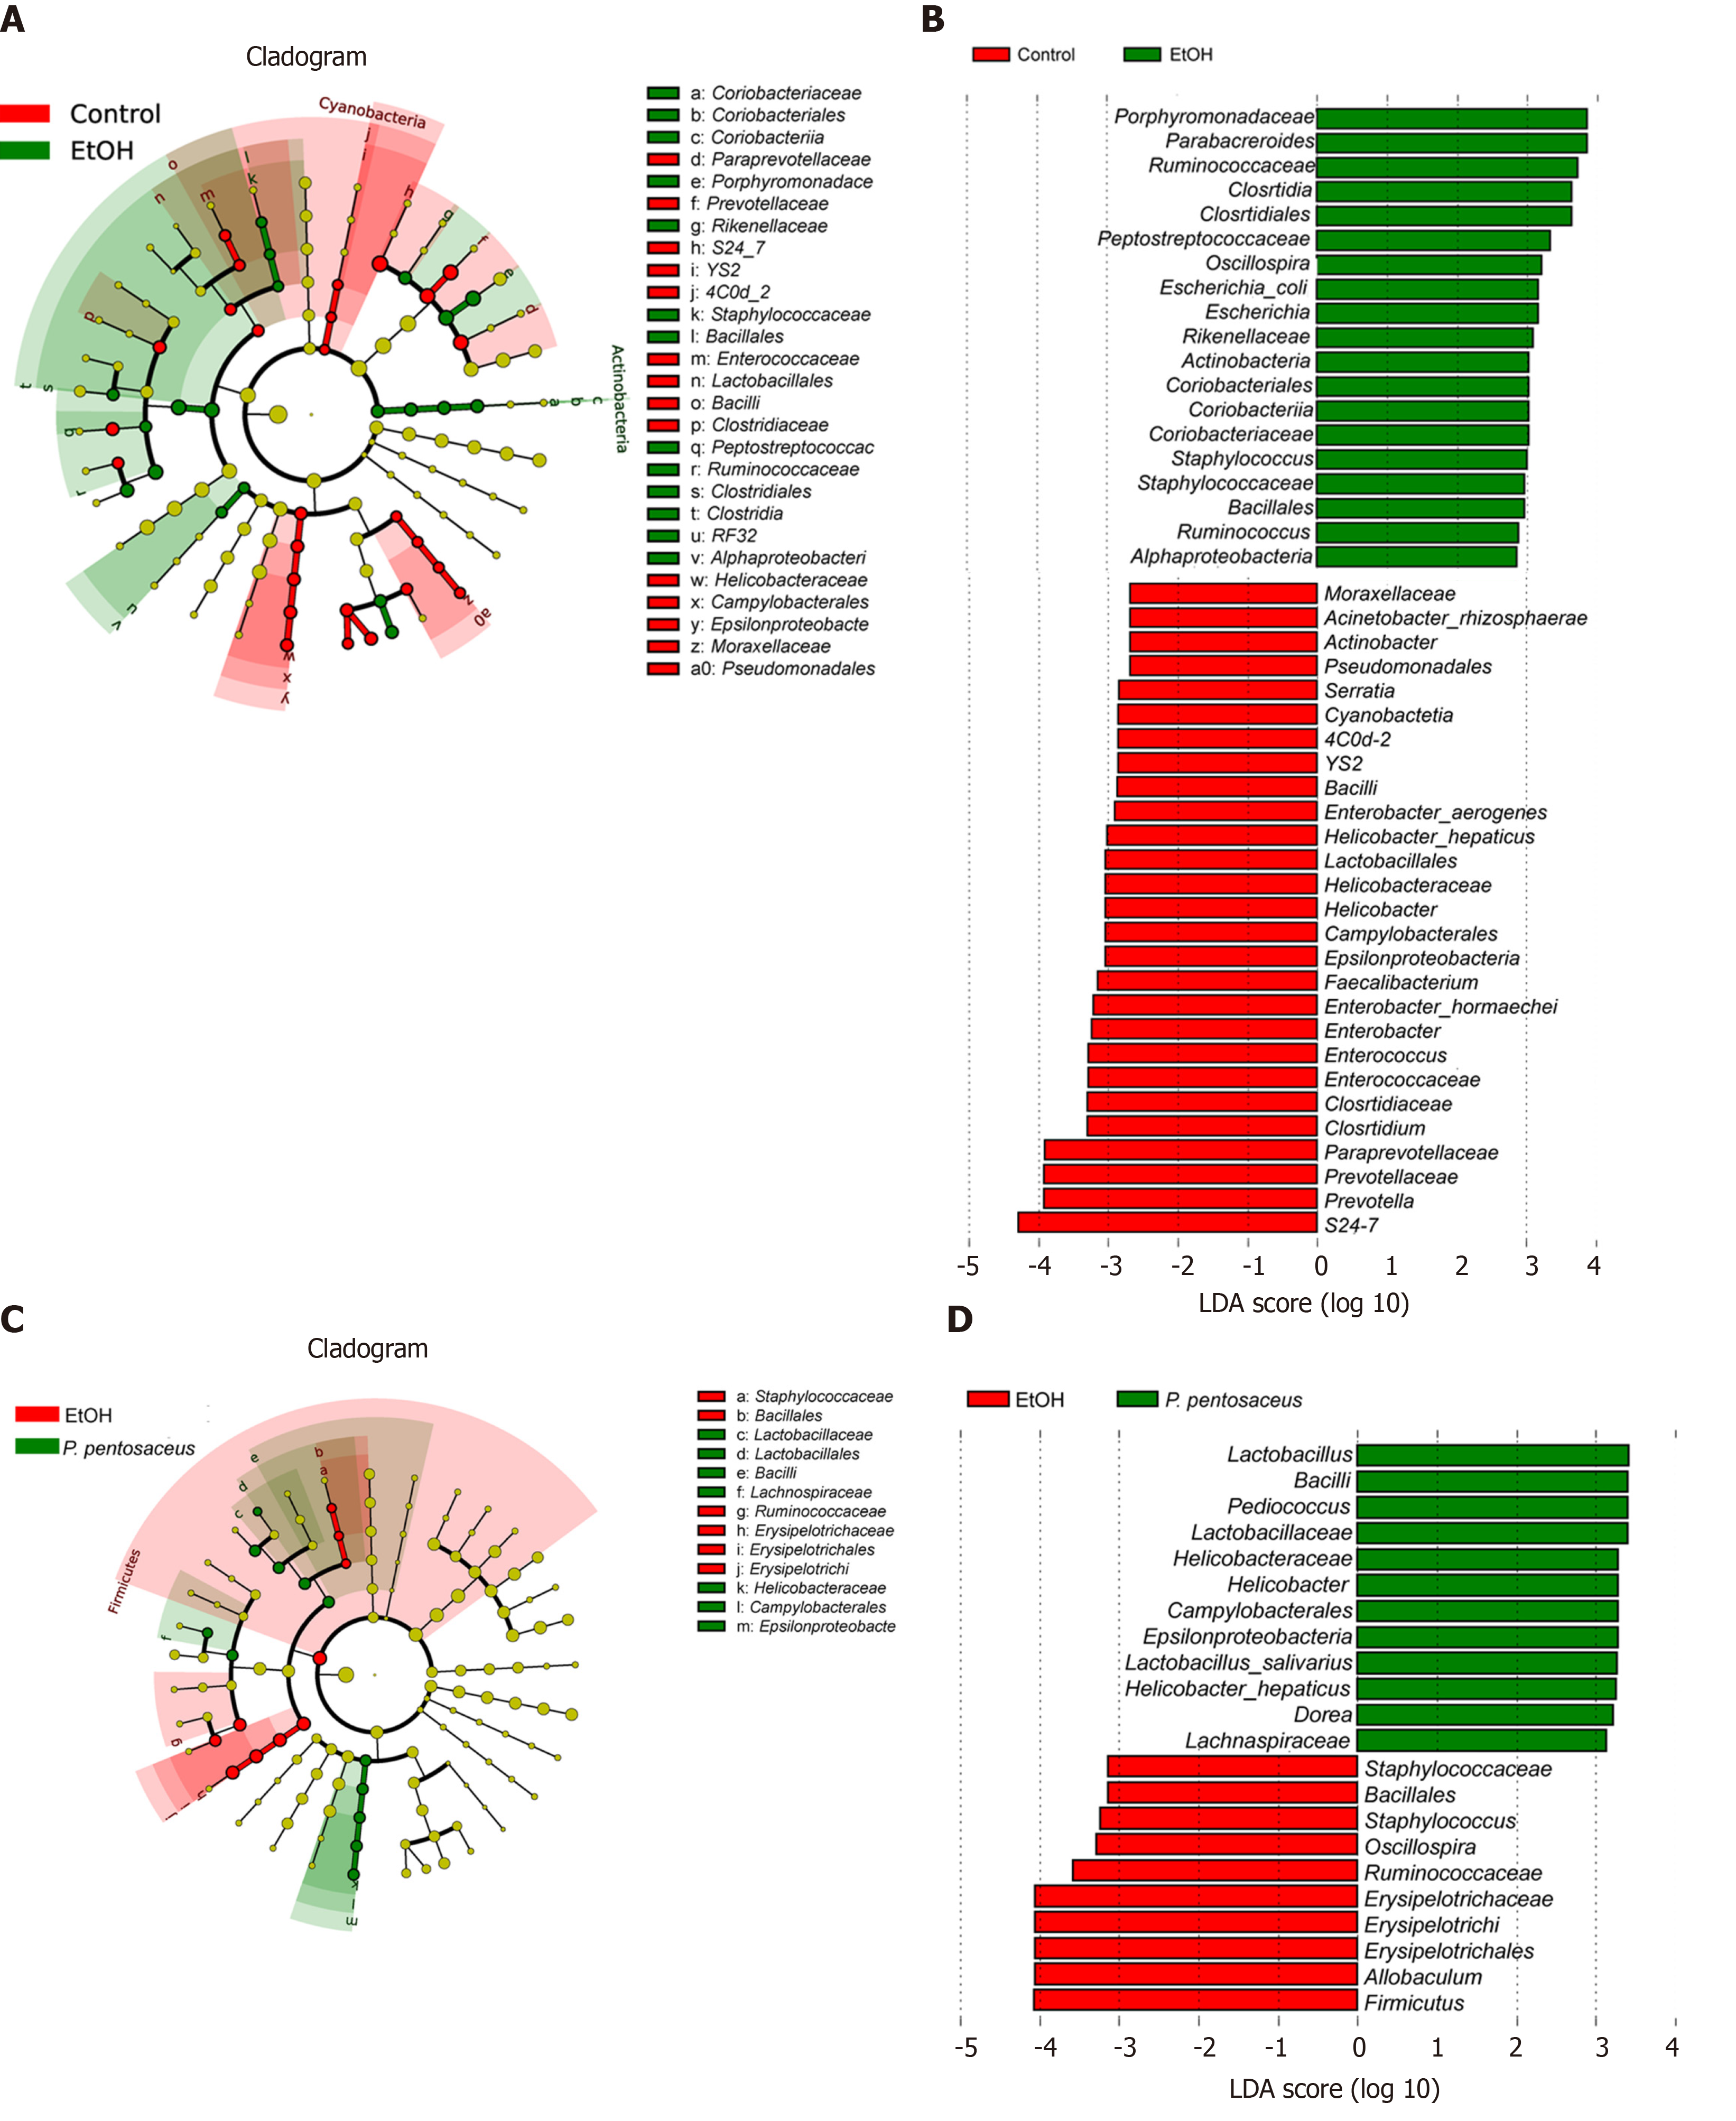
Figure 5 The effects of Pediococcus pentosaceus supplementation on the microbial community according to the linear discriminant analysis effect size analysis.
Cladogram showing the most differentially abundant taxa among groups. The circle sizes in the cladogram are proportional to the bacterial abundance. Taxa enriched in microbiota from different groups were identified using linear discriminant analysis effect size. P. pentosaceus: Pediococcus pentosaceus; LDA: Linear discriminant analysis.
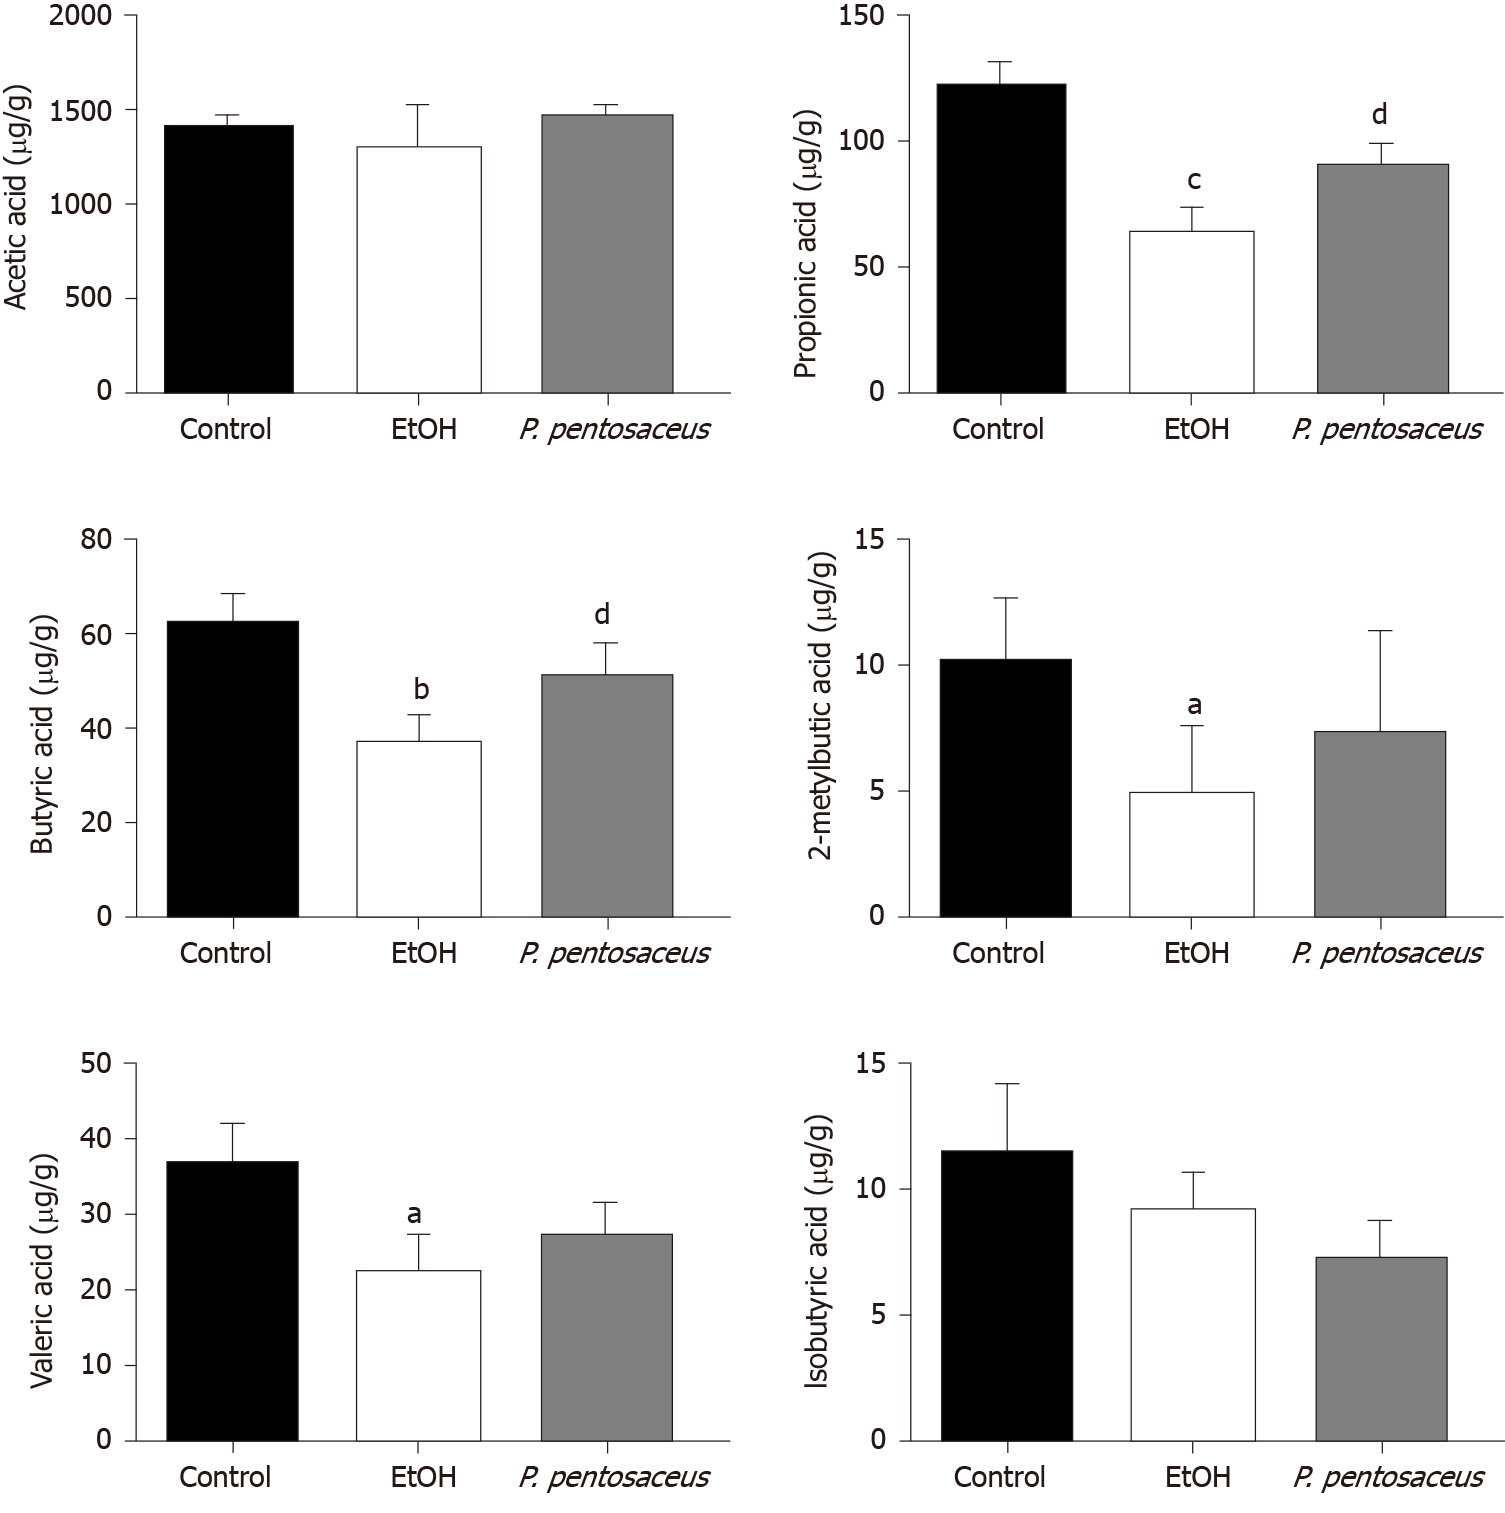
Figure 6 The short-chain fatty acid levels in cecal contents among the three groups.
The levels of acetic acid, propionic acid, butyric acid, isobutyric acid, 2-methylbutyric acid and valeric acid. All data are presented as means ± SE. aP < 0.05, bP < 0.01, cP < 0.001 vs the Control group. dP < 0.05 vs the EtOH group. P. pentosaceus: Pediococcus pentosaceus.
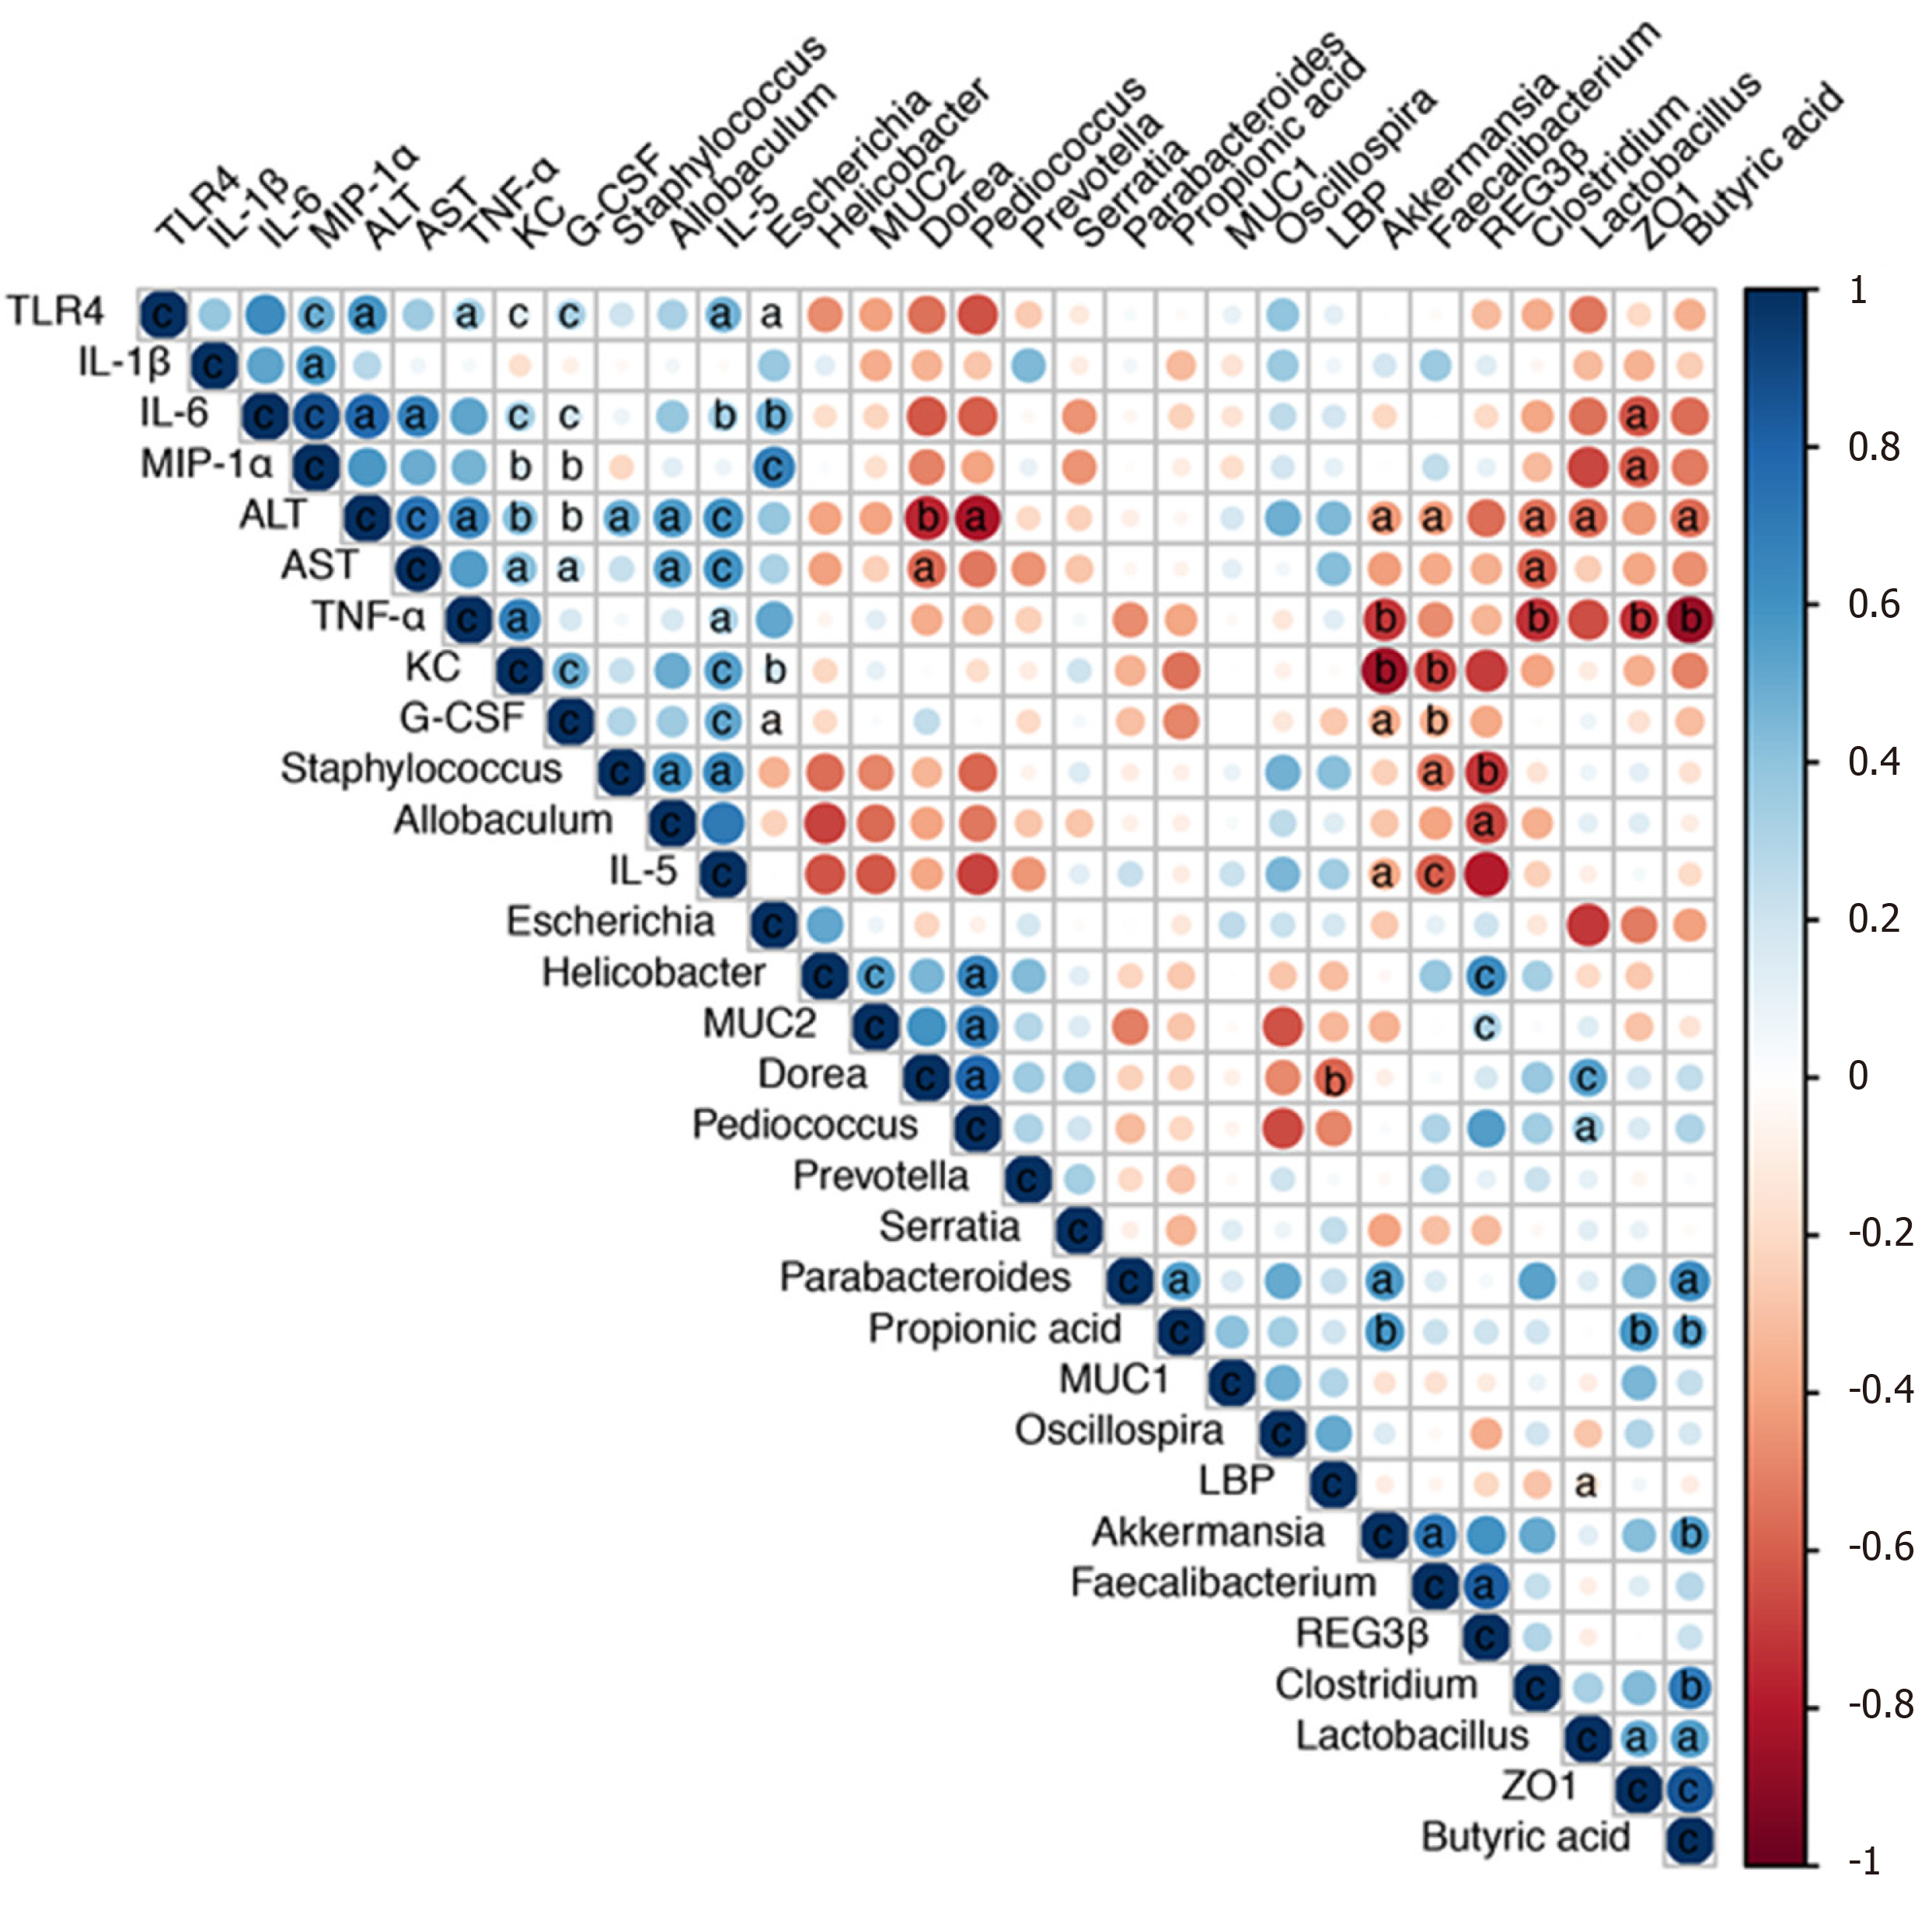
Figure 7 Correlation network analysis of representative microbial genera, gut barrier markers, inflammatory cytokines and liver injury-related indices.
Spearman’s correlation analysis was performed, and statistical significance was indicated as follows: aP < 0.05, bP < 0.01, cP < 0.001. TLR4: Toll-like receptor 4; IL: Interleukin; MIP-1α: Macrophage inflammatory protein-1α; ALT: Alanine aminotransferase; AST: Aspartate transaminase; TNF-α: Tumor necrosis factor-α; KC: Keratinocyte-derived protein chemokine; G-CSF: Granulocyte colony-stimulating factor; MUC: Mucin; LBP: Lipopolysaccharide-binding protein.
- Citation: Jiang XW, Li YT, Ye JZ, Lv LX, Yang LY, Bian XY, Wu WR, Wu JJ, Shi D, Wang Q, Fang DQ, Wang KC, Wang QQ, Lu YM, Xie JJ, Li LJ. New strain of Pediococcus pentosaceus alleviates ethanol-induced liver injury by modulating the gut microbiota and short-chain fatty acid metabolism. World J Gastroenterol 2020; 26(40): 6224-6240
- URL: https://www.wjgnet.com/1007-9327/full/v26/i40/6224.htm
- DOI: https://dx.doi.org/10.3748/wjg.v26.i40.6224


