Copyright
©The Author(s) 2020.
World J Gastroenterol. Oct 28, 2020; 26(40): 6224-6240
Published online Oct 28, 2020. doi: 10.3748/wjg.v26.i40.6224
Published online Oct 28, 2020. doi: 10.3748/wjg.v26.i40.6224
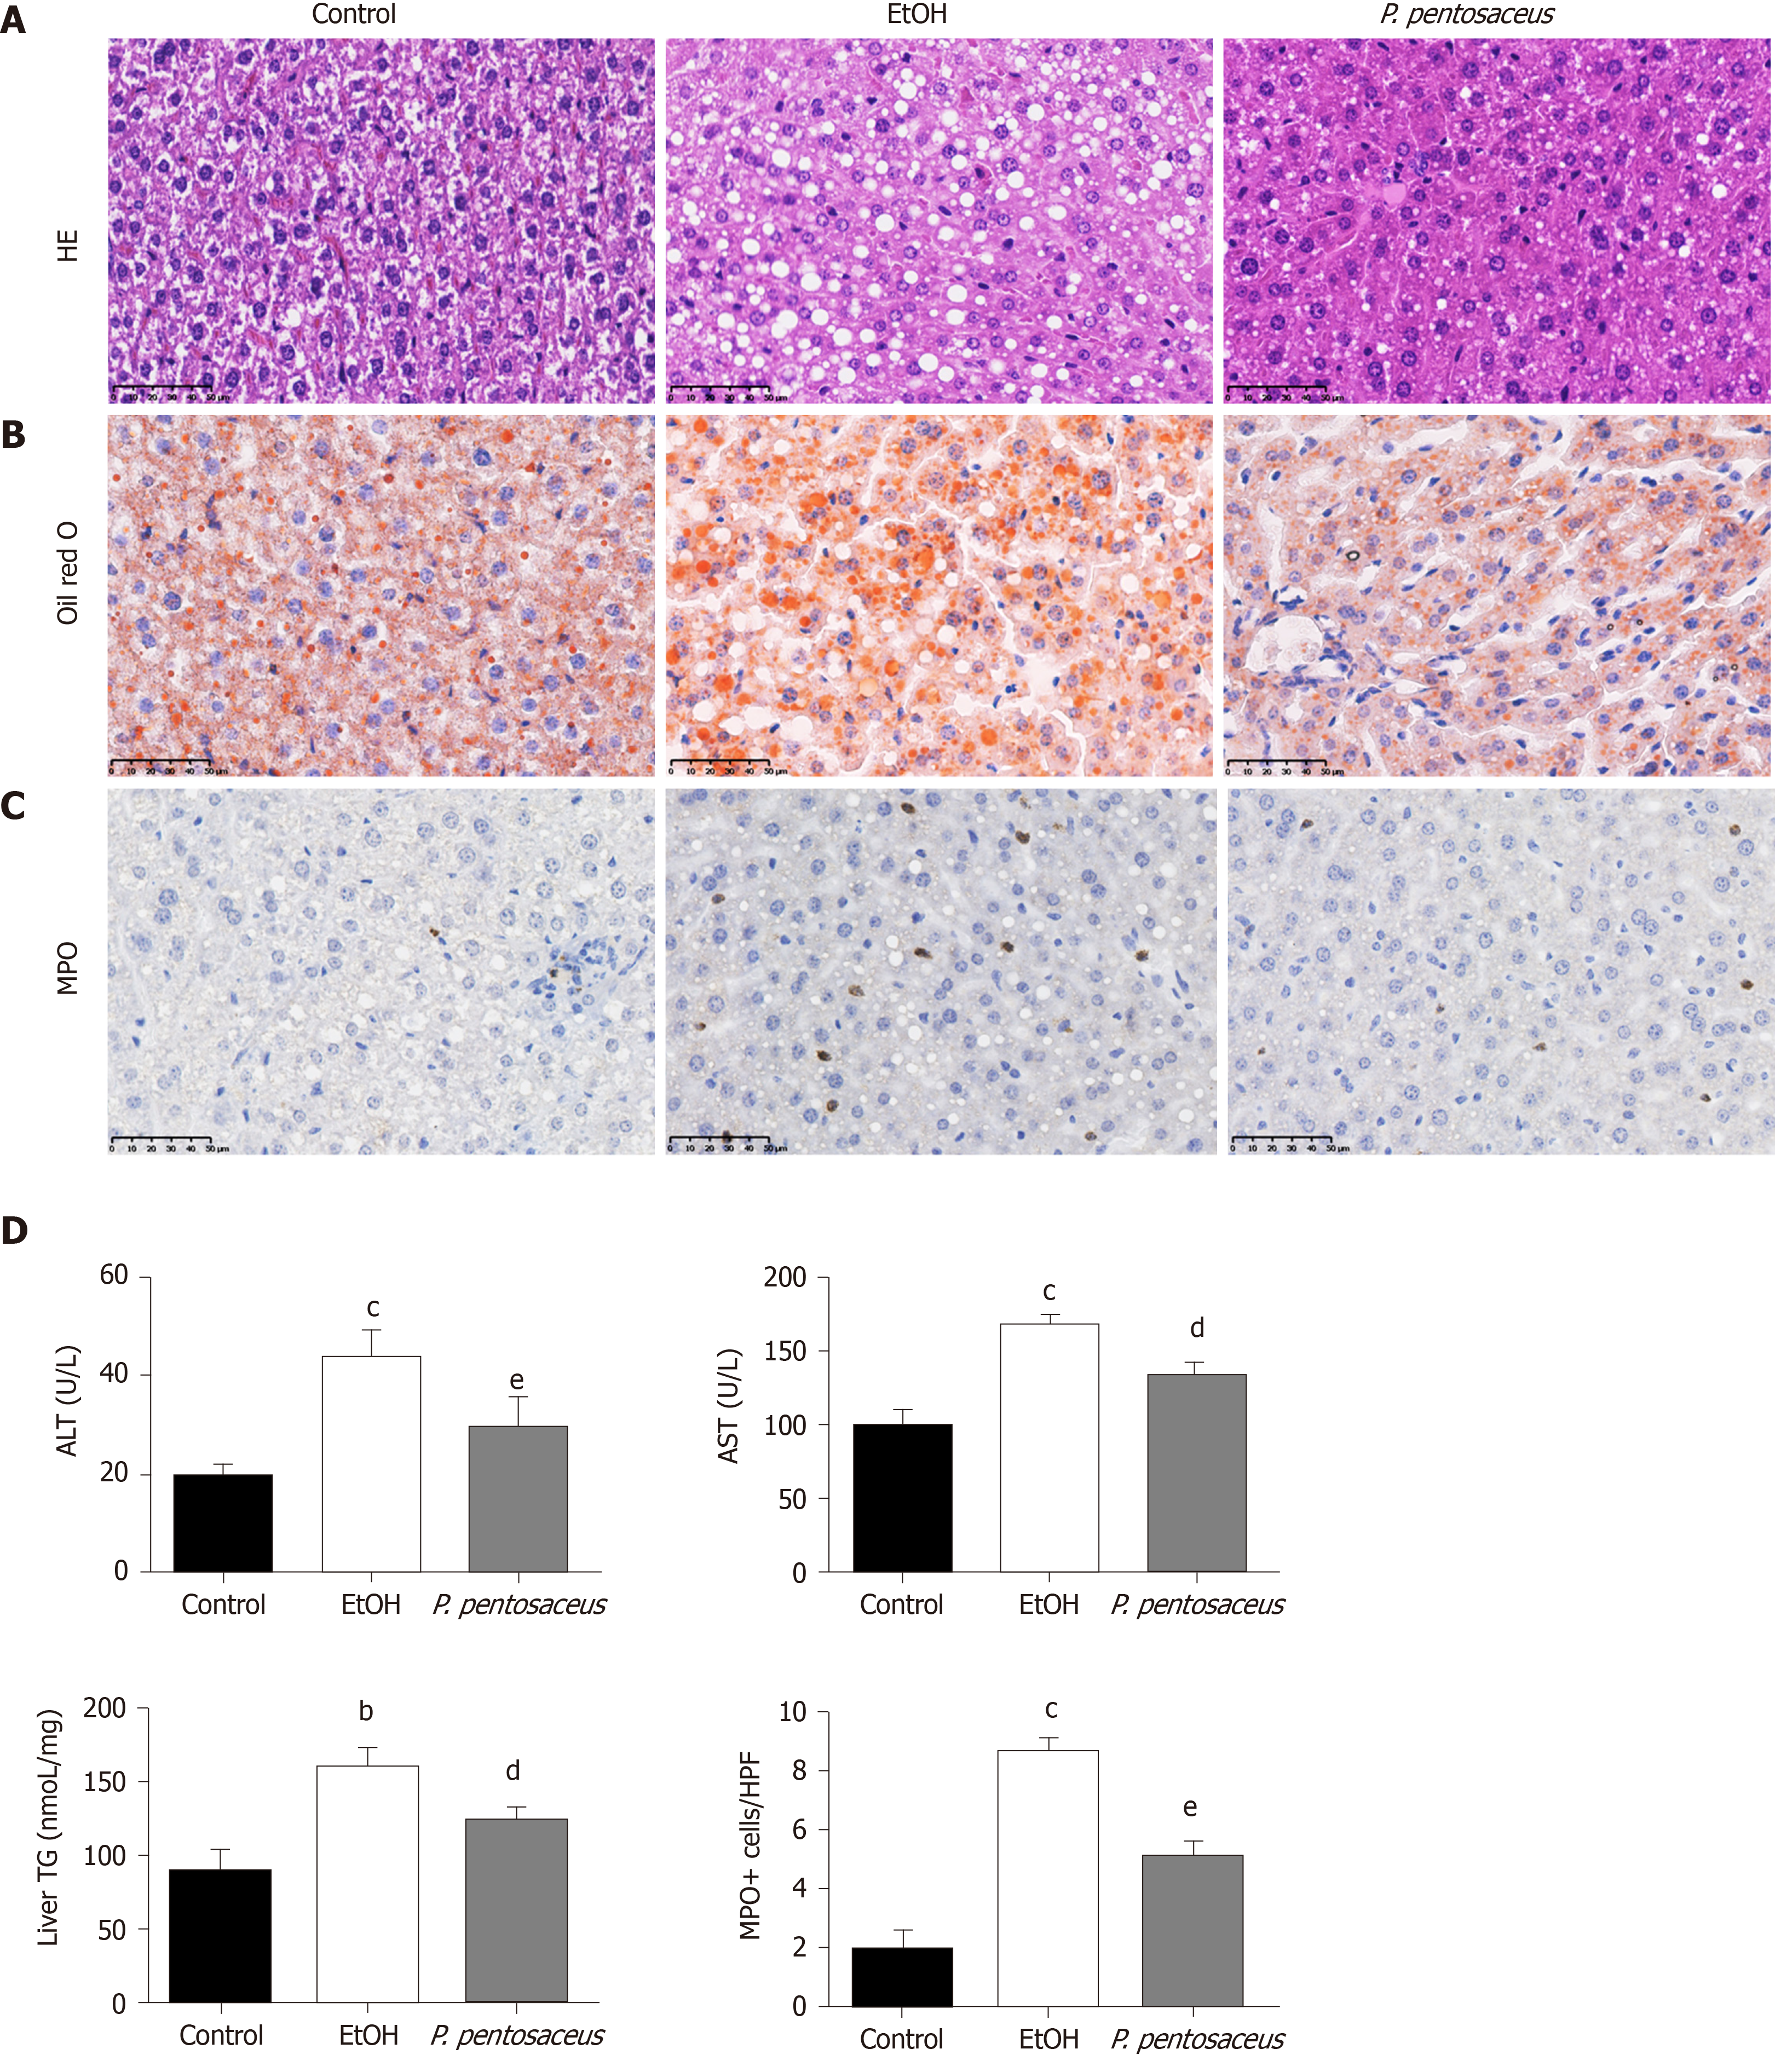
Figure 1 The hepatic histopathological examination and liver inflammation and steatosis parameters.
A: Representative histological images of the liver stained with HE. Scale bar: 50 μm; B: Representative images of oil red O-stained liver sections. Scale bar: 50 μm; C: Immunohistochemical staining for myeloperoxidase. Scale bar: 50 μm; D: Quantification of triglyceride and myeloperoxidase-positive cells in the liver and alanine aminotransferase and aspartate transaminase levels. All data are presented as means ± SE. bP < 0.01, cP < 0.001 vs the Control group. dP < 0.05, eP < 0.01 vs the EtOH group. P. pentosaceus: Pediococcus pentosaceus; HE: Hematoxylin and eosin; MPO: Myeloperoxidase; ALT: Alanine aminotransferase; AST: Aspartate transaminase; TG: Triglyceride.
- Citation: Jiang XW, Li YT, Ye JZ, Lv LX, Yang LY, Bian XY, Wu WR, Wu JJ, Shi D, Wang Q, Fang DQ, Wang KC, Wang QQ, Lu YM, Xie JJ, Li LJ. New strain of Pediococcus pentosaceus alleviates ethanol-induced liver injury by modulating the gut microbiota and short-chain fatty acid metabolism. World J Gastroenterol 2020; 26(40): 6224-6240
- URL: https://www.wjgnet.com/1007-9327/full/v26/i40/6224.htm
- DOI: https://dx.doi.org/10.3748/wjg.v26.i40.6224


