Copyright
©The Author(s) 2020.
World J Gastroenterol. Sep 7, 2020; 26(33): 5008-5021
Published online Sep 7, 2020. doi: 10.3748/wjg.v26.i33.5008
Published online Sep 7, 2020. doi: 10.3748/wjg.v26.i33.5008
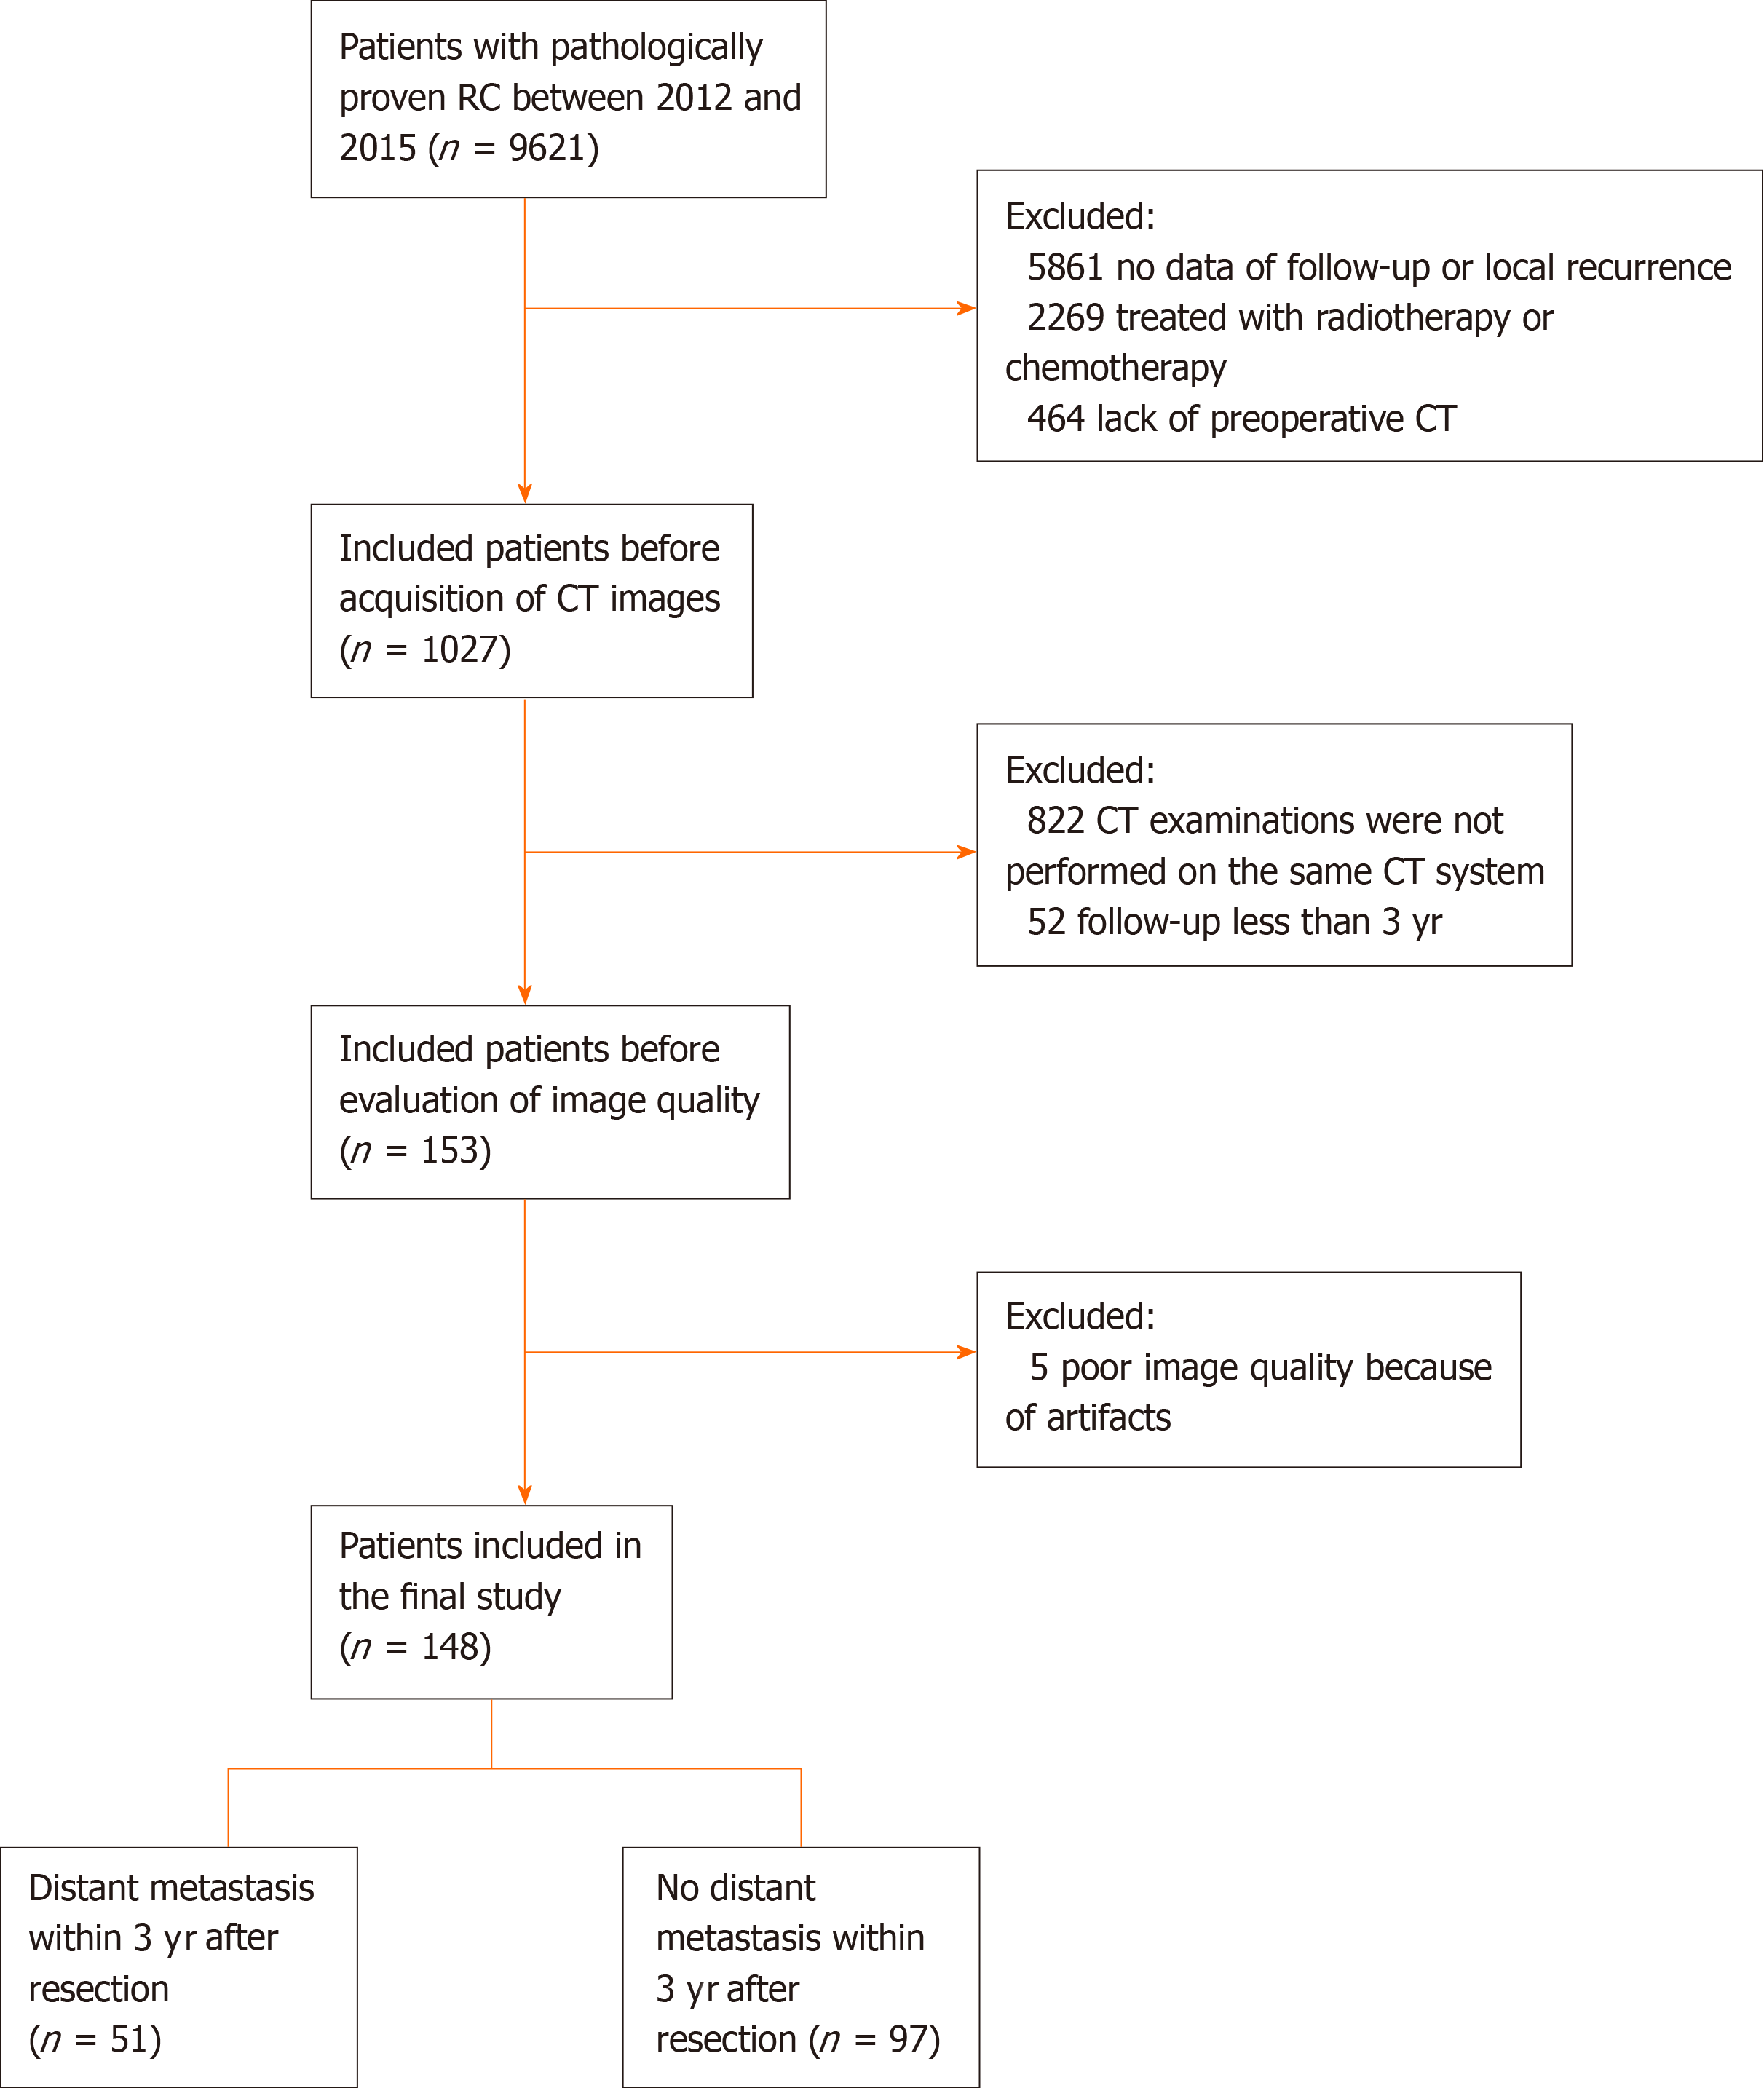
Figure 1 Flow chart of the recruitment pathway for patients included in the study.
CT: Computed tomography.
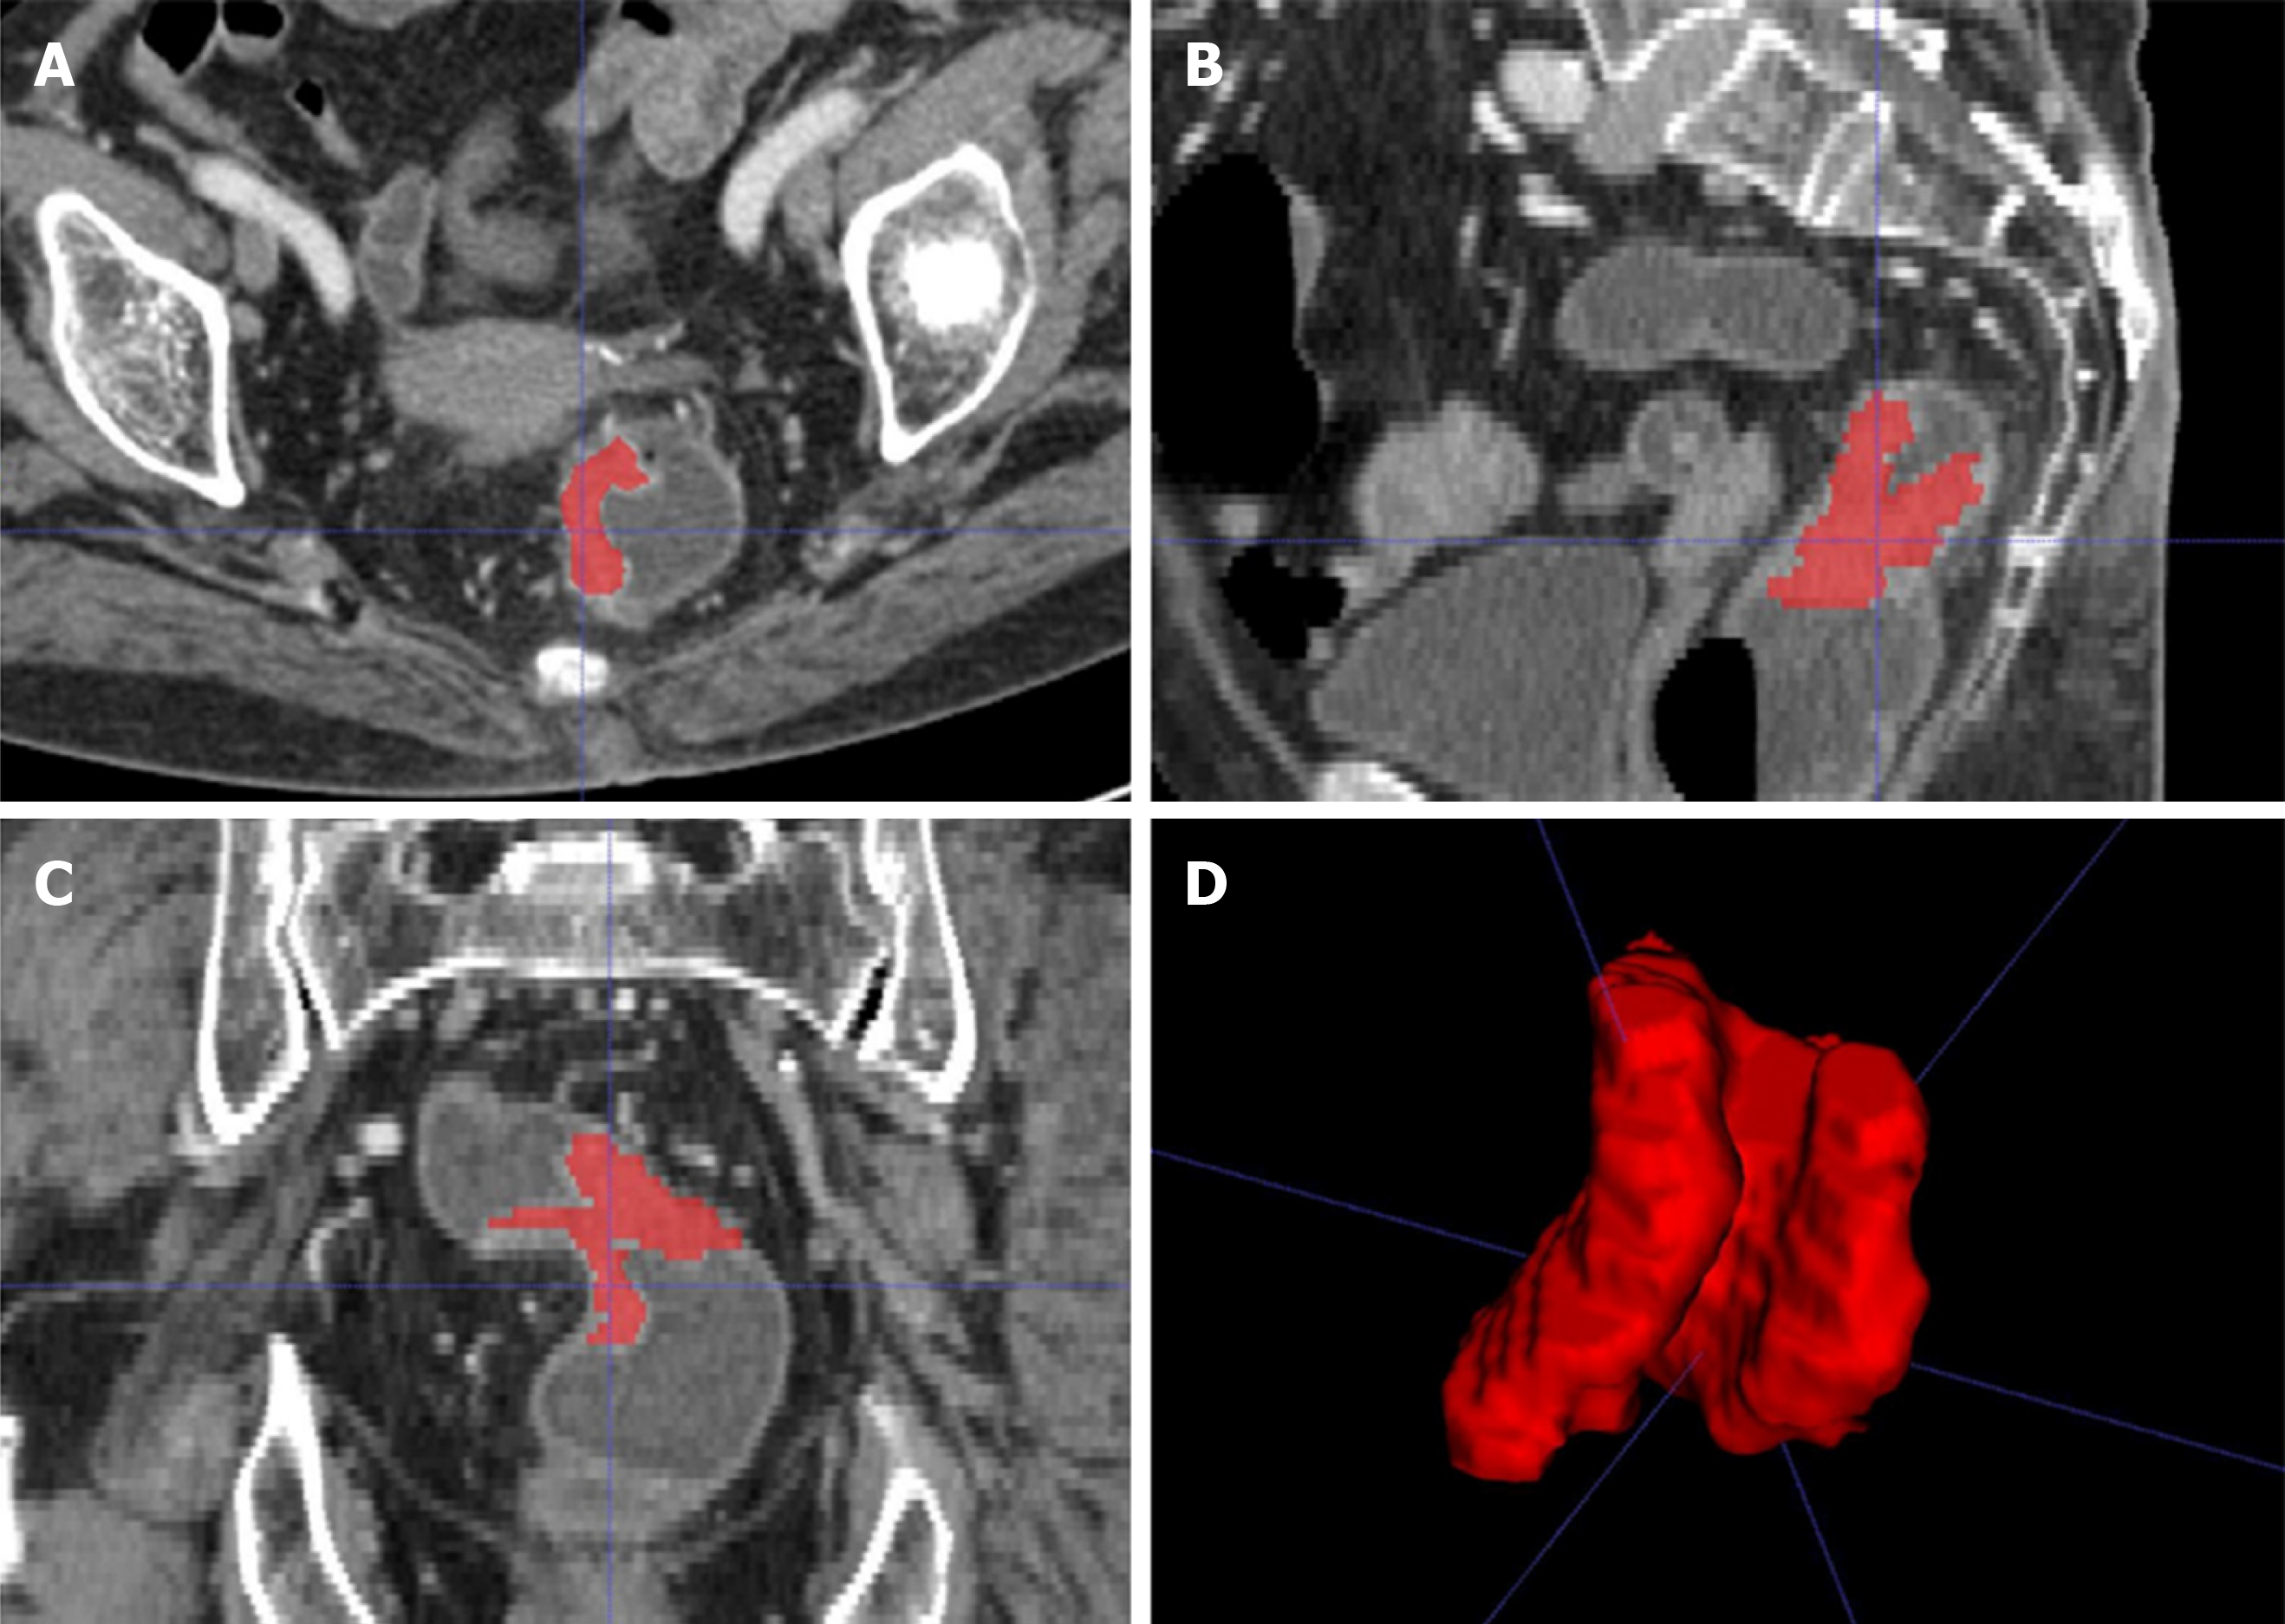
Figure 2 A 58-year-old woman with rectal cancer.
A-C: Representative manual segmentation of the whole lesion in the axial, sagittal, and coronal enhanced computed tomography images. Red lines represent the delineations of the regions of interest used to derive the radiomic features; D: Three-dimensional volumetric reconstruction of the segmented lesion.
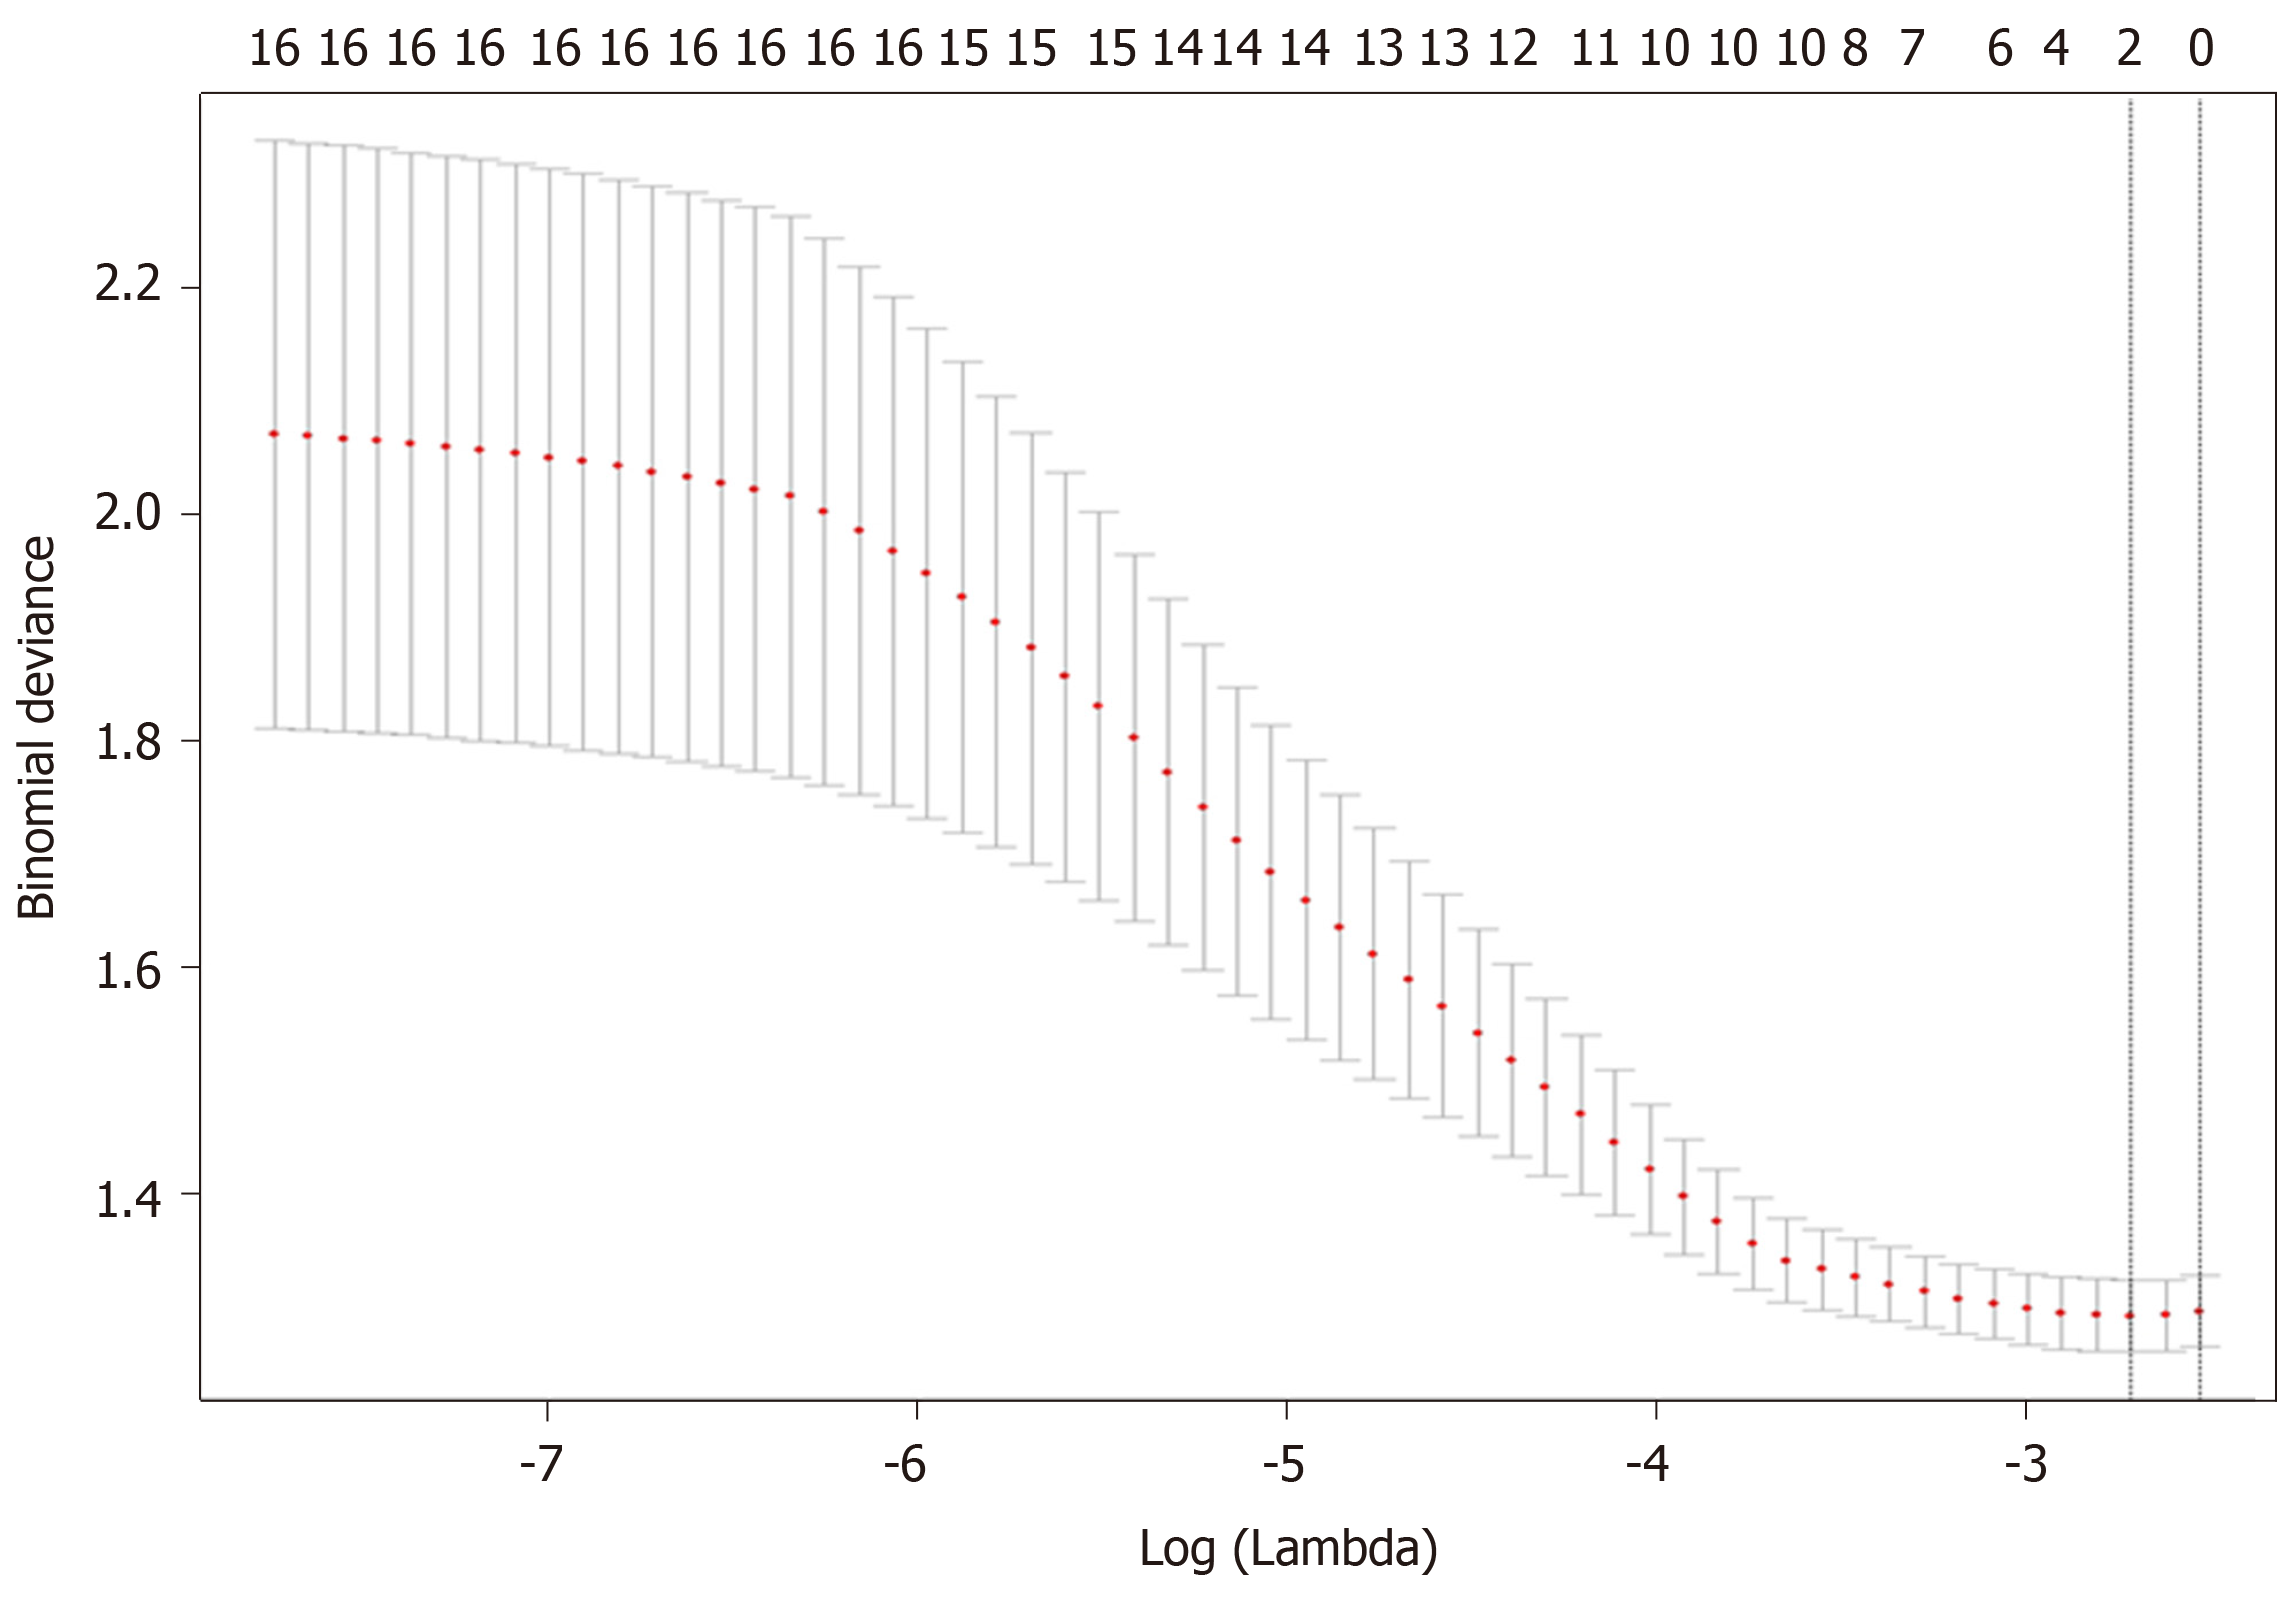
Figure 3 Feature selection using the least absolute shrinkage and selection operator regression model.
Dotted vertical lines were drawn at the optimal values (two features were selected) by using the minimum criteria and one standard error of the minimum criteria (i.e., the 1-SE criteria).
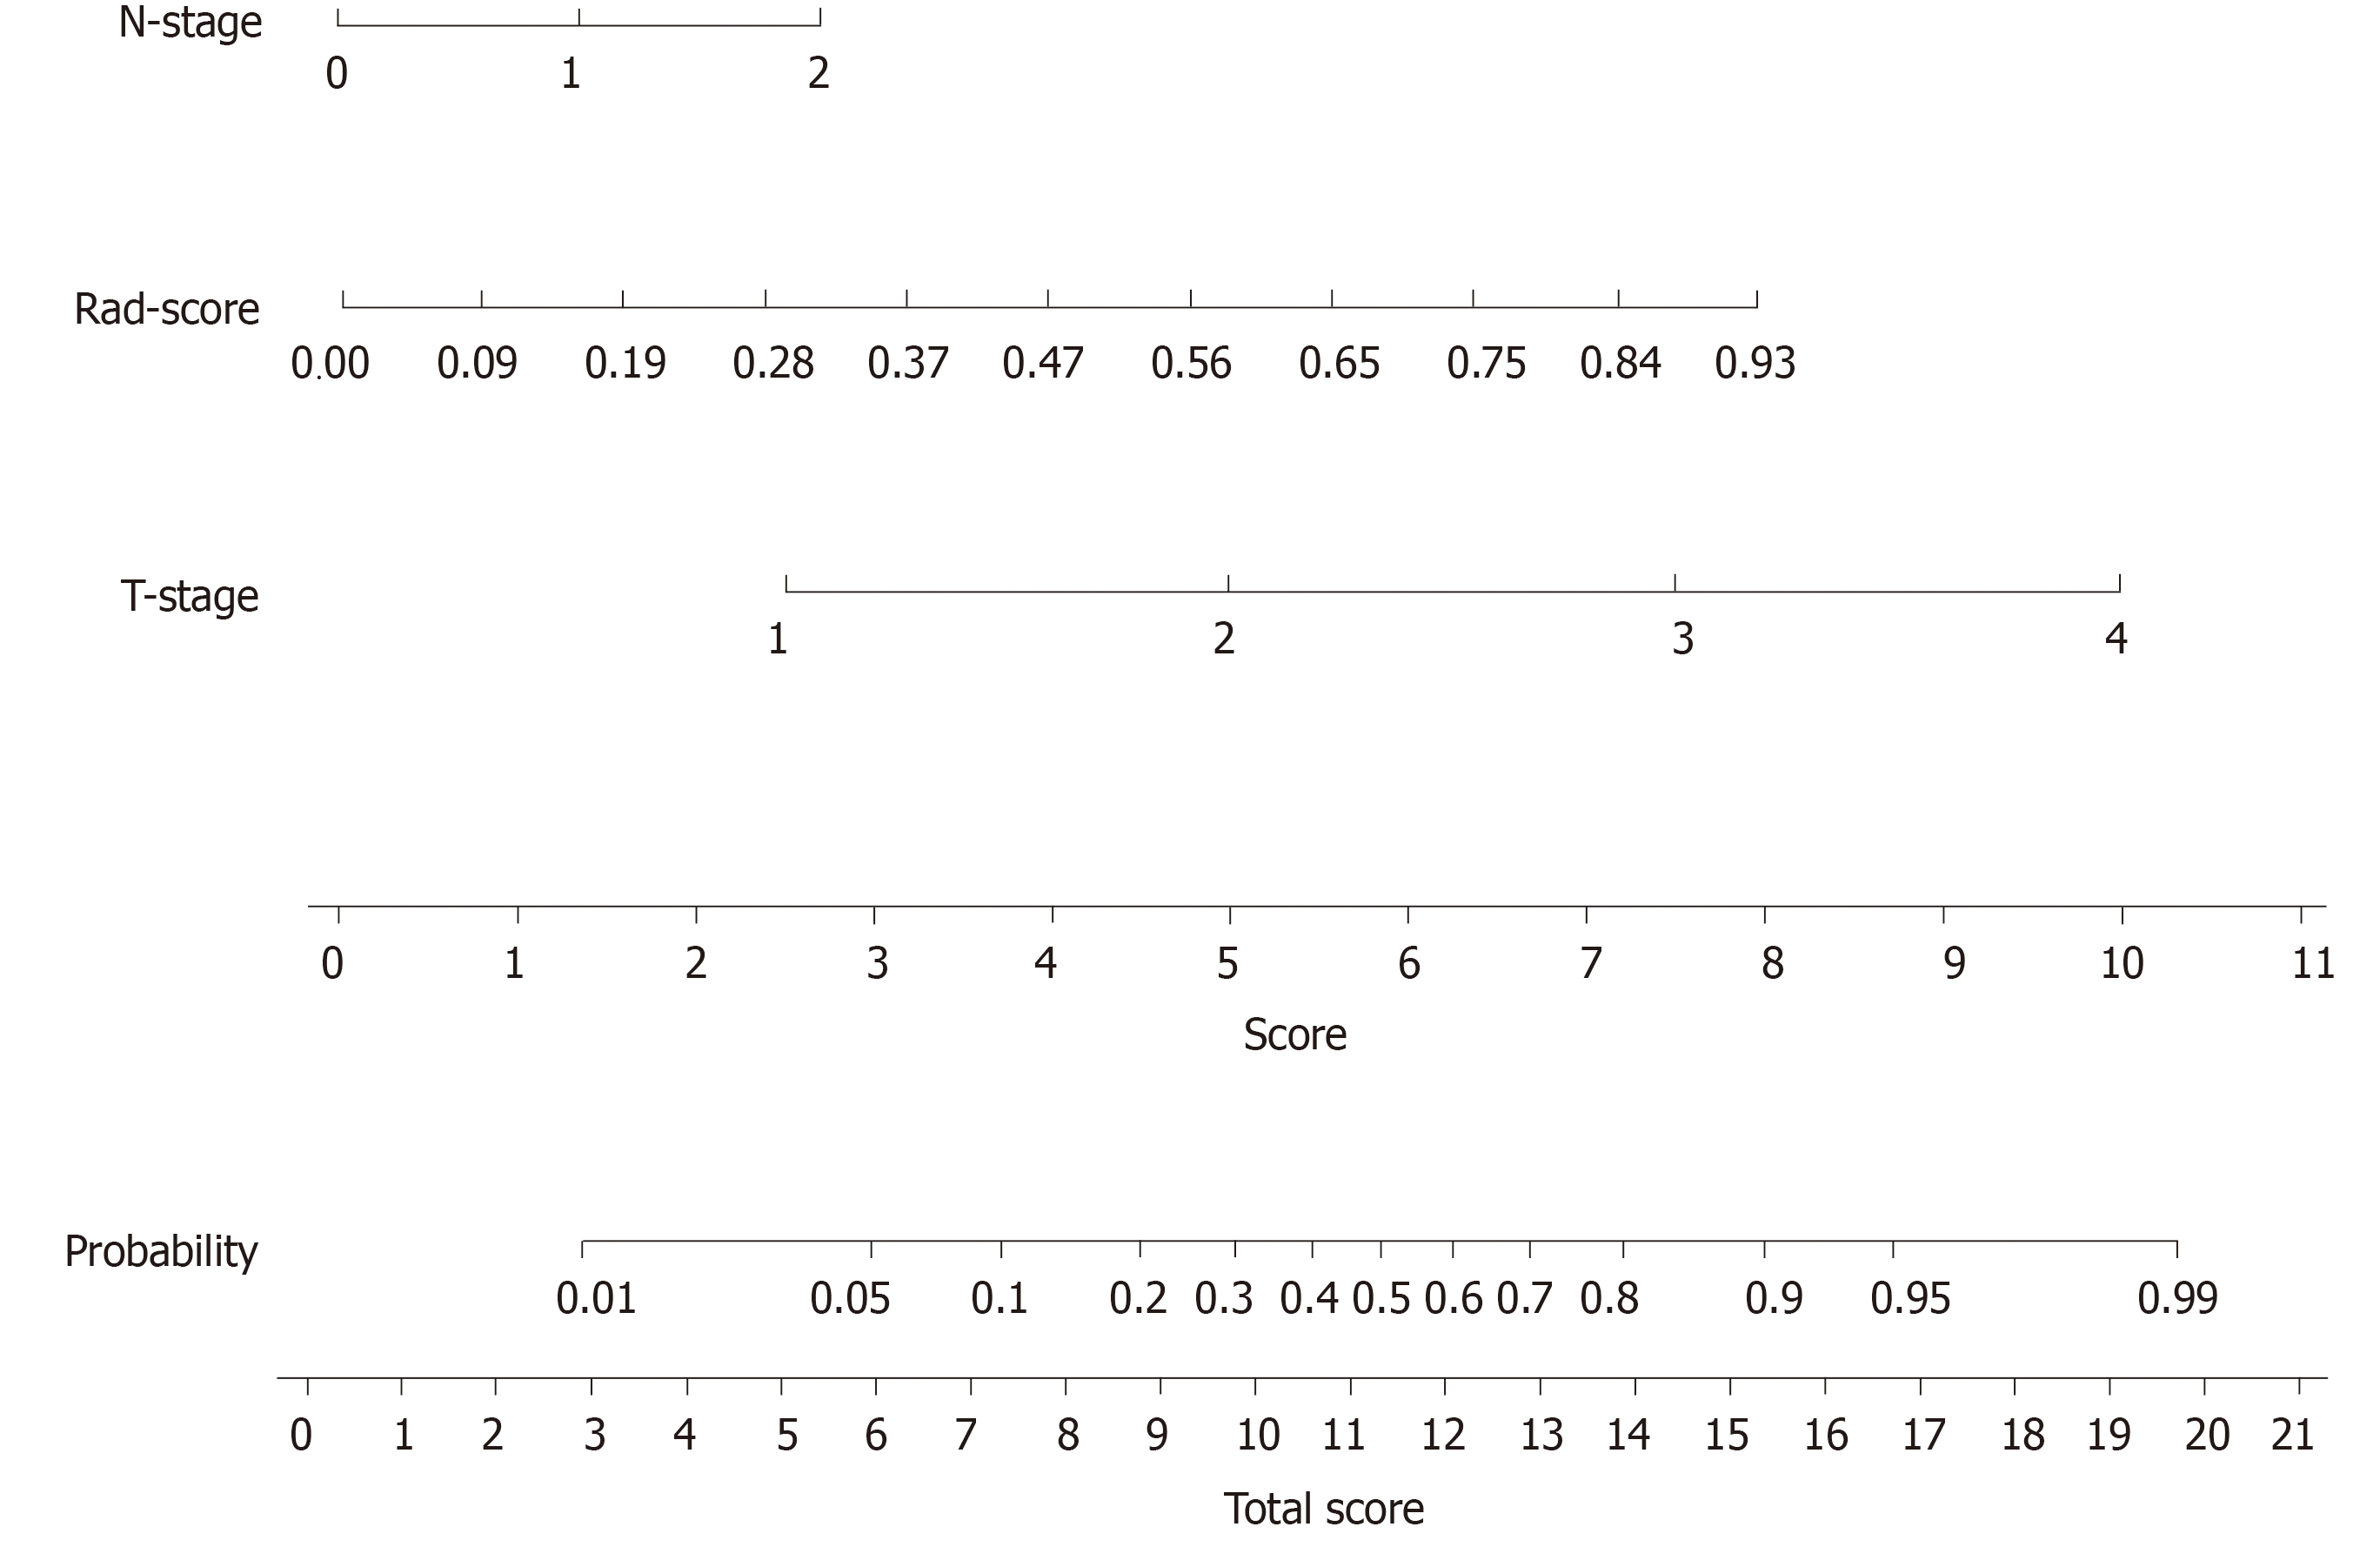
Figure 4 Developed radiomics nomogram.
The radiomics nomogram was developed in the training cohort, with the Rad-score, T-stage, and N-stage incorporated.
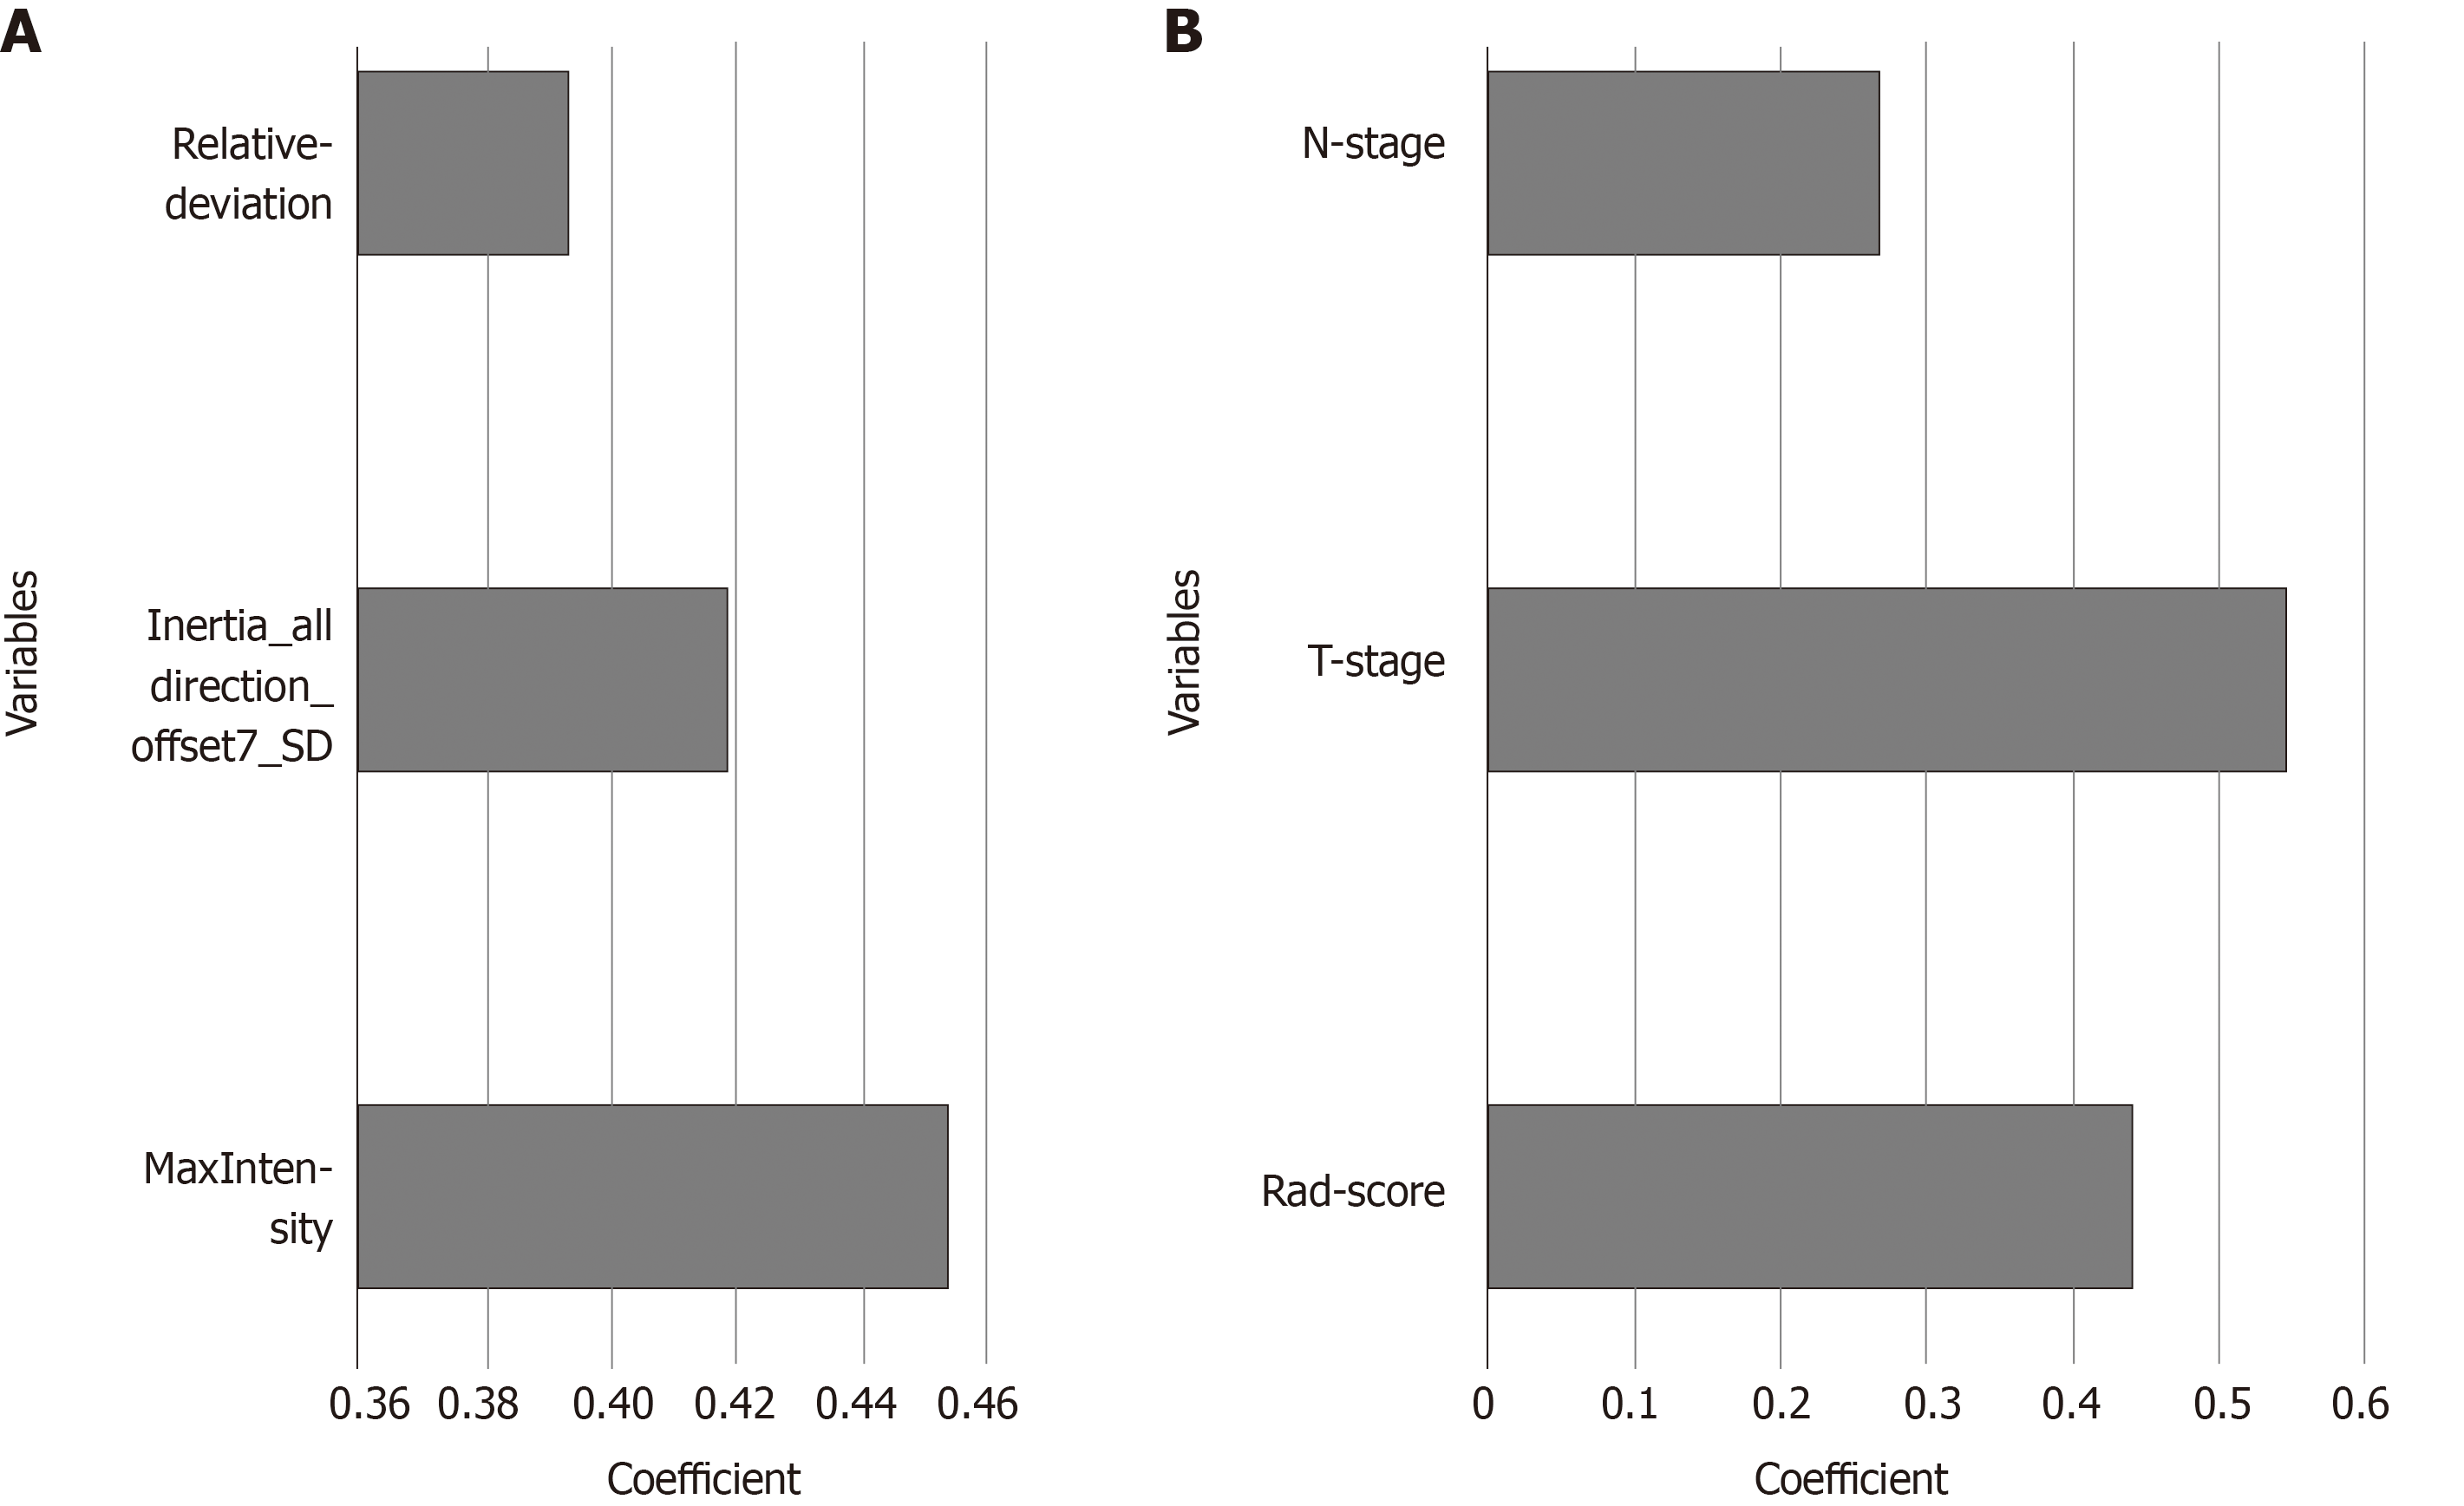
Figure 5 Histogram showing the contribution of each variable to the models.
A: the Rad-score; B: the combined model. The contributions of the variables were measured by the values of the standardized logistic regression coefficients.
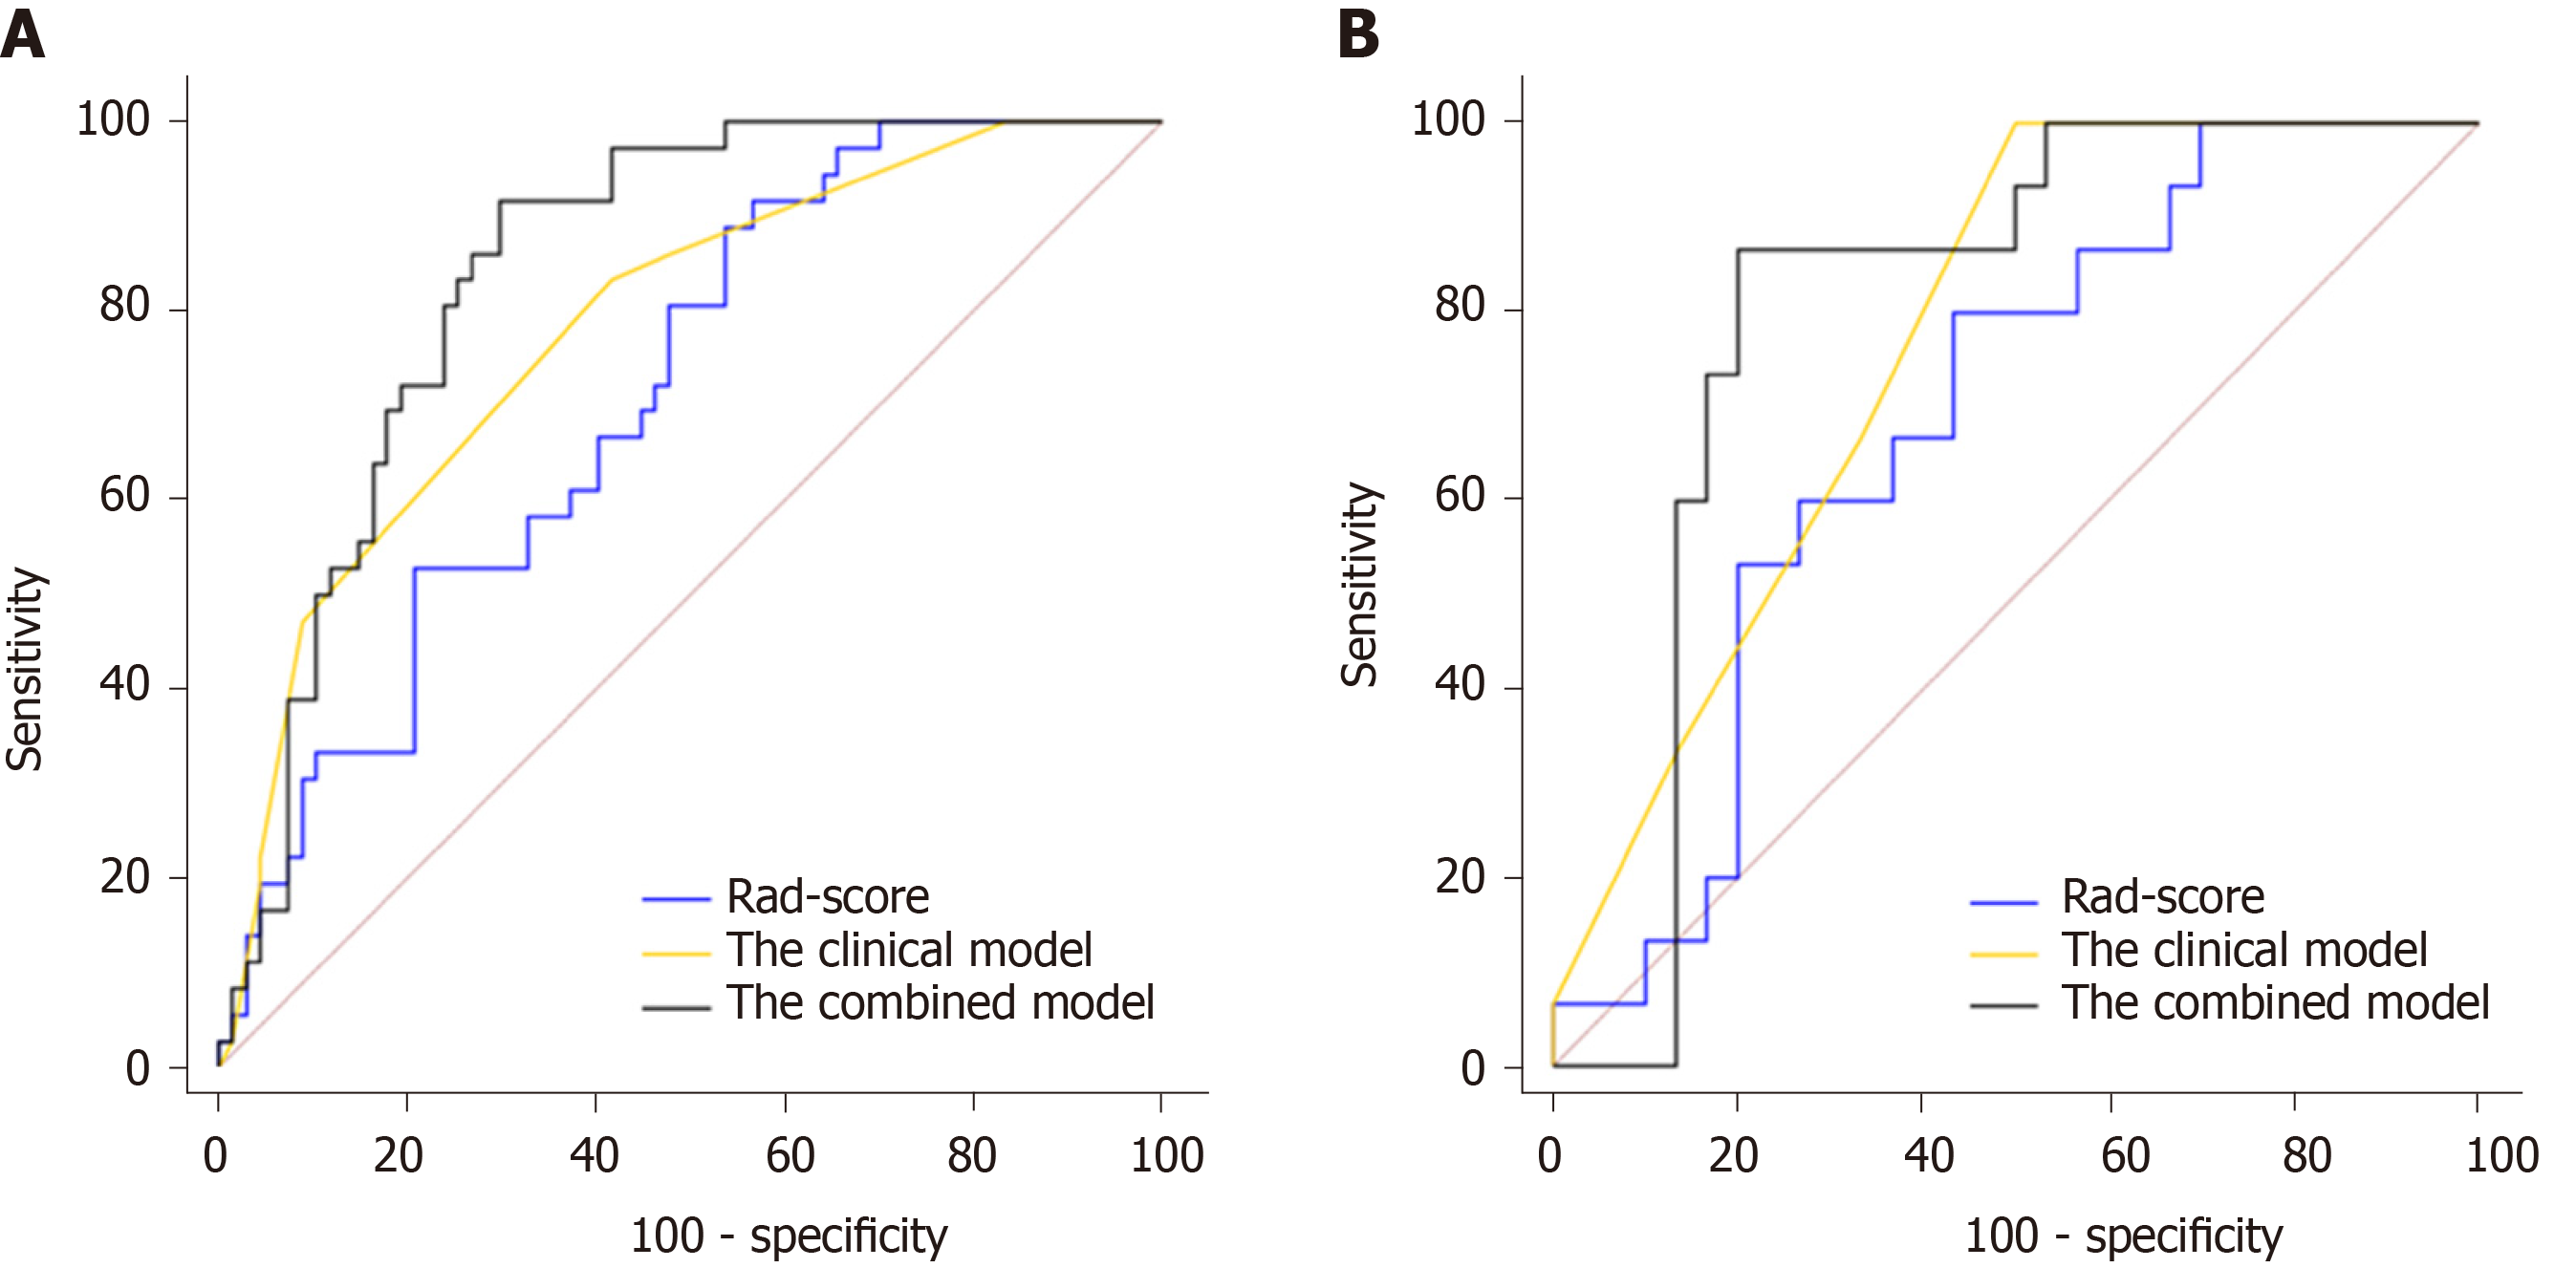
Figure 6 Receiver operating characteristic curves of the models in the training and validation cohorts.
A: In the training set, the combined model [area under the curve under the curve (AUC) = 0.842] achieved a better performance than the Rad-score (AUC = 0.709) and the clinical model containing T-stage and N-stage (AUC = 0.782); B: In the validation set, the AUCs of the Rad-score, the clinical model, and the combined model were 0.687, 0.766, and 0.802, respectively.
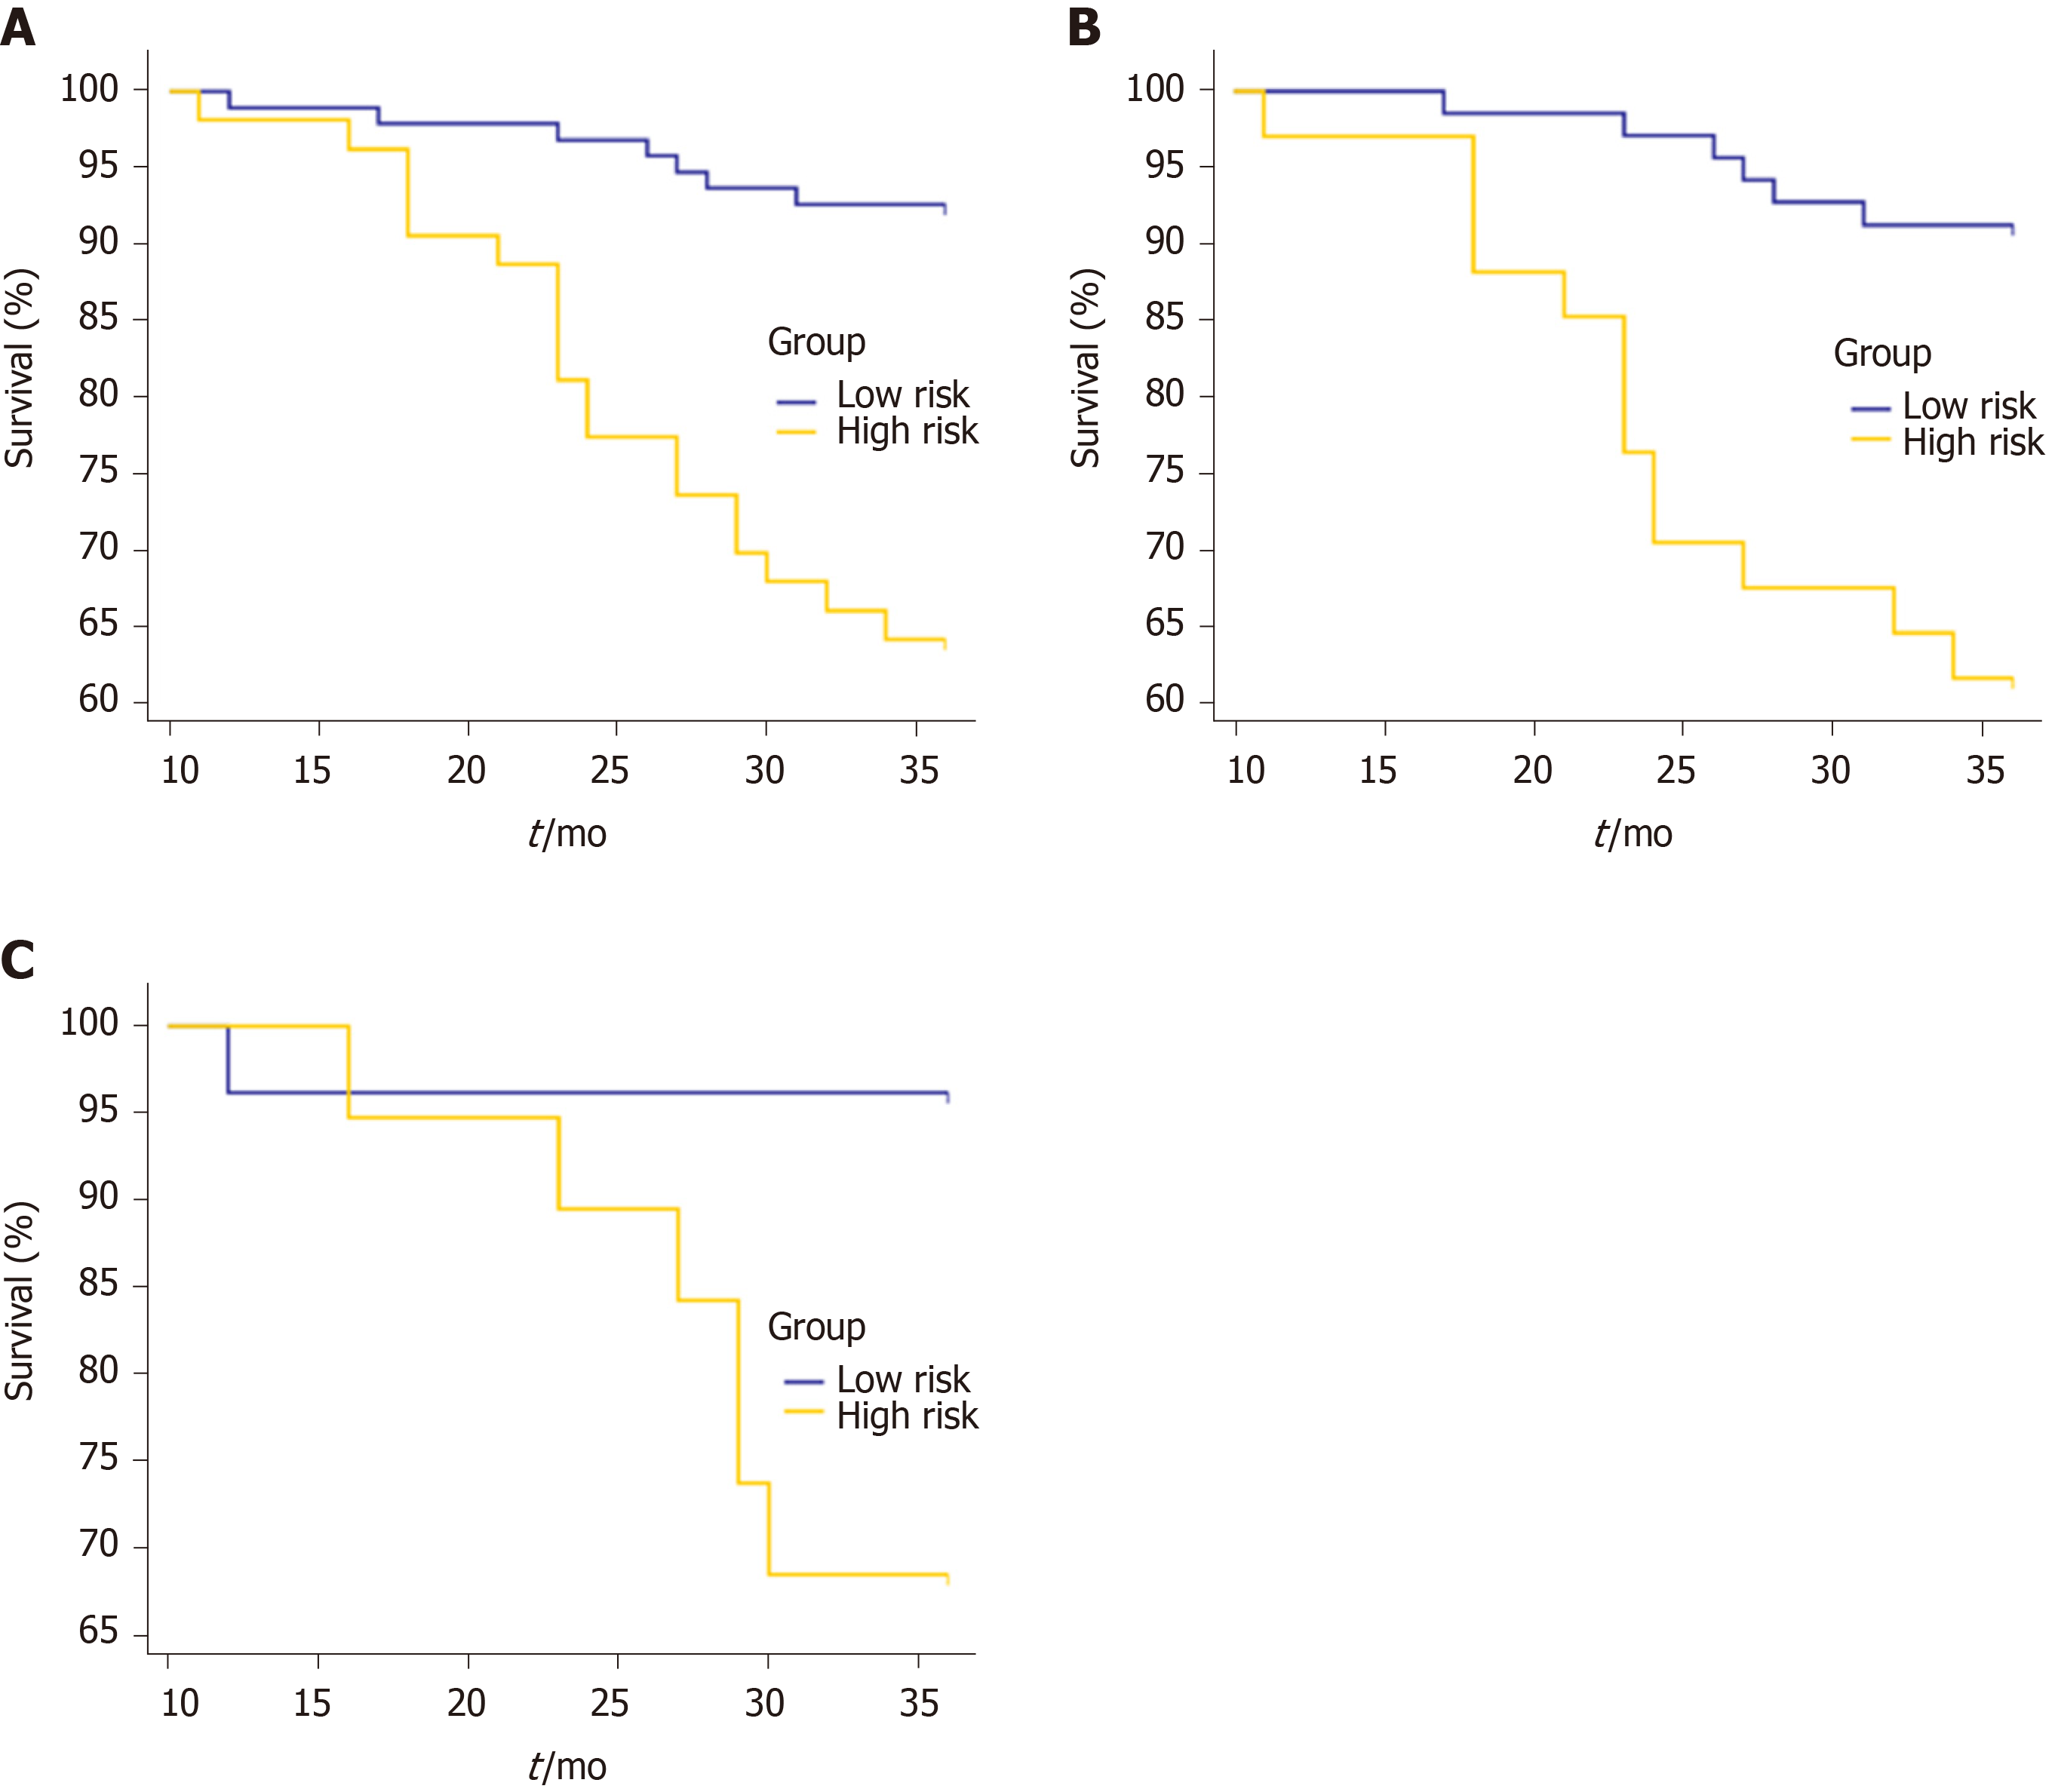
Figure 7 Kaplan-Meier curves for overall survival stratified by risk group, as identified by the combined model.
A: The whole set. P < 0.0001; B: The training set. P = 0.0001; C: The validation set. P = 0.0137.
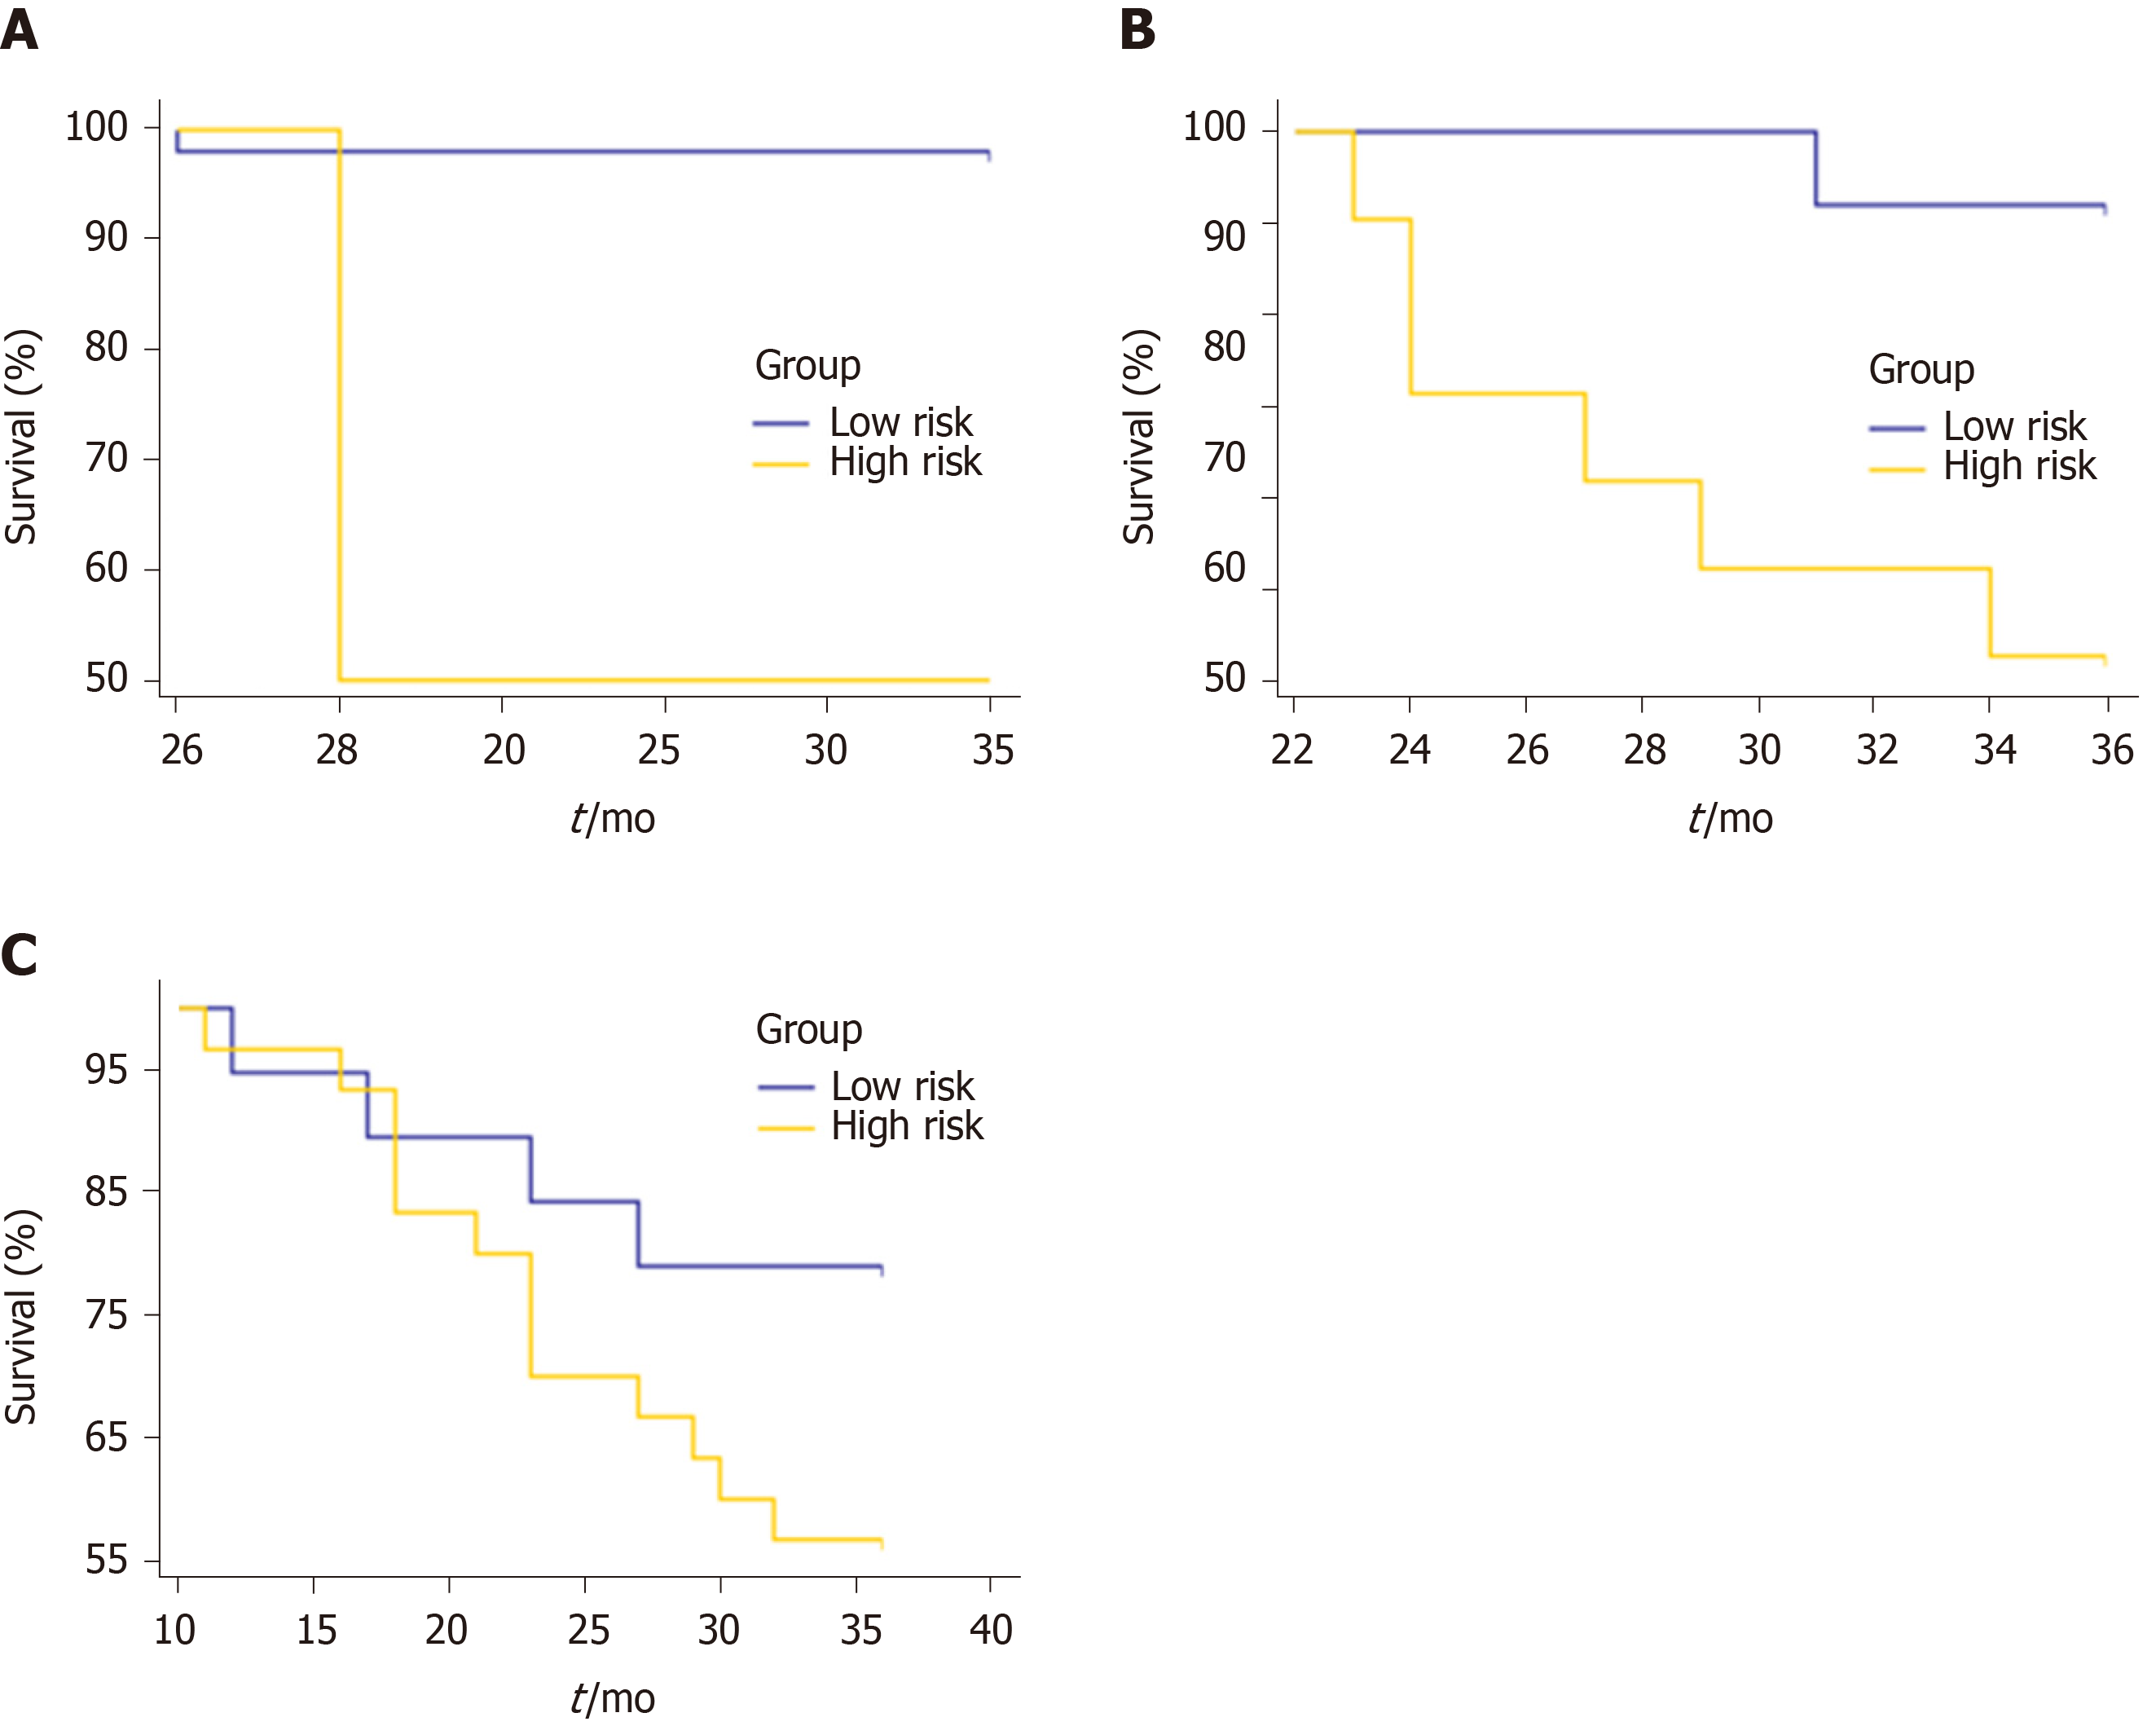
Figure 8 Overall survival curves for the low- and high-risk groups classified according to the combined model in the subgroups of the overall pathological stage.
A: Stage I. P < 0.001; B: Stage II. P = 0.0194; C: Stage III. P = 0.1401.
- Citation: Li M, Zhu YZ, Zhang YC, Yue YF, Yu HP, Song B. Radiomics of rectal cancer for predicting distant metastasis and overall survival. World J Gastroenterol 2020; 26(33): 5008-5021
- URL: https://www.wjgnet.com/1007-9327/full/v26/i33/5008.htm
- DOI: https://dx.doi.org/10.3748/wjg.v26.i33.5008


