Copyright
©The Author(s) 2020.
World J Gastroenterol. Sep 7, 2020; 26(33): 5008-5021
Published online Sep 7, 2020. doi: 10.3748/wjg.v26.i33.5008
Published online Sep 7, 2020. doi: 10.3748/wjg.v26.i33.5008
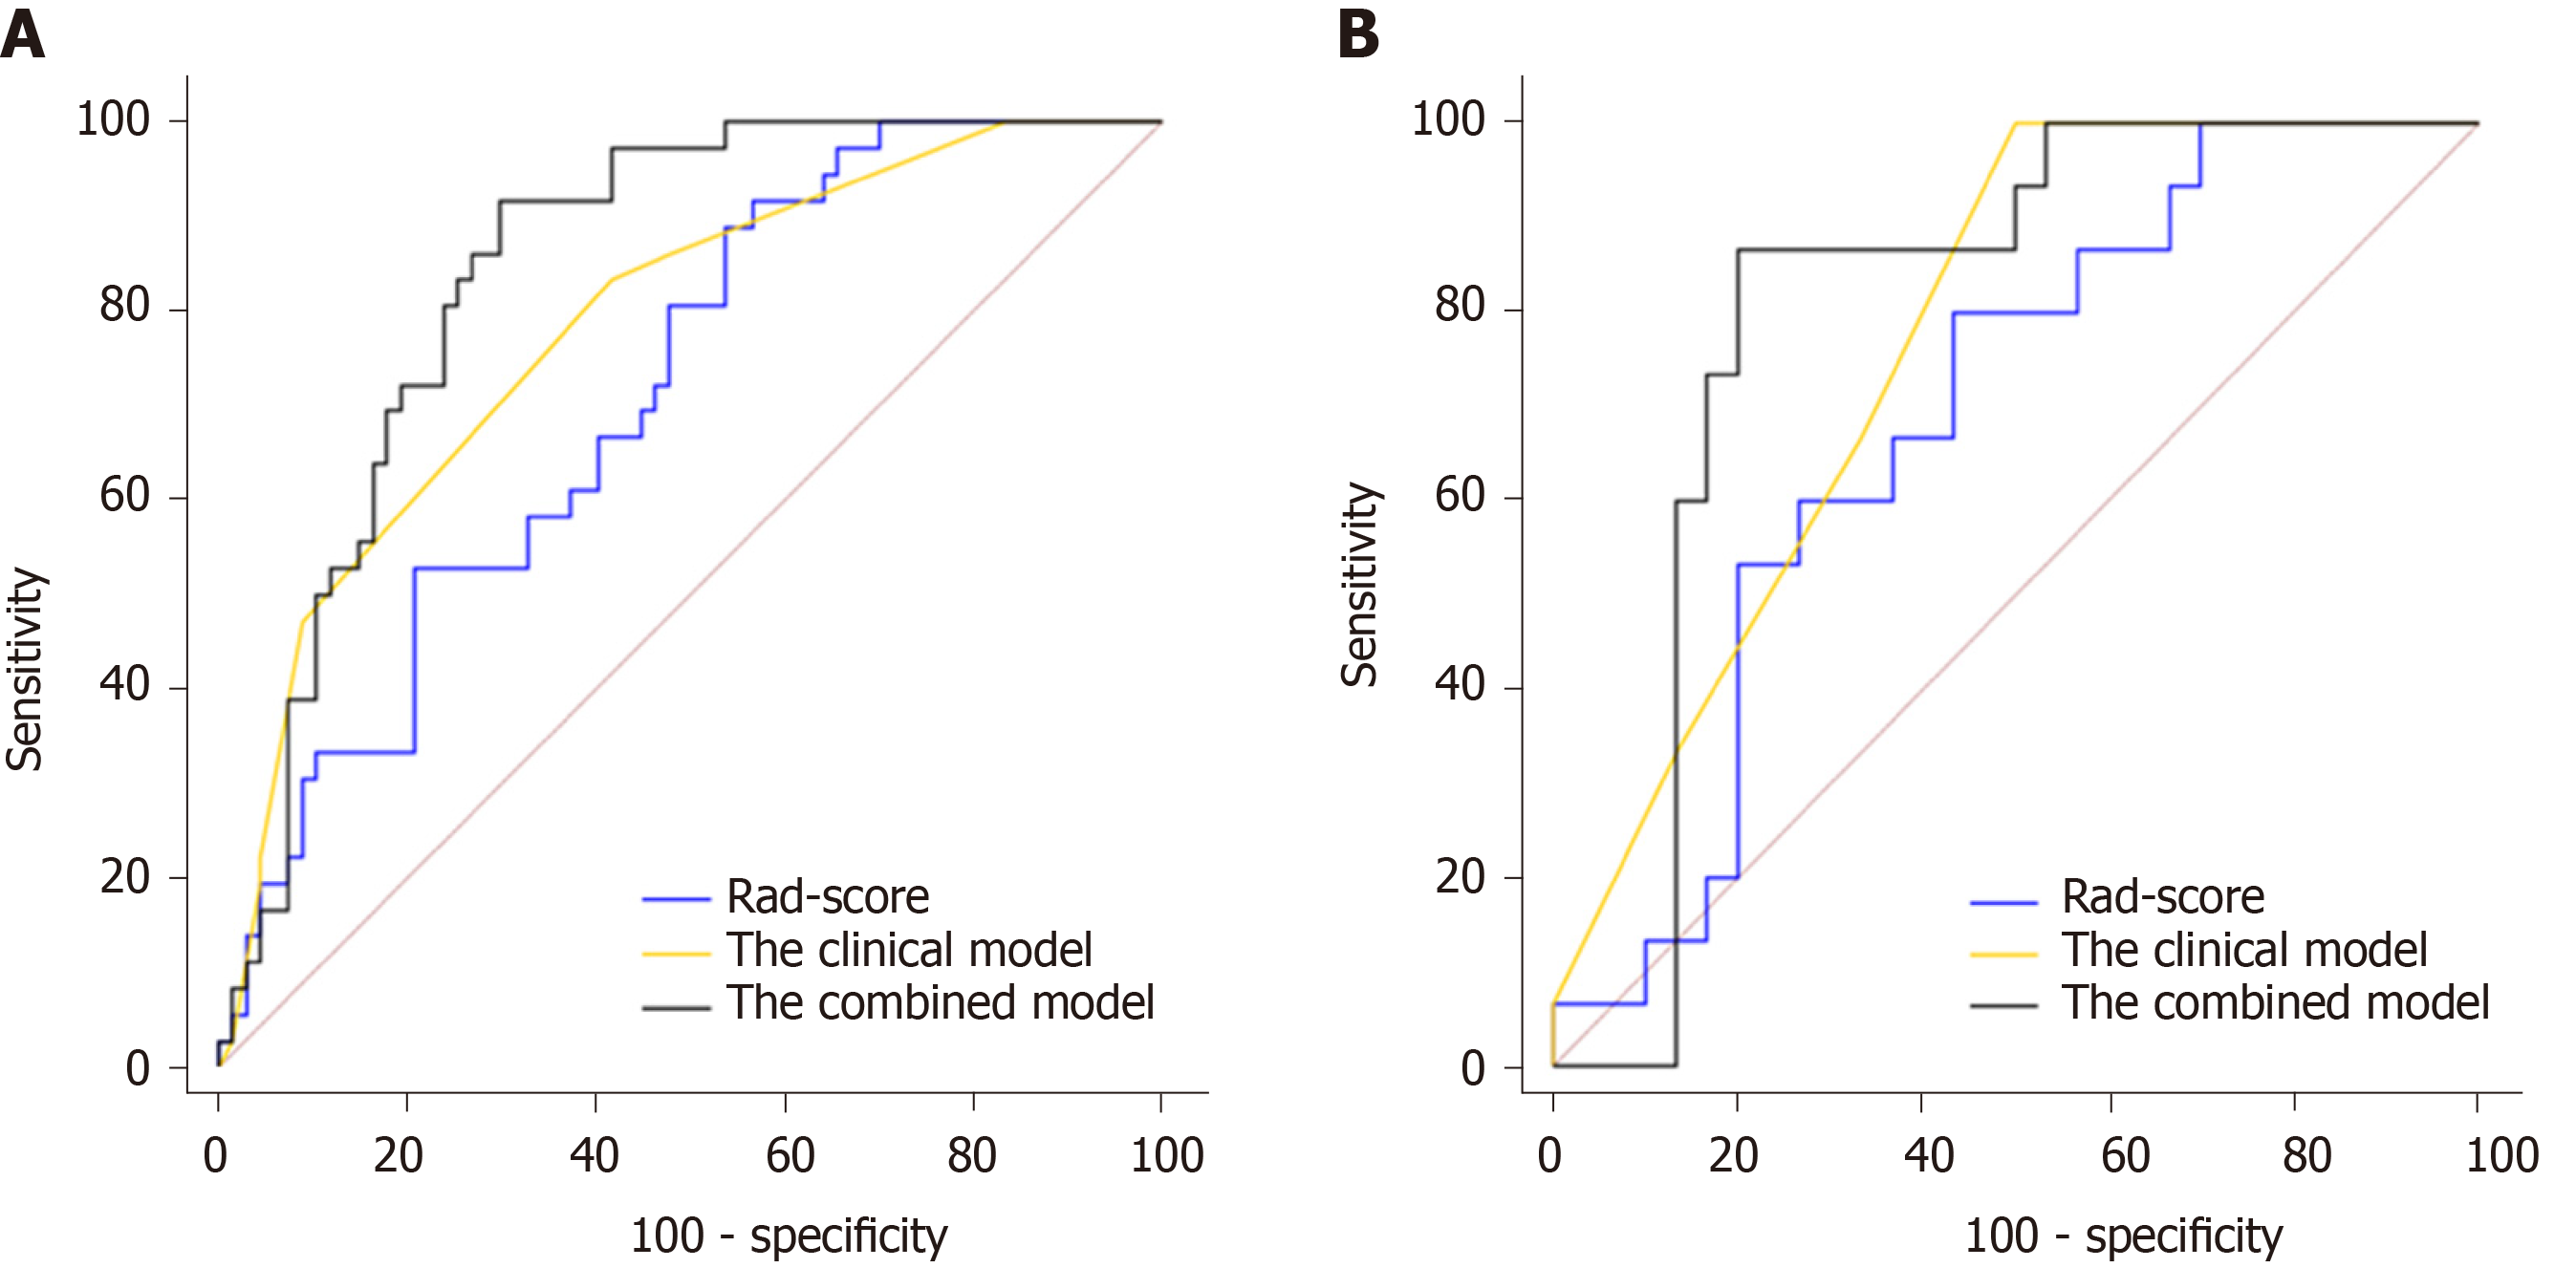
Figure 6 Receiver operating characteristic curves of the models in the training and validation cohorts.
A: In the training set, the combined model [area under the curve under the curve (AUC) = 0.842] achieved a better performance than the Rad-score (AUC = 0.709) and the clinical model containing T-stage and N-stage (AUC = 0.782); B: In the validation set, the AUCs of the Rad-score, the clinical model, and the combined model were 0.687, 0.766, and 0.802, respectively.
- Citation: Li M, Zhu YZ, Zhang YC, Yue YF, Yu HP, Song B. Radiomics of rectal cancer for predicting distant metastasis and overall survival. World J Gastroenterol 2020; 26(33): 5008-5021
- URL: https://www.wjgnet.com/1007-9327/full/v26/i33/5008.htm
- DOI: https://dx.doi.org/10.3748/wjg.v26.i33.5008


