Copyright
©The Author(s) 2020.
World J Gastroenterol. May 28, 2020; 26(20): 2570-2583
Published online May 28, 2020. doi: 10.3748/wjg.v26.i20.2570
Published online May 28, 2020. doi: 10.3748/wjg.v26.i20.2570
Figure 1 NanoSight measurements of isolated vesicles from matched serum and plasma samples.
A: The overall size distribution of particles (SEM indicated by shaded areas) was similar between the matched serum (n = 10) and plasma samples (n = 10); B: Pairwise comparison of the average concentration (± SEM) of particles demonstrated higher particle yields in serum (Wilcoxon signed-rank test, aP = 0.047).
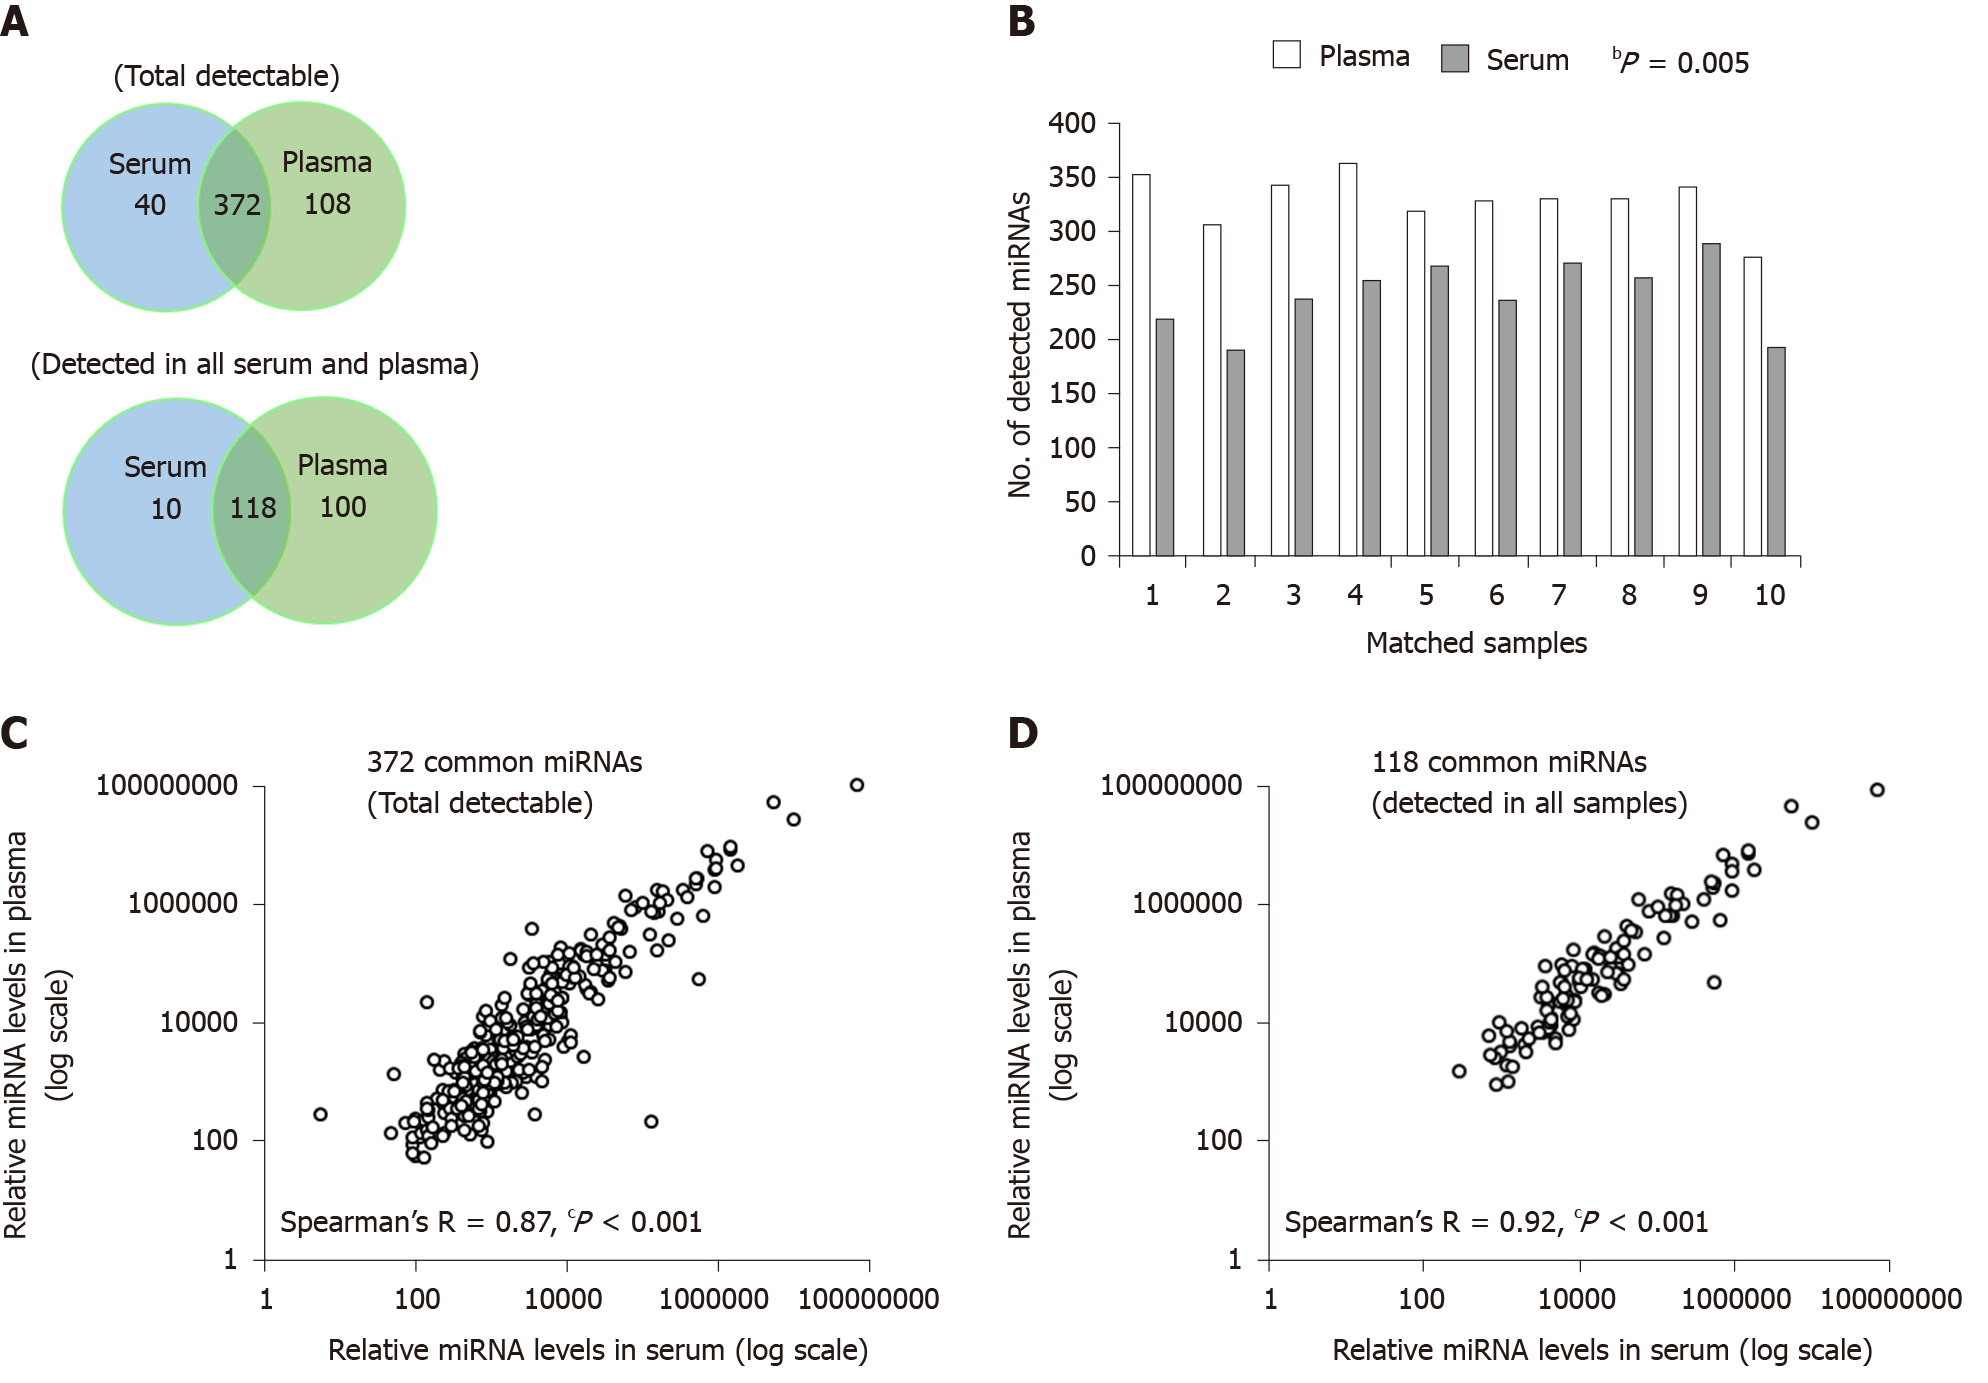
Figure 2 Comparison of the microRNA content between serum and plasma small extracellular vesicles.
A: The number of total detectable microRNA (miRNAs) (top Venn diagram), and the number of miRNAs detected in all serum or plasma samples (bottom Venn diagram), were higher in plasma; B: Pairwise comparison of the number of total detectable miRNAs was significantly higher in the plasma (Wilcoxon signed-rank test, bP = 0.005); C: Correlation of the average relative expression of the 372 common total detectable miRNAs (Spearman’s R = 0.87, cP < 0.001); D: Correlation of the average relative expression of the 118 common miRNAs detected in all serum or plasma samples (Spearman’s R = 0.92, cP < 0.001). miRNA: MicroRNA.
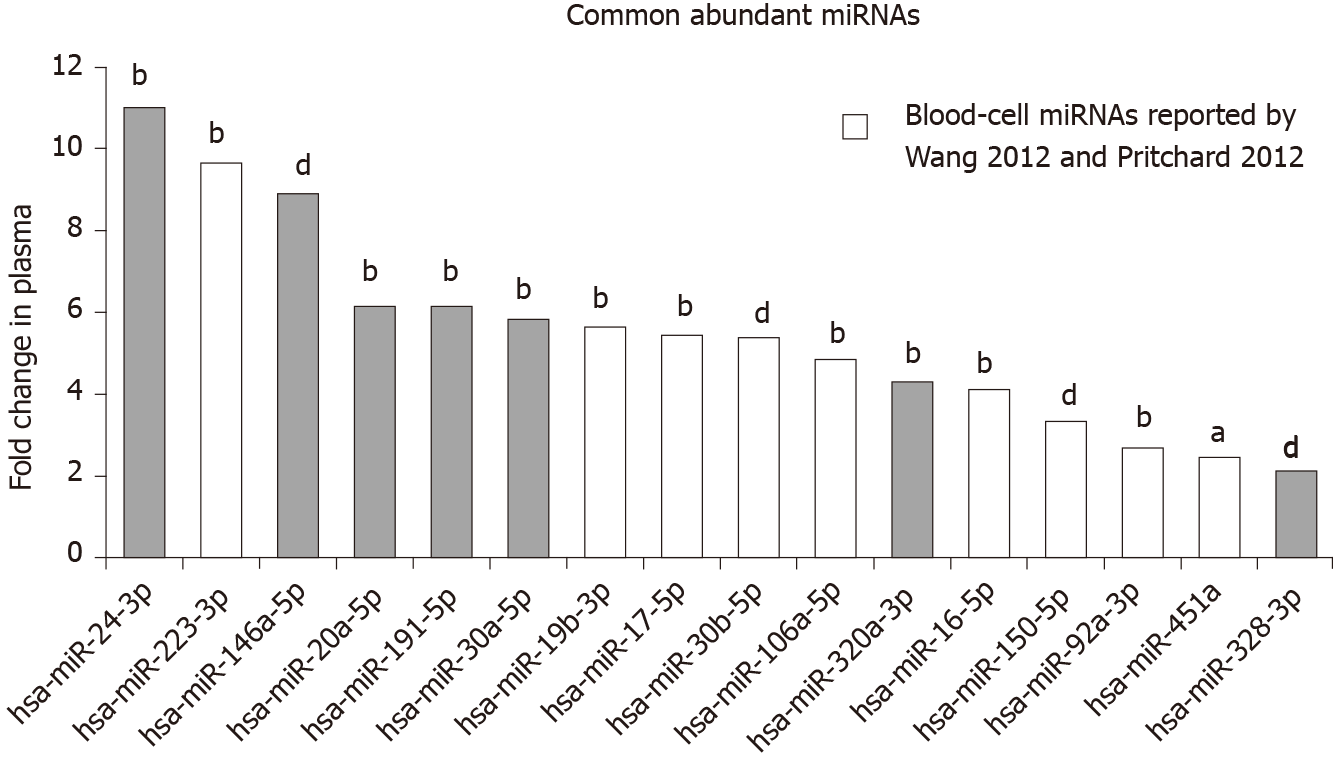
Figure 3 Fold difference in abundance of the common most abundant microRNAs in plasma compared with serum small extracellular vesicles preparations.
The fold change is calculated as the relative expression in the plasma divided by the relative expression in the serum. All common abundant microRNAs, including those previously reported as blood-cell microRNAs by Wang et al[10] and Pritchard et al[8], were significantly higher in the plasma than serum. (Wilcoxon signed-rank test, bP = 0.0051; dP = 0.007; aP = 0.01).
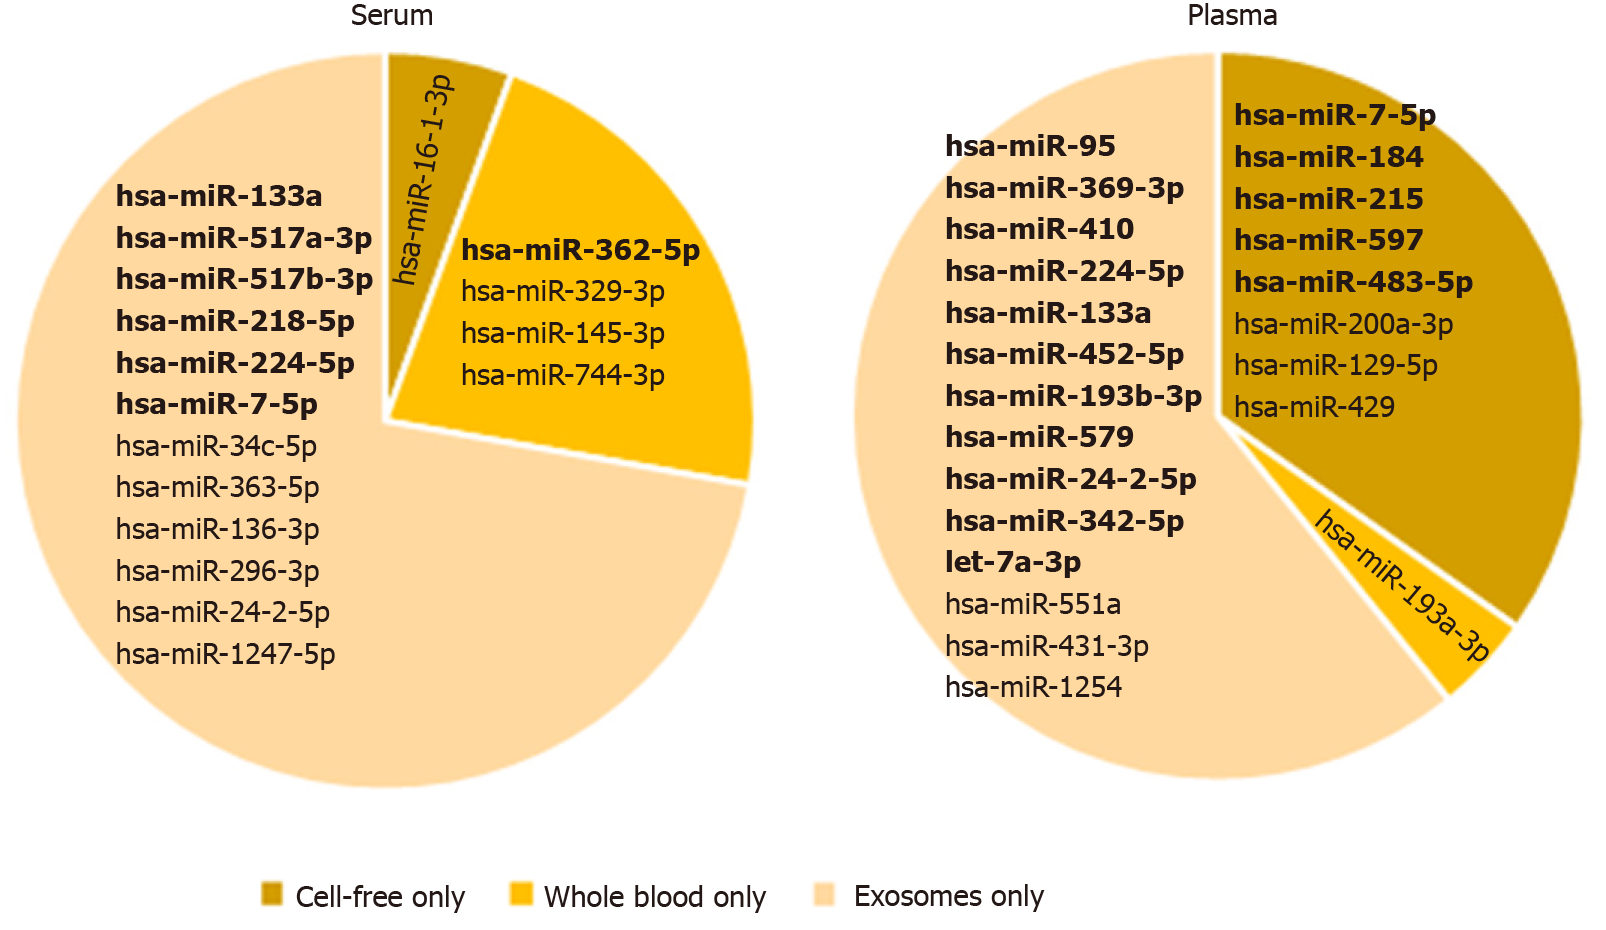
Figure 4 Presence of microRNAs reported to be uniquely expressed in whole blood, cell-free, or small extracellular vesicles, in serum and plasma.
The lists of unique miRNAs were derived from Cheng et al[11]. miRNAs detected in at least 50% of each sample type are presented in bold.
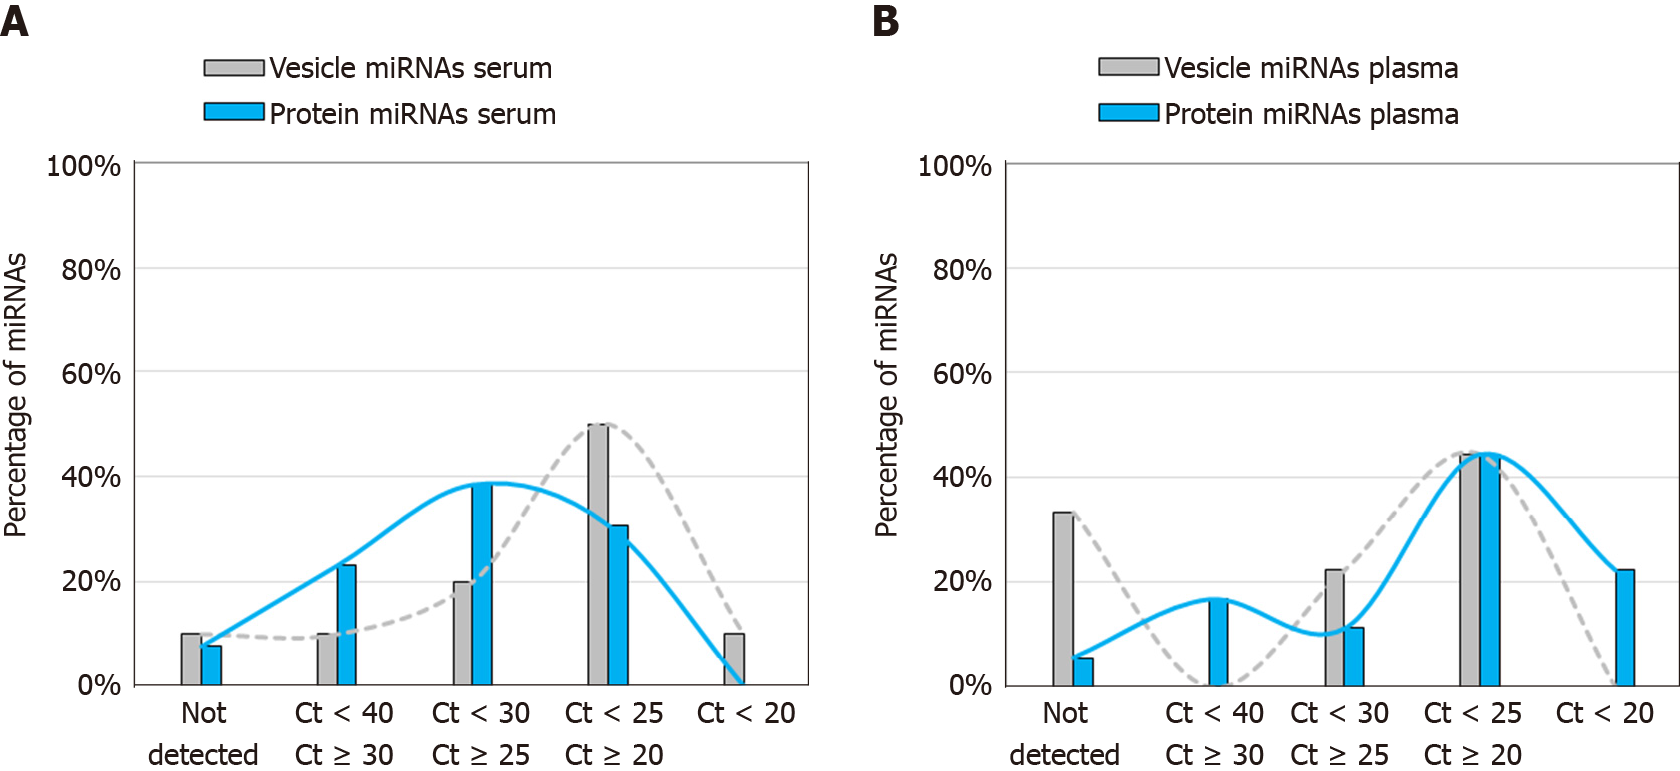
Figure 5 Percentage of vesicle-associated (grey) and protein-associated (blue) microRNAs expressed at levels within the indicated cycle threshold range in small extracellular vesicle preparations from healthy controls.
A: Serum; B: Plasma. The list of vesicle-associated and protein-associated miRNAs assessed in the serum and plasma were derived from Arroyo et al[13]. The bar graphs represent the percentage of microRNAs (miRNAs) within each cycle threshold range out of the total vesicle-associated miRNAs or protein-associated miRNAs assessed respectively in each sample type. Smoothed lines were added to aid visualisation of the trends.
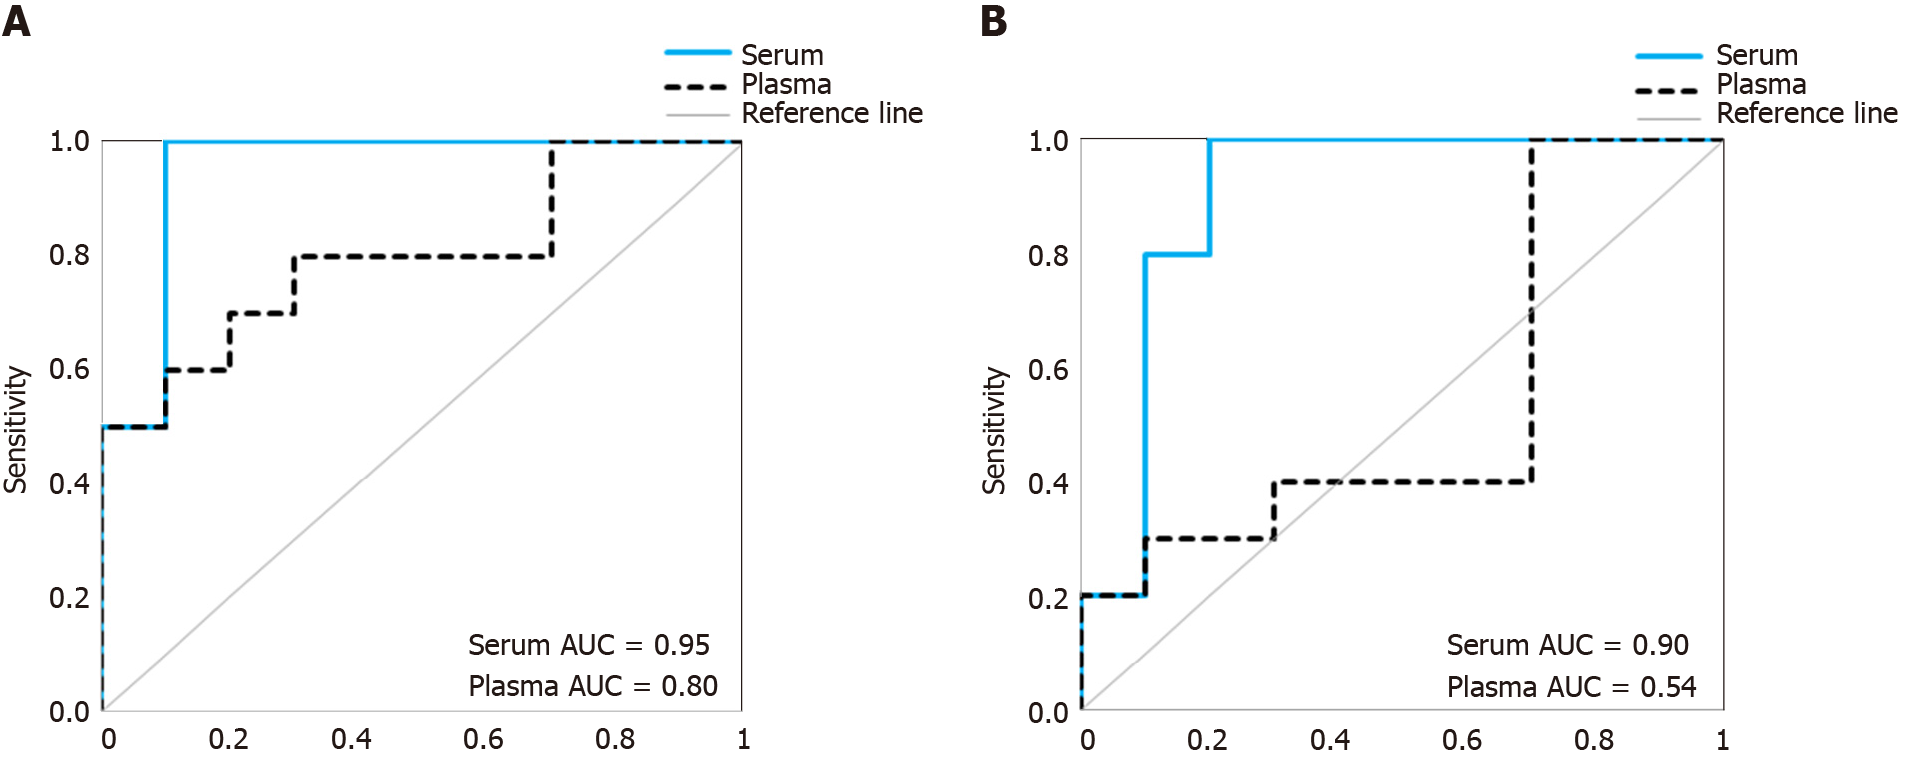
Figure 6 Comparison of the diagnostic performance of a previously identified 5-microRNA ratio biomarker panel (Chiam et al[20]) for detecting esophageal adecarcinoma.
A: The diagnostic accuracy of the biomarker panel was assessed by receiver-operating characteristics curve analysis. The area under the curve was greater in the serum than the plasma; B: The biomarker panel was assessed by leave-one-out-cross validation. The serum small extracellular vesicle preparations produced greater diagnostic accuracy than the plasma small extracellular vesicle preparations. Healthy individuals, n = 10; esophageal adenocarcinoma, n = 10. AUC: Area under the curve.
- Citation: Chiam K, Mayne GC, Wang T, Watson DI, Irvine TS, Bright T, Smith LT, Ball IA, Bowen JM, Keefe DM, Thompson SK, Hussey DJ. Serum outperforms plasma in small extracellular vesicle microRNA biomarker studies of adenocarcinoma of the esophagus. World J Gastroenterol 2020; 26(20): 2570-2583
- URL: https://www.wjgnet.com/1007-9327/full/v26/i20/2570.htm
- DOI: https://dx.doi.org/10.3748/wjg.v26.i20.2570


