Copyright
©The Author(s) 2020.
World J Gastroenterol. May 28, 2020; 26(20): 2570-2583
Published online May 28, 2020. doi: 10.3748/wjg.v26.i20.2570
Published online May 28, 2020. doi: 10.3748/wjg.v26.i20.2570
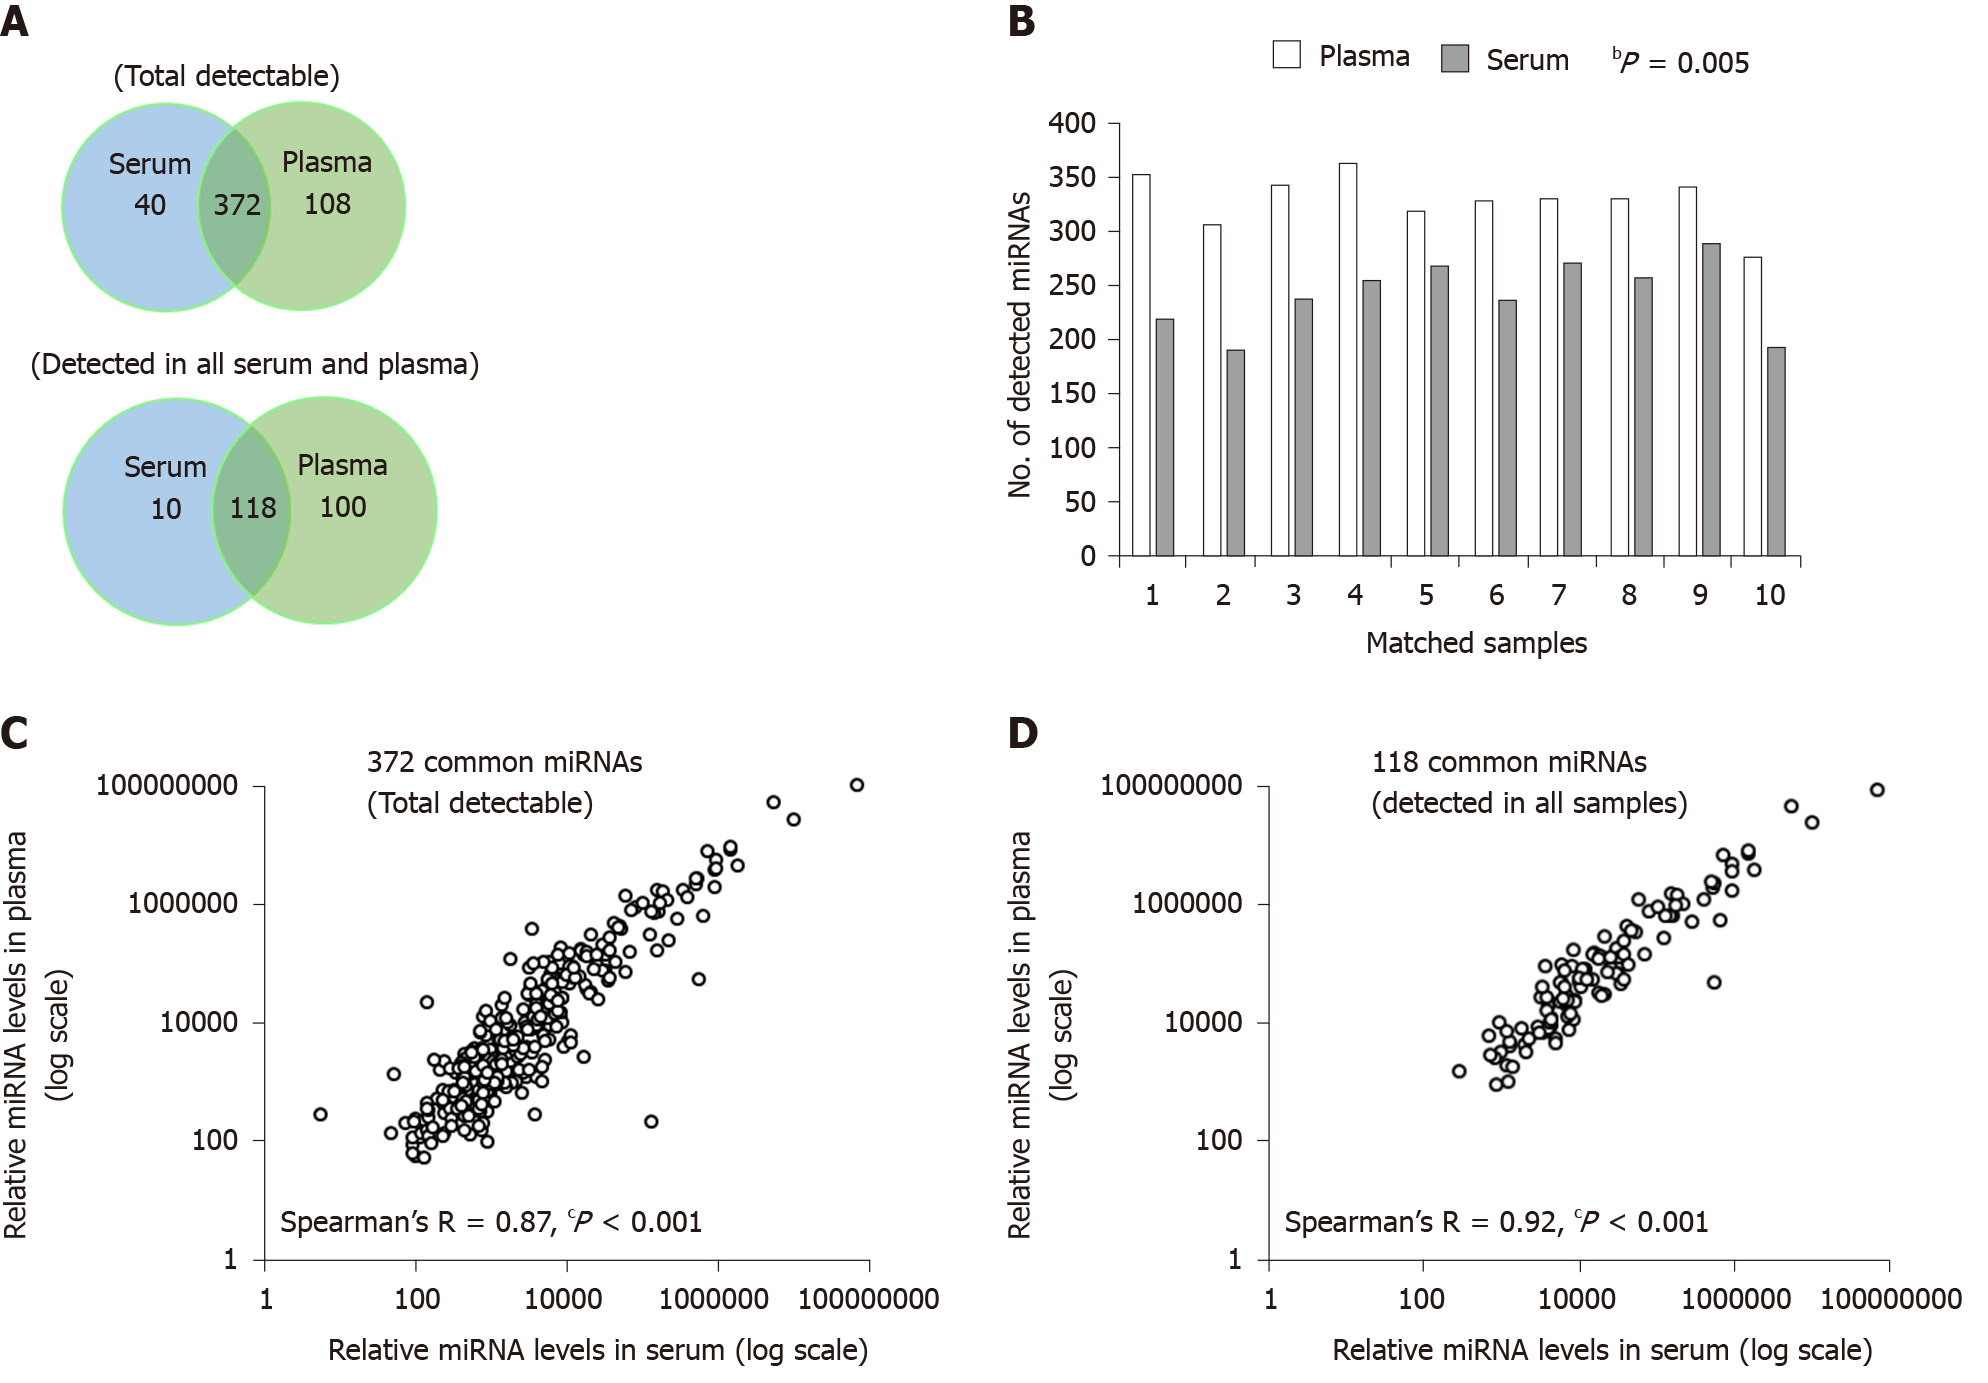
Figure 2 Comparison of the microRNA content between serum and plasma small extracellular vesicles.
A: The number of total detectable microRNA (miRNAs) (top Venn diagram), and the number of miRNAs detected in all serum or plasma samples (bottom Venn diagram), were higher in plasma; B: Pairwise comparison of the number of total detectable miRNAs was significantly higher in the plasma (Wilcoxon signed-rank test, bP = 0.005); C: Correlation of the average relative expression of the 372 common total detectable miRNAs (Spearman’s R = 0.87, cP < 0.001); D: Correlation of the average relative expression of the 118 common miRNAs detected in all serum or plasma samples (Spearman’s R = 0.92, cP < 0.001). miRNA: MicroRNA.
- Citation: Chiam K, Mayne GC, Wang T, Watson DI, Irvine TS, Bright T, Smith LT, Ball IA, Bowen JM, Keefe DM, Thompson SK, Hussey DJ. Serum outperforms plasma in small extracellular vesicle microRNA biomarker studies of adenocarcinoma of the esophagus. World J Gastroenterol 2020; 26(20): 2570-2583
- URL: https://www.wjgnet.com/1007-9327/full/v26/i20/2570.htm
- DOI: https://dx.doi.org/10.3748/wjg.v26.i20.2570


