Copyright
©The Author(s) 2019.
World J Gastroenterol. Nov 14, 2019; 25(42): 6311-6321
Published online Nov 14, 2019. doi: 10.3748/wjg.v25.i42.6311
Published online Nov 14, 2019. doi: 10.3748/wjg.v25.i42.6311
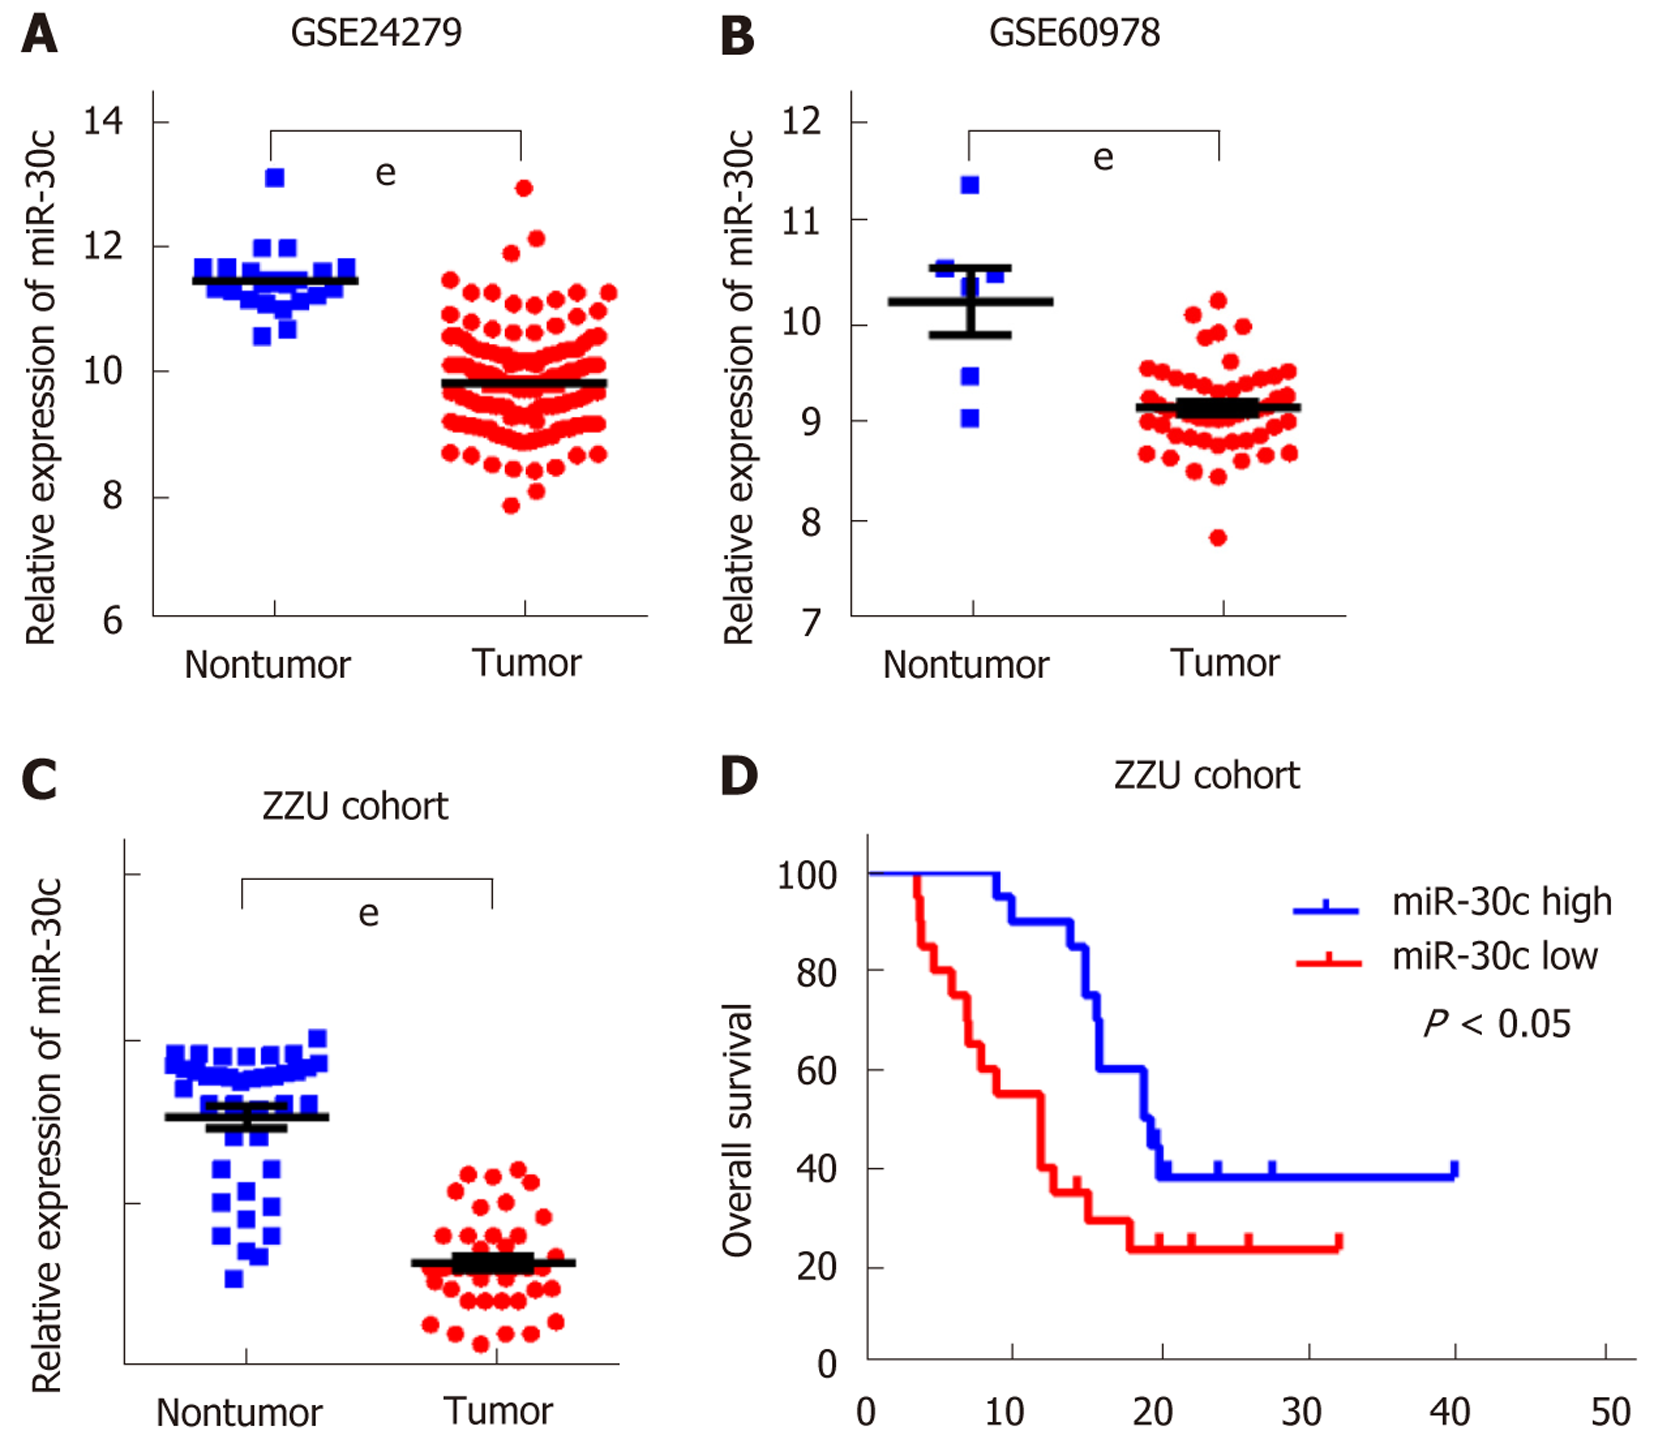
Figure 1 Downregulation of miR-30c and its prognostic significance in pancreatic cancer.
A: MiR-30c expression in the Gene Expression Omnibus (GEO) dataset GSE24279. B: MiR-30c expression in the GEO dataset GSE60978. C: Quantitative real-time polymerase chain reaction detection of the expression of miR-30c in tissues collected at the First Affiliated Hospital of Zhengzhou University. D: Kaplan–Meier analysis of survival of pancreatic cancer patients (n = 40). The data are presented as the mean ± standard deviation. P < 0.05 was considered statistically significant. eP < 0.001 vs nontumor group. ZZU: Zhengzhou University.
Figure 2 MiR-30c inhibits the growth of pancreatic cancer cell lines in vitro.
A: Expression levels of miR-30c in five human pancreatic cancer cell lines and human pancreatic ductal epithelial cell line (HPDE). B: Expression levels of miR-30c in cells transfected with control, miR-30c mimics, or miR-30c inhibitors. C: CCK-8 assays showed distinct differences in proliferation after manipulation of miR-30c in Mia PaCa-2 cells. D: CCK-8 assays showed distinct differences in proliferation after manipulation of miR-30c in BxPC-3 cells. E: Flow cytometry assays were performed to detect the apoptotic rates of cells after transfection. F: Flow cytometric analysis was performed to detect the cell cycle distribution of cells after transfection. All experiments were performed at least three times. The data are presented as the mean ± standard deviation. P < 0.05 was considered statistically significant. aP < 0.05 vs control group; bP < 0.01 vs control group; eP < 0.001 vs control group; cP < 0.05 vs HPDE; dP < 0.01 vs HPDE. HPDE: Human pancreatic ductal epithelial cell line.
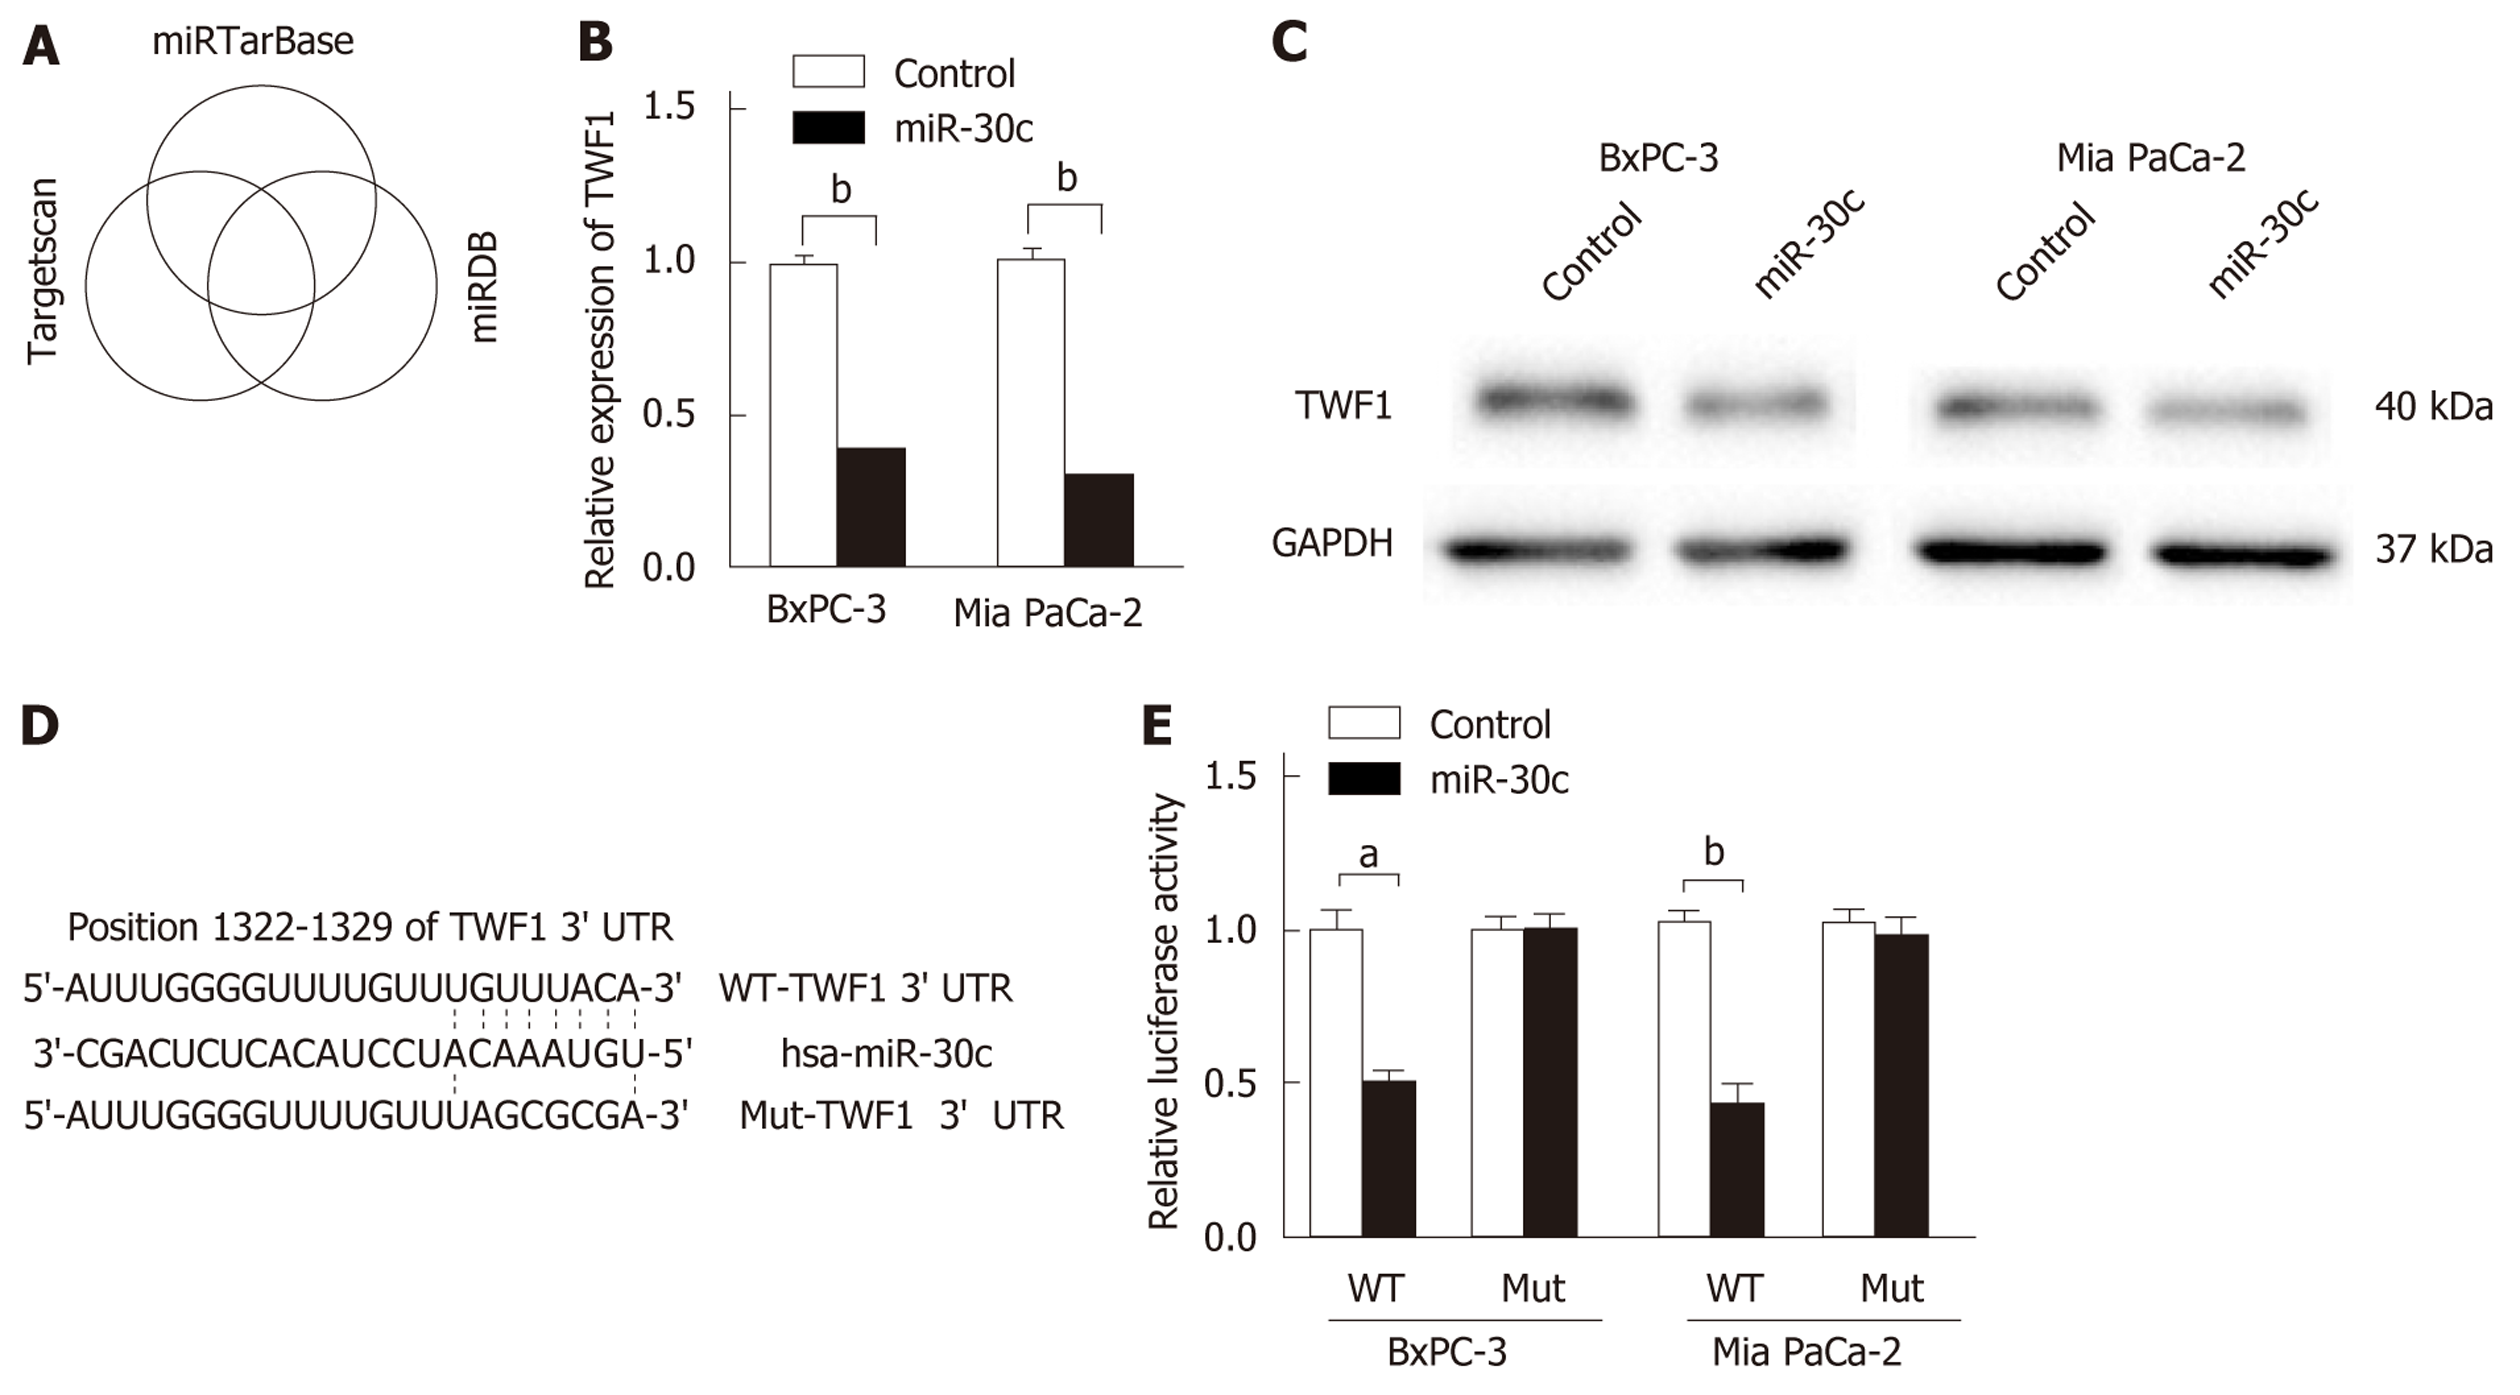
Figure 3 Twinfilin 1 is a direct target of miR-30c.
A: Venn diagram showing that miR-30c targets twinfilin 1 (TWF1) by three prediction tool intersections. B: Expression of TWF1 detected by quantitative real-time polymerase chain reaction after control or miR-30c mimics were transfected into pancreatic cancer cells. C: Expression of TWF1 detected by Western blot analysis after control or miR-30c mimics were transfected into pancreatic cancer cells. D: Predicted miR-30c target sequence in the TWF1 3’-UTR based on the TargetScan database. E: Relative luciferase activity of dual-luciferase reporter plasmids carrying wild-type or mutant TWF1 3’-UTR in pancreatic cancer cells cotransfected with control or miR-30c mimics. All experiments were performed at least three times. The data are presented as the mean ± standard deviation. P < 0.05 was considered statistically significant. aP < 0.05 vs mimics group; bP < 0.01 vs mimics group. Twinfilin 1: TWF1; 3’-UTRs: 3’-untranslated regions; WT: Wild-type; Mut: Mutant.
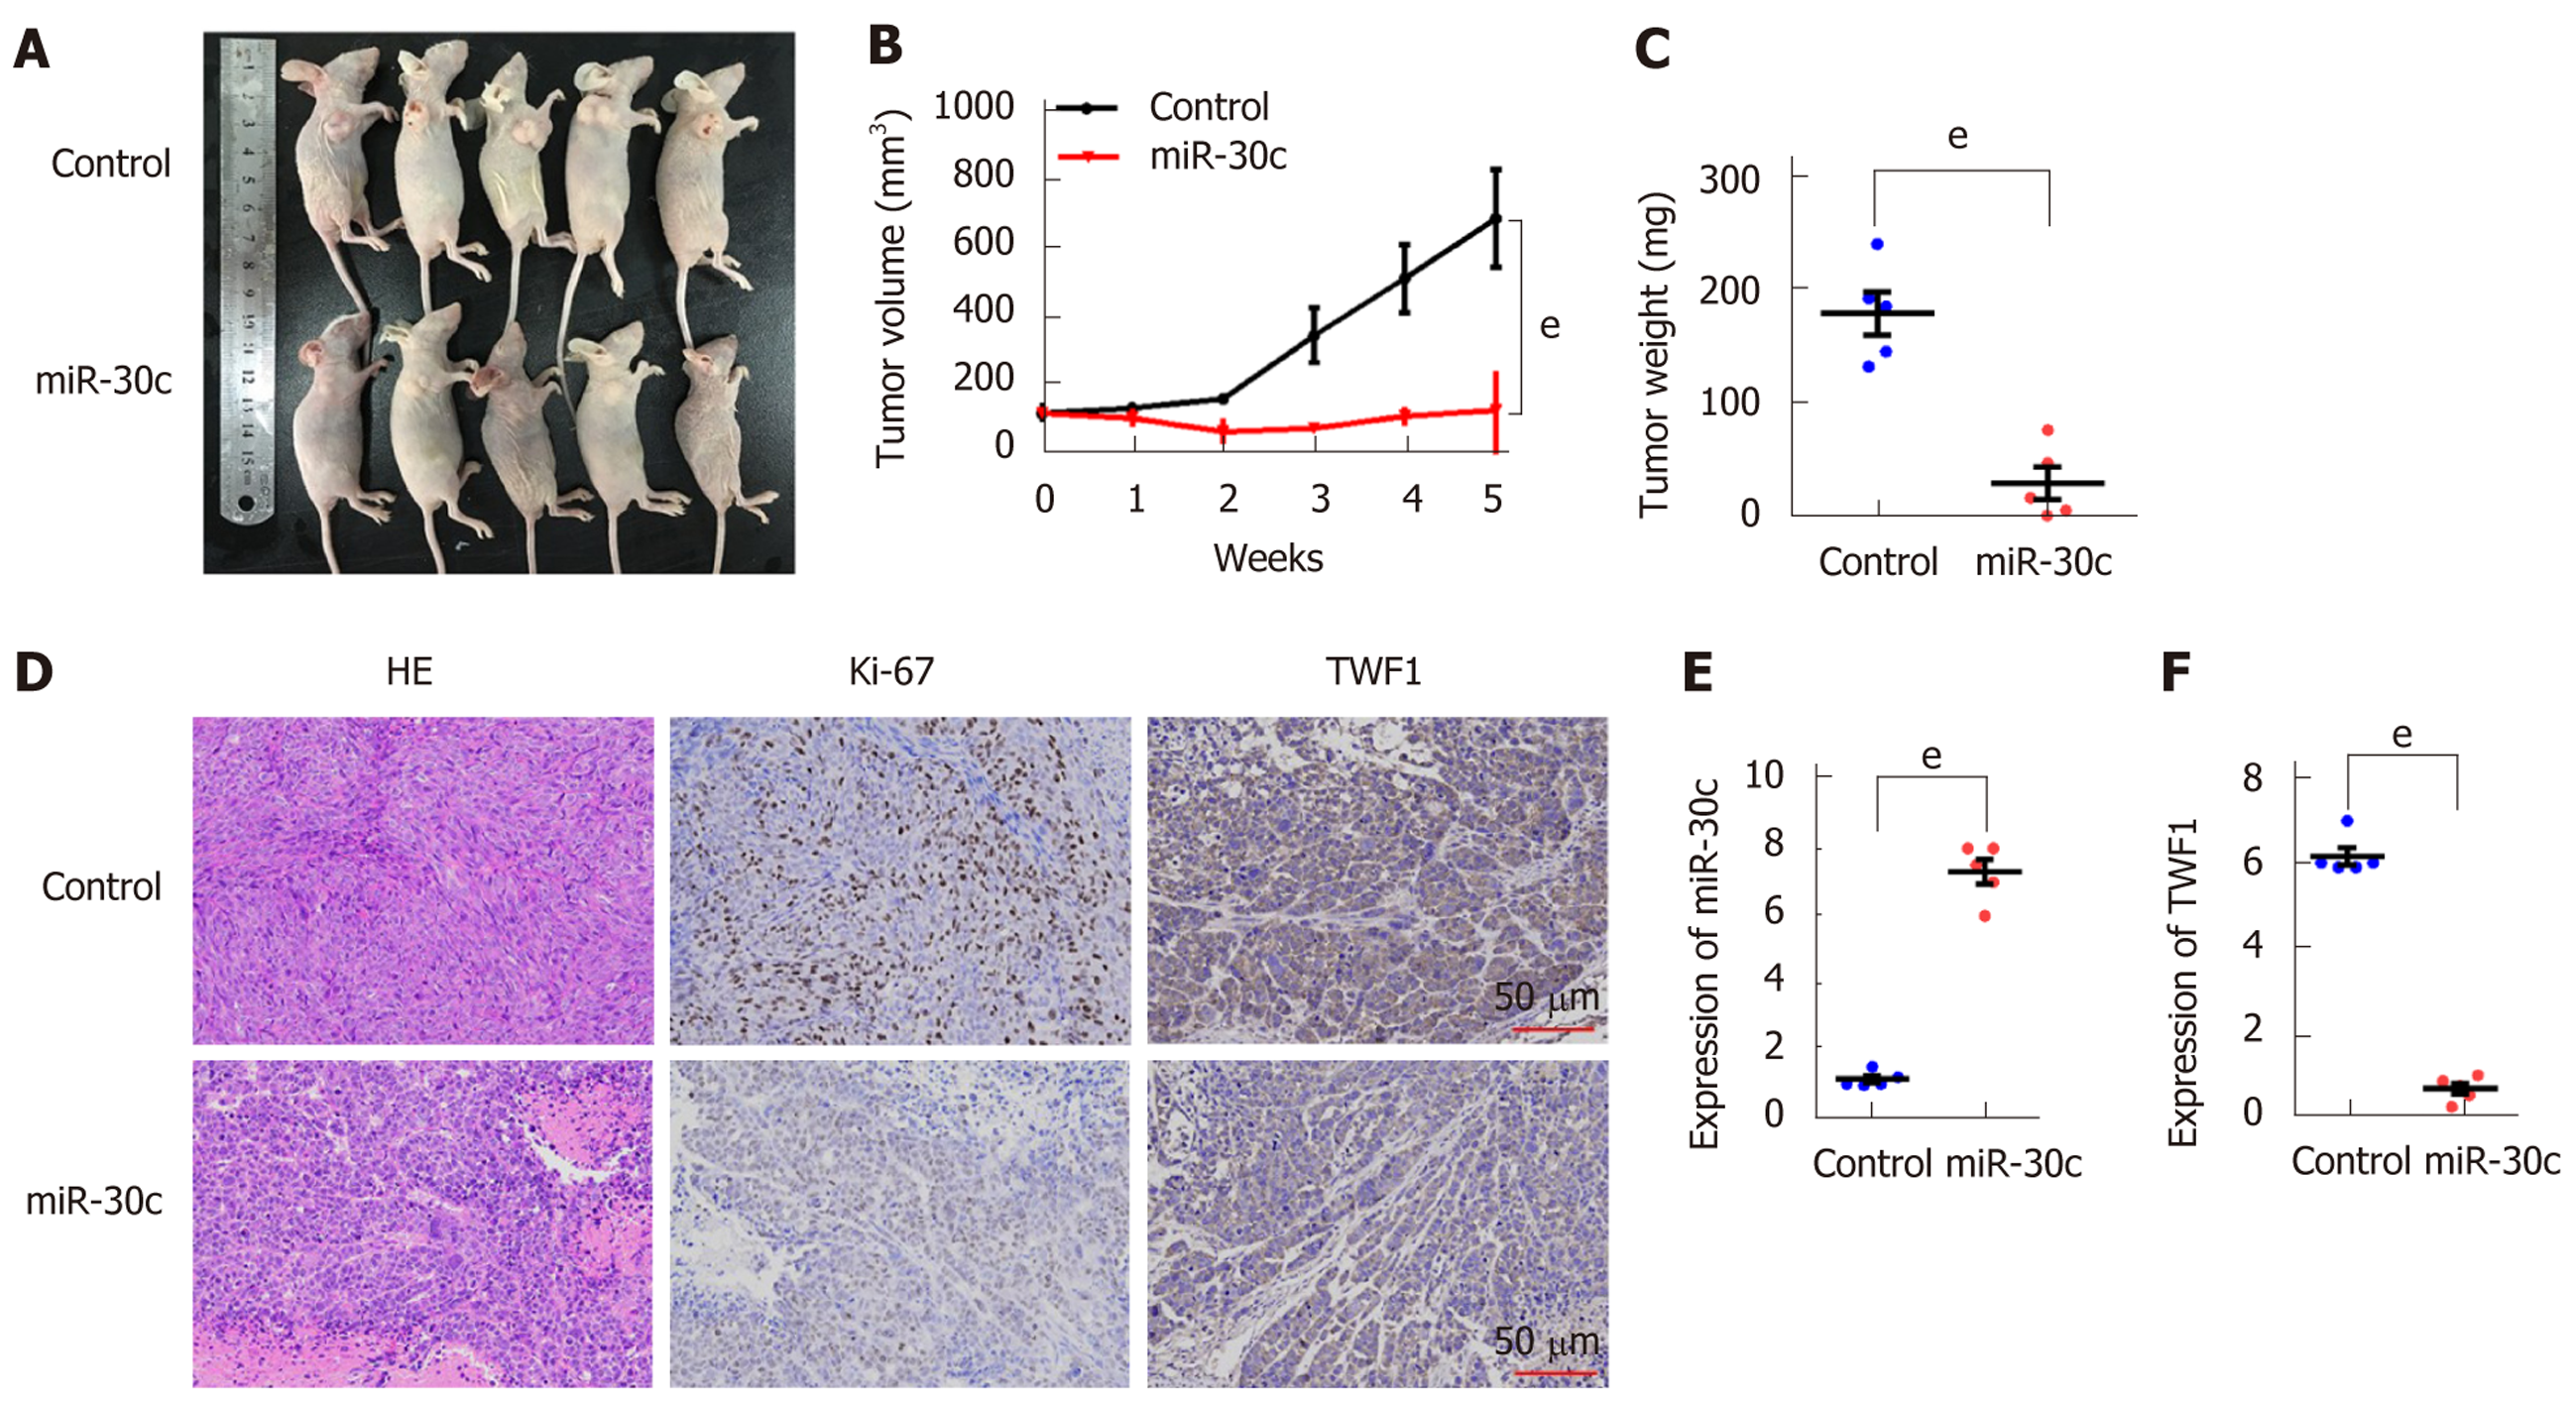
Figure 4 Overexpression of miR-30c inhibits tumor growth in vivo.
A: Images of the xenograft model from each treated group. B: Tumor growth curves of each treated group in mice (n = 5) inoculated with the indicated cells on the indicated days. C: Tumor weight of each treated group. D: H&E staining and immunohistochemistry analysis of Ki-67 and twinfilin 1 (TWF1) in each treated group. Scale bar, 50 μm (red line). E and F: Quantitative real-time polymerase chain reaction analysis of miR-30c and TWF1 expression in xenograft tumors of the indicated group. The data are presented as the mean ± standard deviation. P < 0.05 was considered statistically significant. eP < 0.001 vs control group. TWF1: Twinfilin 1.
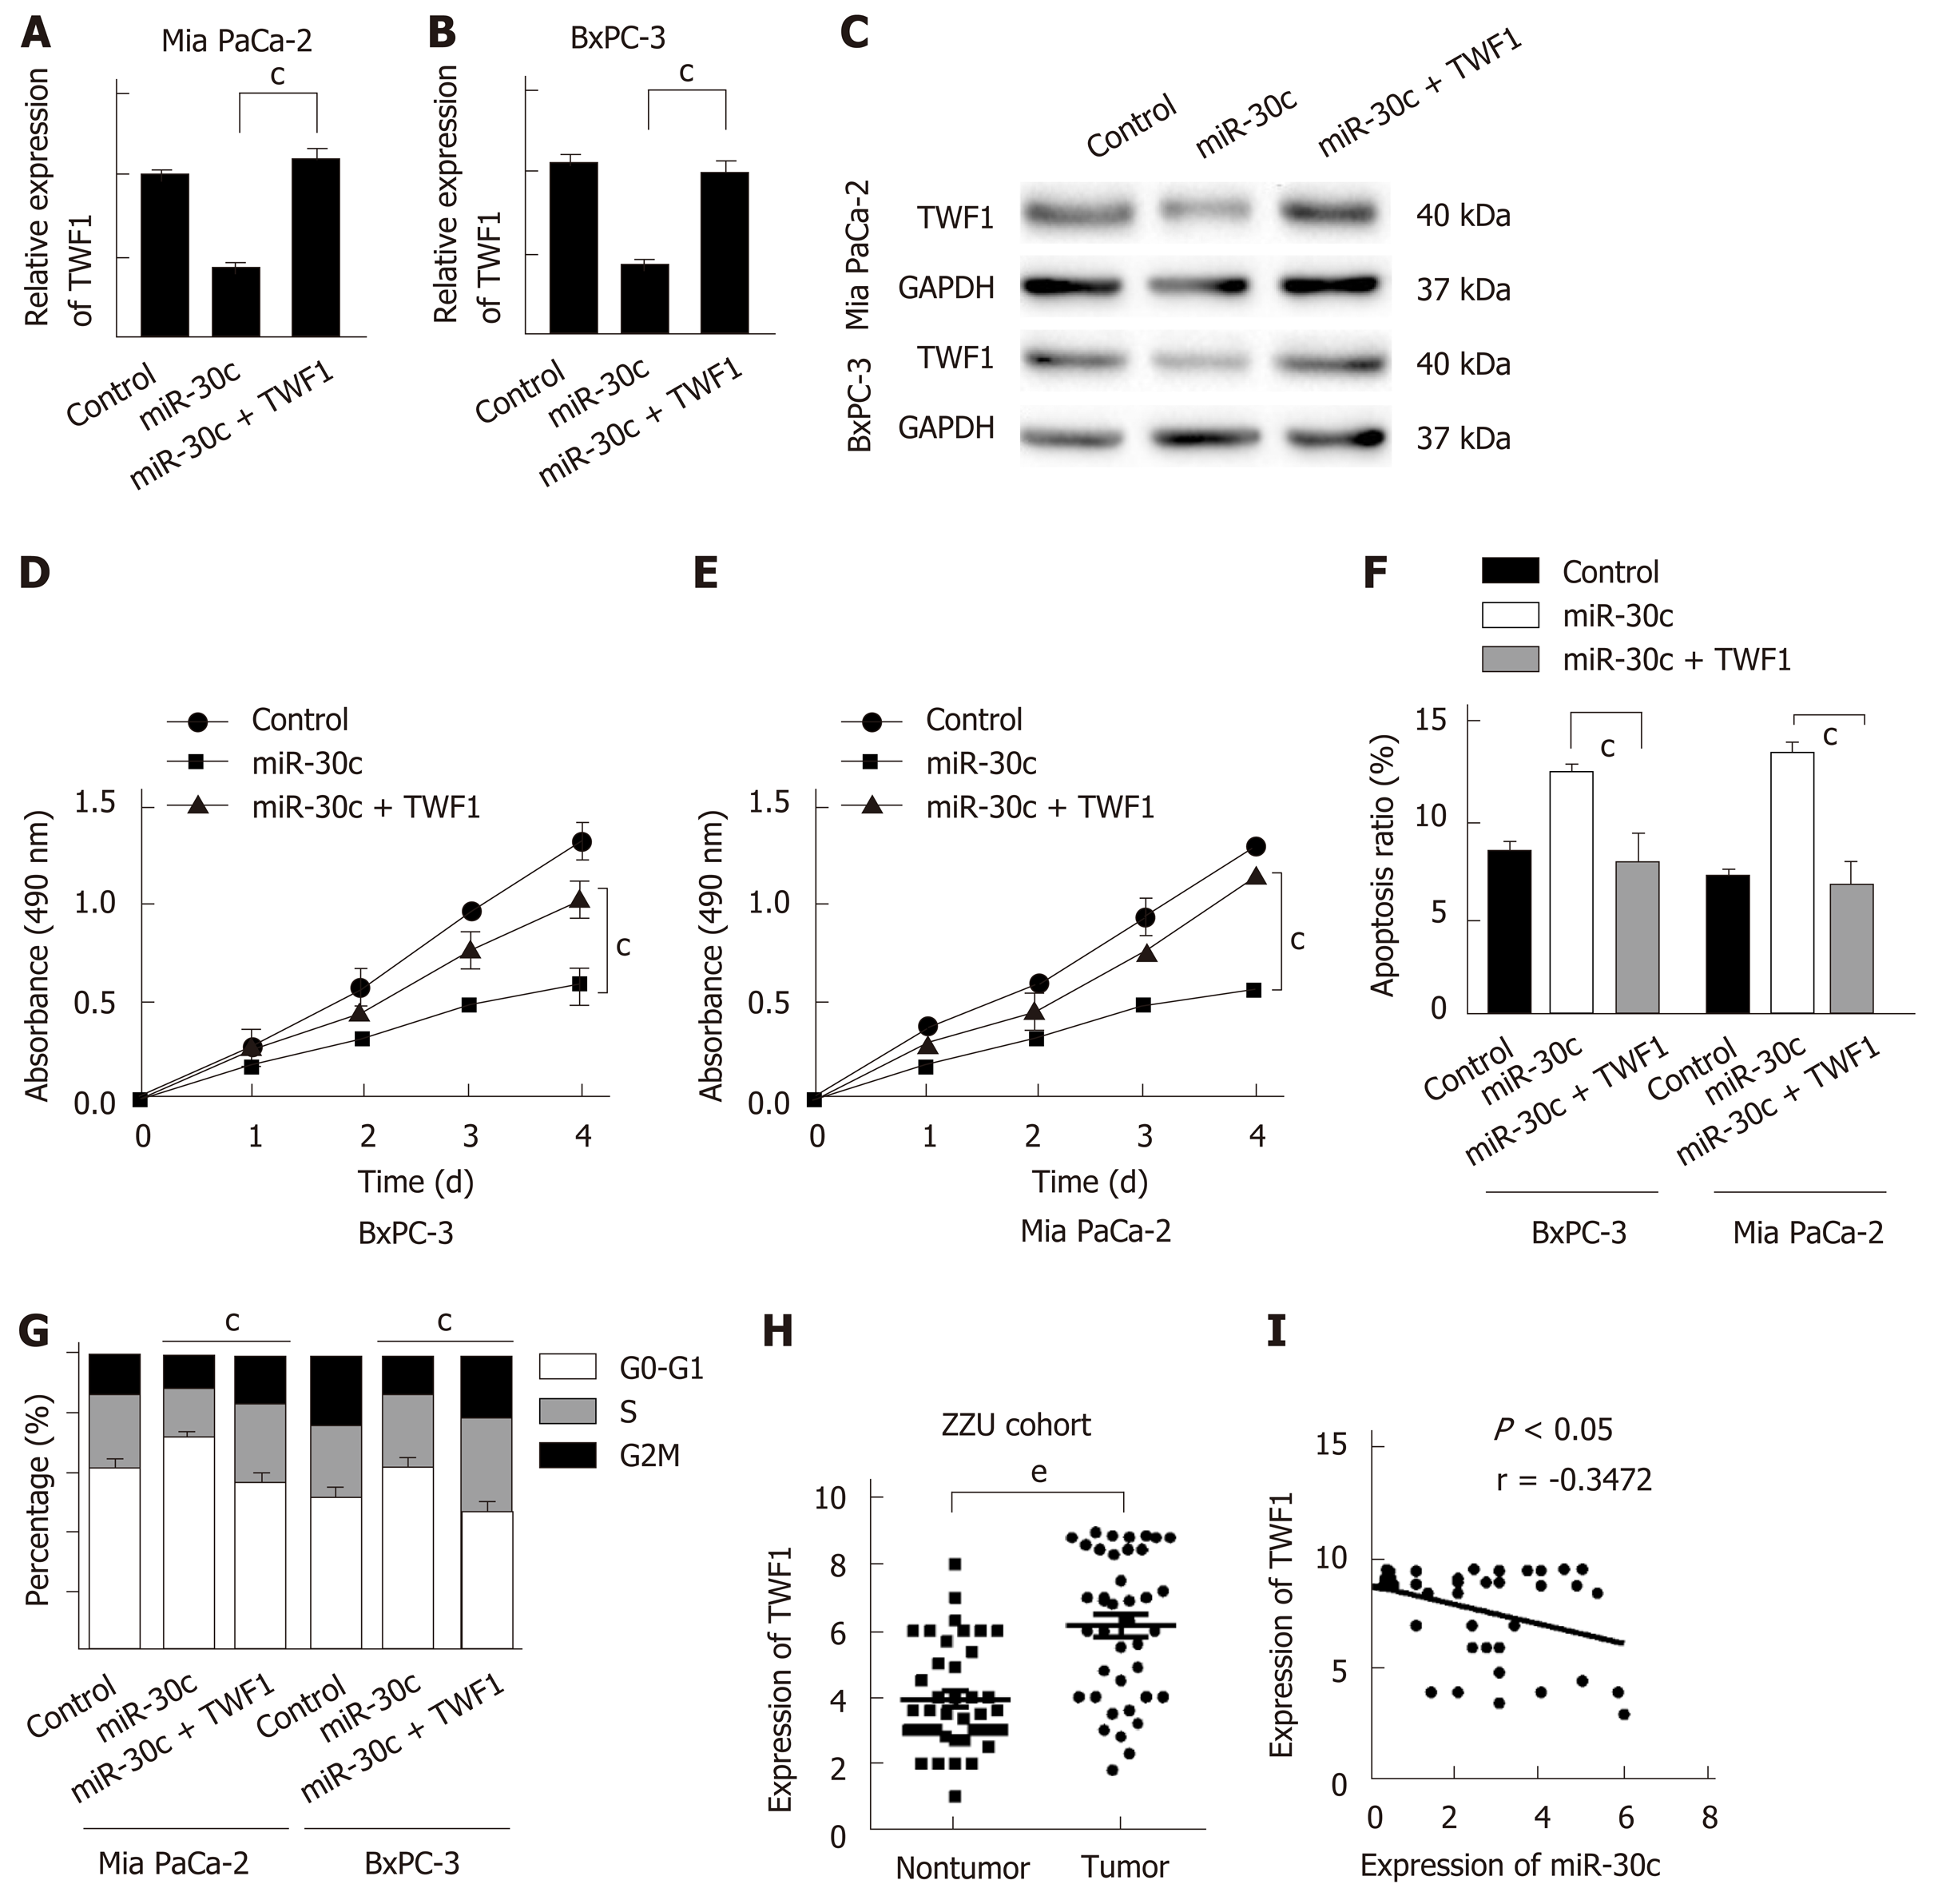
Figure 5 Overexpression of twinfilin 1 abolishes the effects of loss of miR-30c.
A and B: Quantitative real-time polymerase chain reaction (RT-qPCR) was used to determine the expression levels of twinfilin 1 (TWF1). C: Western blot was used to determine the expression levels of TWF1. D and E: CCK-8 assays were used to determine the cell proliferation of different groups. F and G: The apoptosis and cell cycle distribution of pancreatic cancer cells in different groups were investigated by flow cytometry. H: RT-qPCR detection of the expression of TWF1 in tissues collected at The First Affiliated Hospital of Zhengzhou University. I: Negative correlation between the expression levels of miR-30c and TWF1 in pancreatic cancer tissues. The data are presented as the mean ± standard deviation. All experiments were performed at least three times. P < 0.05 was considered statistically significant. eP < 0.001 vs nontumor group; cP < 0.05 vs miR-30c + TWF1 group. TWF1: Twinfilin 1.
- Citation: Sun LL, Cheng M, Xu XD. MicroRNA-30c inhibits pancreatic cancer cell proliferation by targeting twinfilin 1 and indicates a poor prognosis. World J Gastroenterol 2019; 25(42): 6311-6321
- URL: https://www.wjgnet.com/1007-9327/full/v25/i42/6311.htm
- DOI: https://dx.doi.org/10.3748/wjg.v25.i42.6311


