Copyright
©The Author(s) 2019.
World J Gastroenterol. Sep 7, 2019; 25(33): 4892-4903
Published online Sep 7, 2019. doi: 10.3748/wjg.v25.i33.4892
Published online Sep 7, 2019. doi: 10.3748/wjg.v25.i33.4892
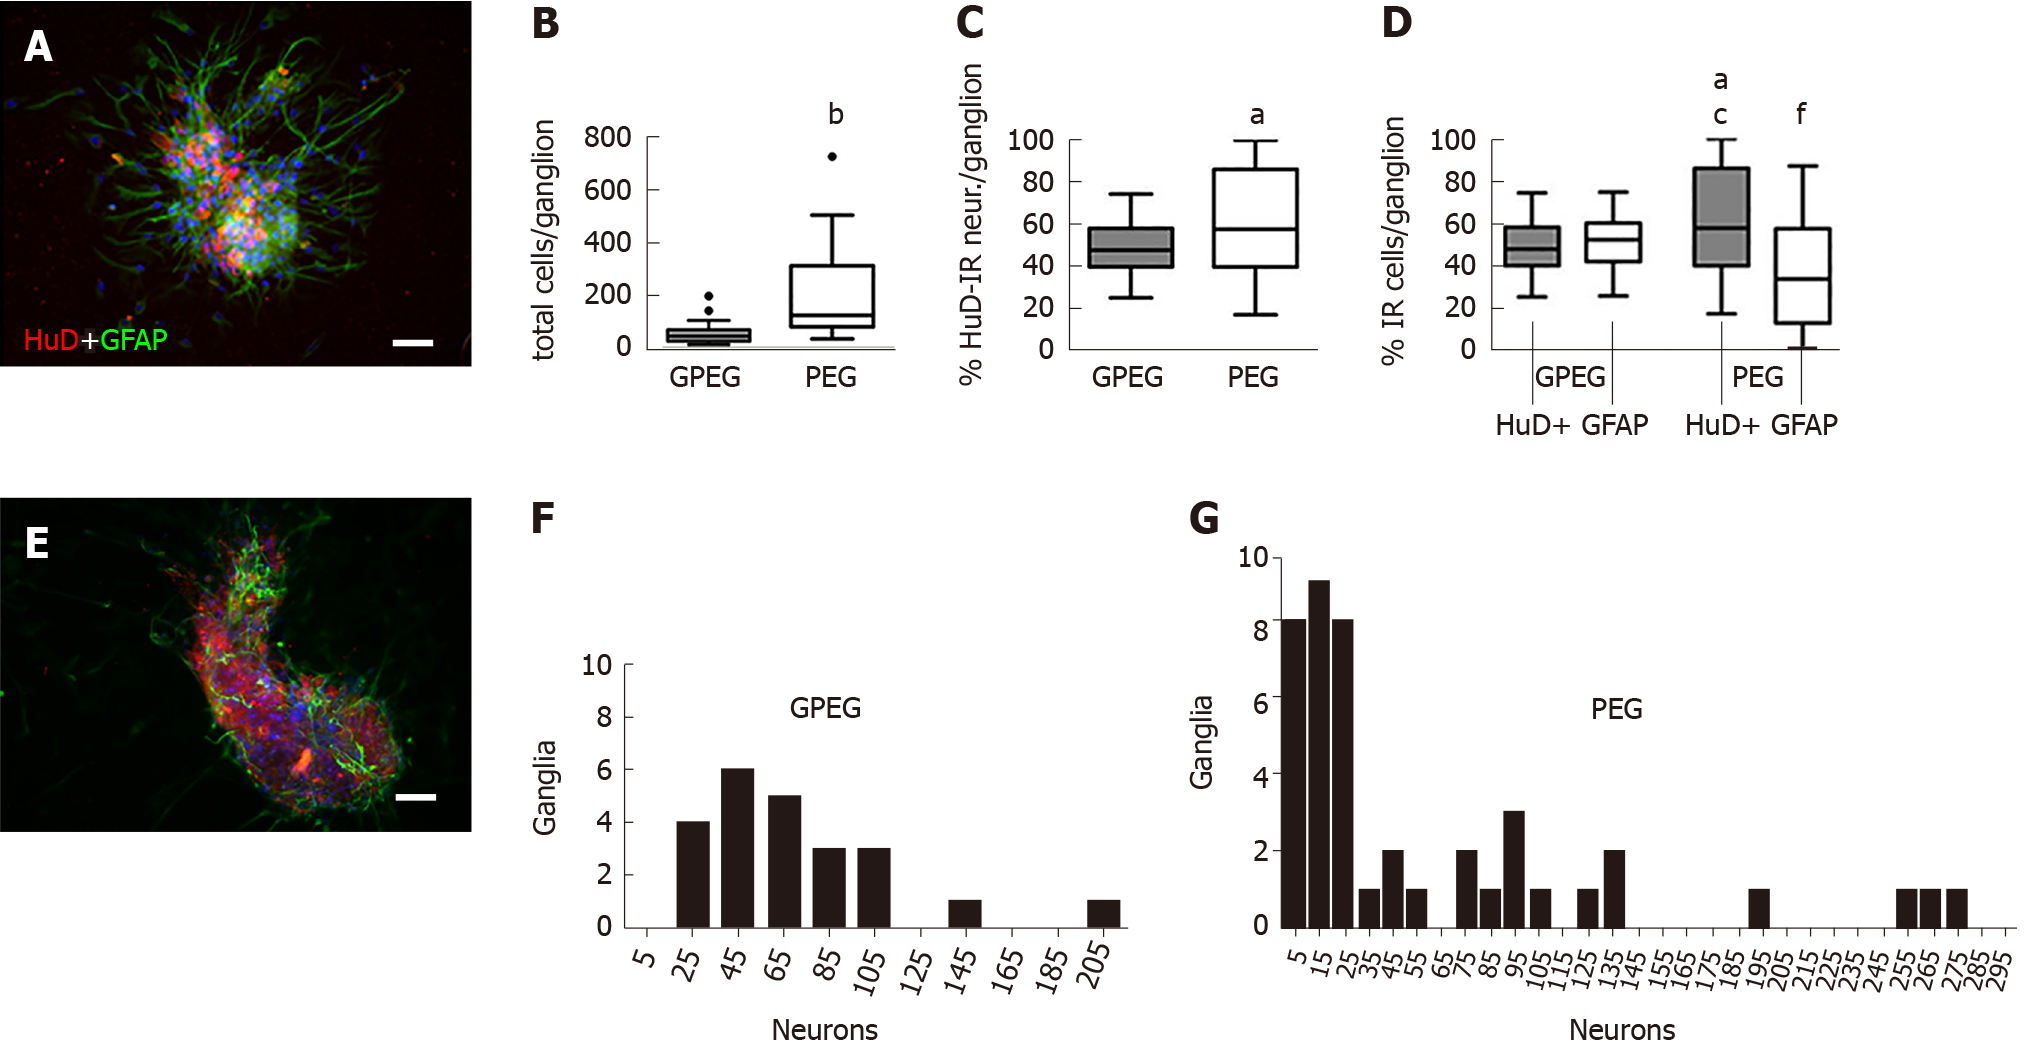
Figure 1 Descriptive analysis of the morphology and cellular composition of guinea pig and pig enteric ganglia after 2 d in vitro.
A and E: Representative photomicrographs of guinea pig enteric ganglia (GPEG) and pig enteric ganglia (PEG) stained with HuD (red) and glial fibrillary acidic protein (GFAP) (green) antibodies directed to neurons and glial cells respectively (scale bar: 100 µm); B: Total number of cells per ganglion in GPEG, left gray box plot, and PEG, right white bars, cultures (53.3 ± 5.2 vs 213.7 ± 50.4 neurons per ganglion, bP < 0.001 vs GPEG); C: PEG showed a higher number of HuD-immunoreactive (HuD-IR) neurons compared to GPEG (+13.7%, aP < 0.05); D: PEG and GPEG comparison of HuD-IR neurons and GFAP-immunoreactive (GFAP-IR) glial cells: PEG presented a higher number of HuD-IR neurons compared to GFAP-IR glial cells (+28.4%, aP < 0.05). In comparison to GPEG, PEG showed a higher number of neurons (+12.7%, cP < 0.05) and a lower number of GFAP-IR glial cells (-15.7%, fP < 0.01); B-D: Values reported as Tukey box-plots were obtained by three independent experiments. F and G: Frequency analysis indicating the number of GPEG (F) and PEG (G) presenting 5 to 205 neurons. GPEG: Guinea pig enteric ganglia; PEG: Pig enteric ganglia; GFAP: Glial fibrillary acidic protein; GFAP-IR: Glial fibrillary acidic protein-immunoreactive; HuD-IR: HuD-immunoreactive.
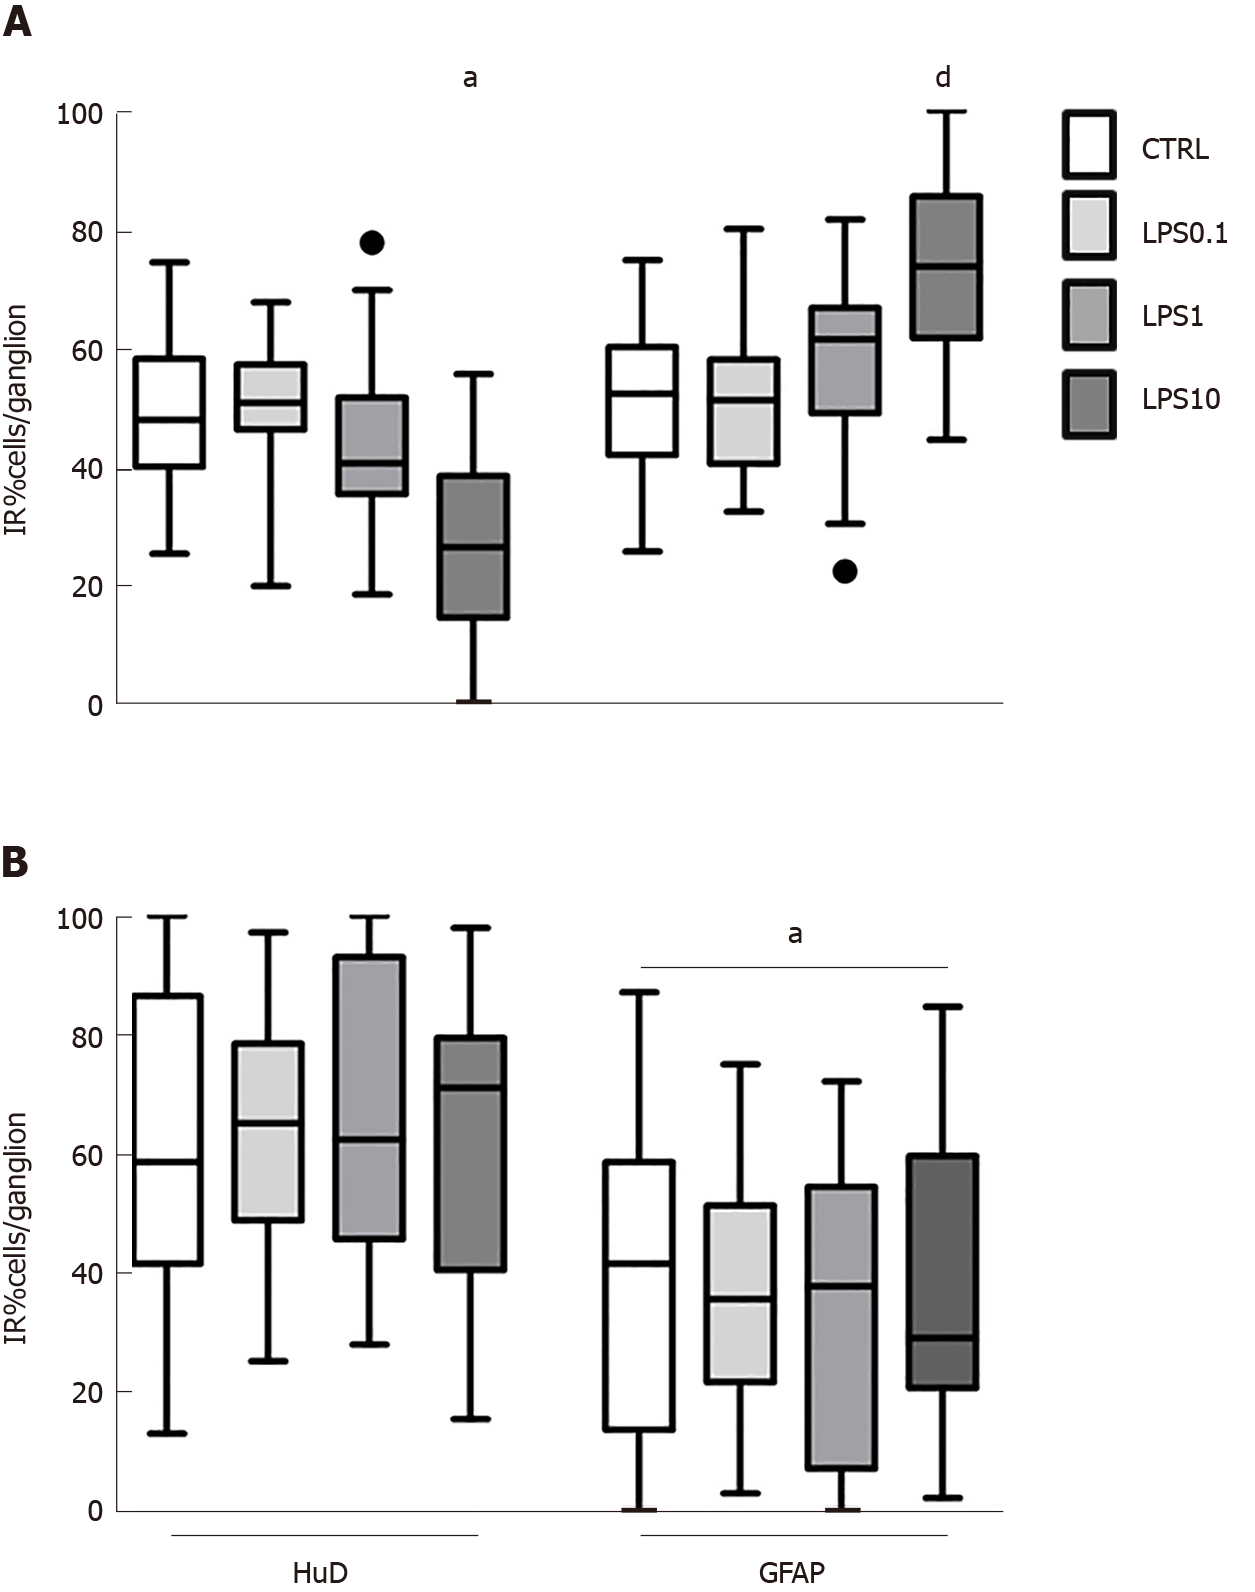
Figure 2 Effect of increasing concentration of lipopolysaccharide on enteric ganglia’ HUD+ neurons and GFAP+ glial cells.
A: In guinea pig-derived enteric ganglia - lipopolysaccharide (LPS) at 10 µg/mL decreased number of HuD-immunoreactive (HuD-IR) neurons (left columns) and increased proliferation of glial fibrillary acidic protein-immunoreactive (GFAP-IR) glial cells (right columns - HuD-IR neurons LPS10 vs CTRL, 22.3%, aP < 0.05; GFAP-IR glial cells LPS10 vs CTRL, +22.2%, dP < 0.01); B: Conversely, in pig enteric ganglia the number of glial cells at every LPS concentration tested did not change and was significatively lower compared to ganglionic neurons. aP < 0.05. LPS: lipopolysaccharide; GFAP-IR: Glial fibrillary acidic protein-immunoreactive; HuD-IR: HuD-immunoreactive.
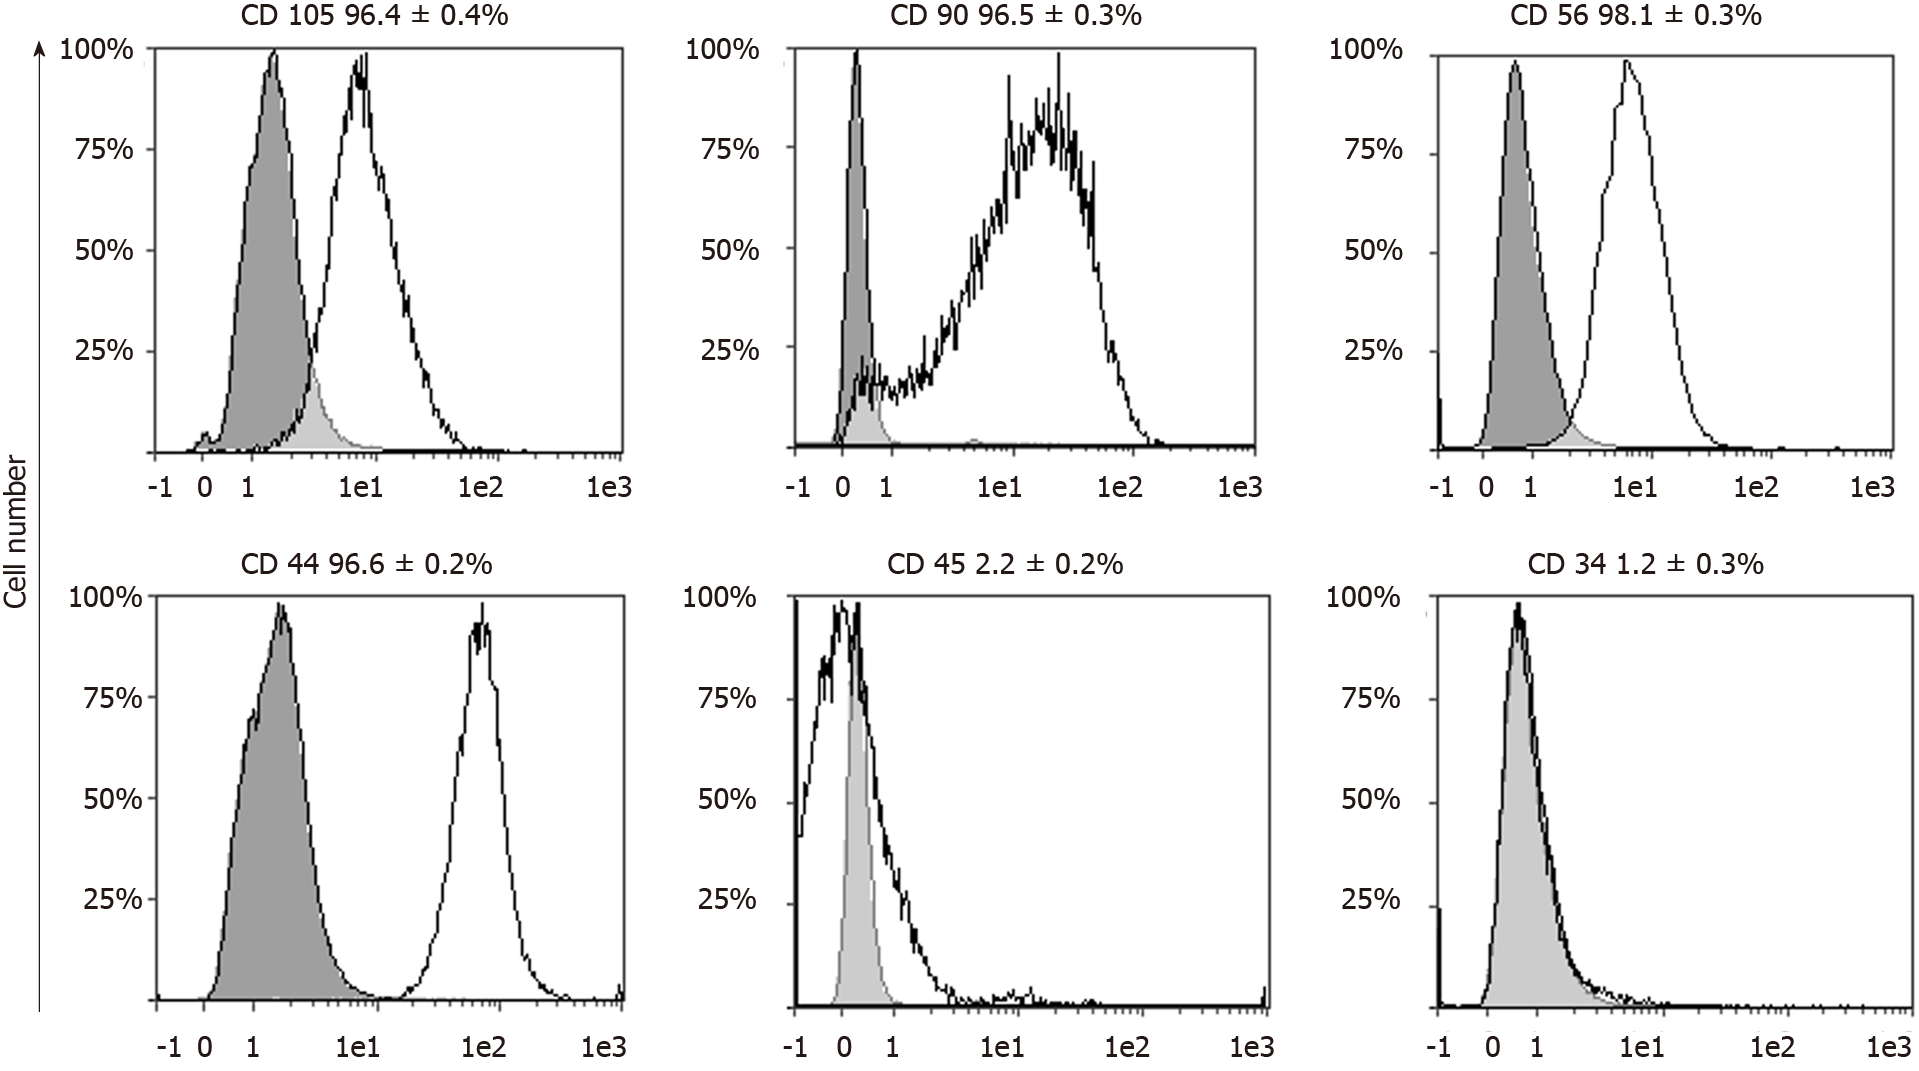
Figure 3 Flowcytometric analysis of cell-surface markers in porcine vascular wall mesenchymal stromal cells.
Each graph shows the percentage of cells expressing the specific marker reported [white area under the curve (AUC)] and the relative negative control (gray AUC, cells not incubated with any antibodies). This analysis confirmed the mesenchymal stromal cell-like immune profile of porcine vascular wall mesenchymal stromal cells: CD105, CD90, CD56, CD44 were highly expressed (> 96%) while the hematopoietic markers CD45 and CD43 were nearly absent (< 2.5%). AUC: Area under the curve.
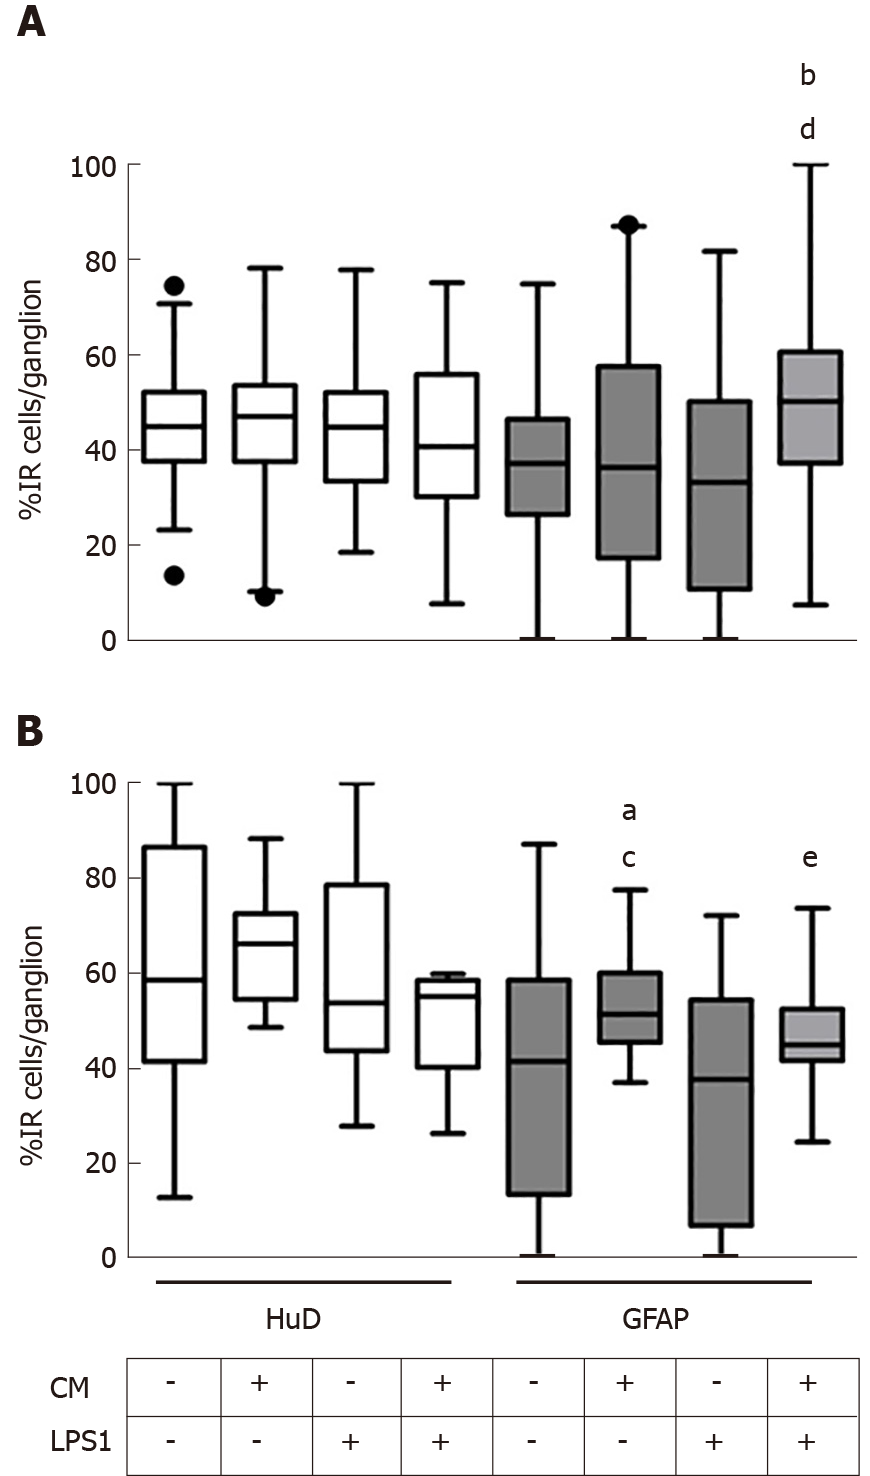
Figure 4 Effect of porcine vascular wall mesenchymal stromal cells supernatants on the number of neurons (left white bars) and glial cells (gray right bars) exposed to lipopolysaccharide 1 µg/mL.
A: The number of neurons in guinea pig enteric ganglia did not change significantly upon any of the treatment tested, whereas co-treatment with conditioned medium (CM) and lipopolysaccharide 1 µg/mL (LPS1) (CM+LPS1) increased the number of glial cells compared to control (CTRL) and LPS1-treated ganglia (+13.9%, bP < 0.001; +16.5%, dP < 0.01, respectively); B: The number of neurons in pig enteric ganglia did not change as a result of any of the treatment tested. Conversely glial cell number was higher in the CM group compared to control (+13.6%, aP < 0.05) and LPS1 (+20.2%, cP < 0.05). CM+LPS1 co-treatment increased the number of glial cells compared to LPS1-treated ganglia (+14.2, eP < 0.05). LPS1: Lipopolysaccharide 1 µg/mL; CM: Conditioned medium. GFAP: Glial fibrillary acidic protein.
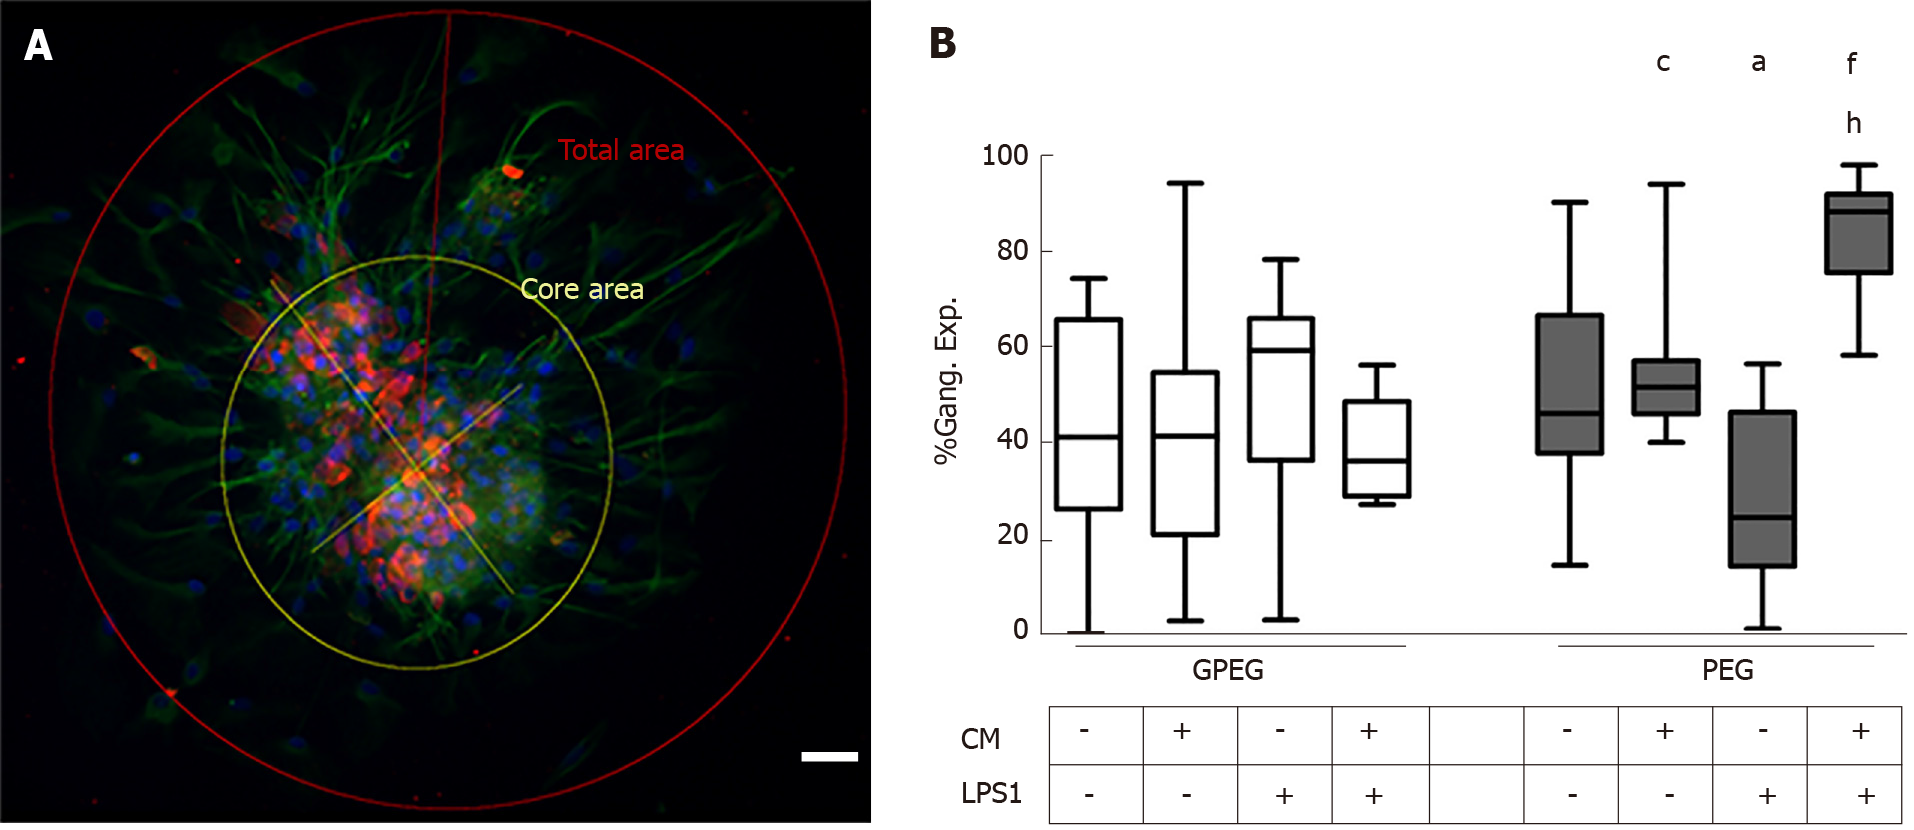
Figure 5 Effect of porcine vascular wall mesenchymal stromal cells supernatants on ganglion expansion.
A: Representative photo of the morphometric analysis performed to compare glial cells processes elongating from ganglion’s cores under different experimental conditions (scale bar: 100 µm); B: Relative area occupied by glial processes of guinea pig (left, gray bars) and pig enteric ganglia (right white bars). Guinea pig enteric ganglia did not show any significant difference between the different treatment groups. Conversely, pig enteric ganglia were more subjected to morphological changes: There was a decrease of the expanded area in the group treated with lipopolysaccharide 1 µg/mL (LPS1) compared to control (-42.88%, aP < 0.05). Moreover, conditioned medium (CM) derived by porcine vascular wall mesenchymal stromal cells evoked a higher protrusion of glial processes than LPS1 alone (+36.8%, cP < 0.05) which was remarkably higher in combination with LPS1 (CM+LPS1, +43.2% vs CTRL, fP < 0.01; +60.9% vs LPS1, hP < 0.01). LPS1: Lipopolysaccharide 1 µg/mL; CM: Conditioned medium; GPEG: Guinea pig enteric ganglia; PEG: Pig enteric ganglia.
- Citation: Dothel G, Bernardini C, Zannoni A, Spirito MR, Salaroli R, Bacci ML, Forni M, Ponti FD. Ex vivo effect of vascular wall stromal cells secretome on enteric ganglia. World J Gastroenterol 2019; 25(33): 4892-4903
- URL: https://www.wjgnet.com/1007-9327/full/v25/i33/4892.htm
- DOI: https://dx.doi.org/10.3748/wjg.v25.i33.4892


