Copyright
©The Author(s) 2018.
World J Gastroenterol. Jul 28, 2018; 24(28): 3145-3154
Published online Jul 28, 2018. doi: 10.3748/wjg.v24.i28.3145
Published online Jul 28, 2018. doi: 10.3748/wjg.v24.i28.3145
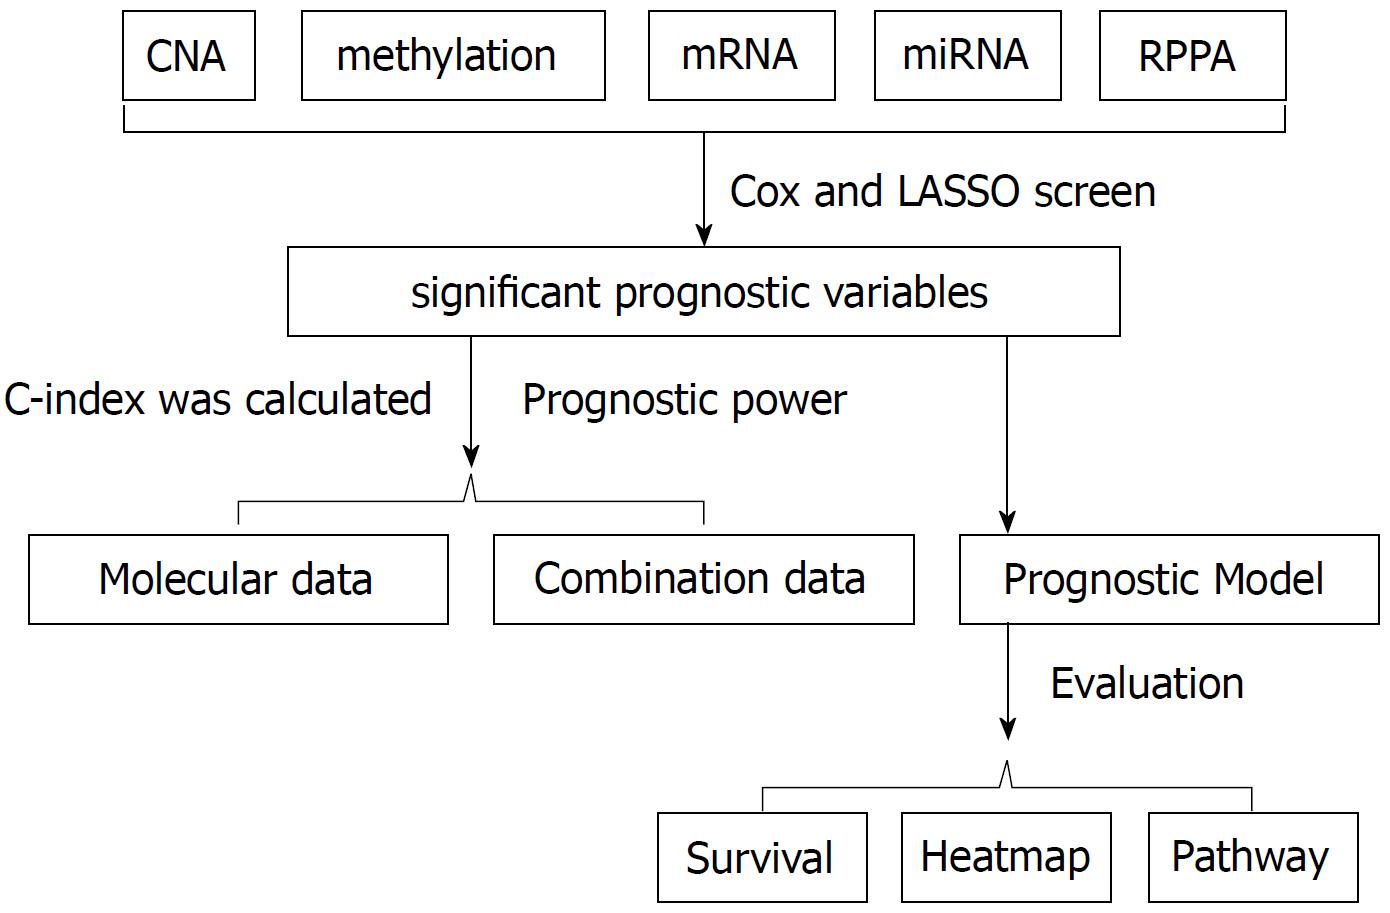
Figure 1 Statistical process (algorithm).
Cox regression screen and least absolute shrinkage and selection operator (LASSO) were performed to select significant prognostic variables. Then the concordance index (C-index) was calculated to evaluate the prognostic power. Prognostic models were built based on the arithmetic summation of the significant variables. Kaplan-Meier survival curve and log-rank test were performed to compare the survival difference. Then the heatmap was constructed and gene set enrichment analysis was performed for pathway analysis.
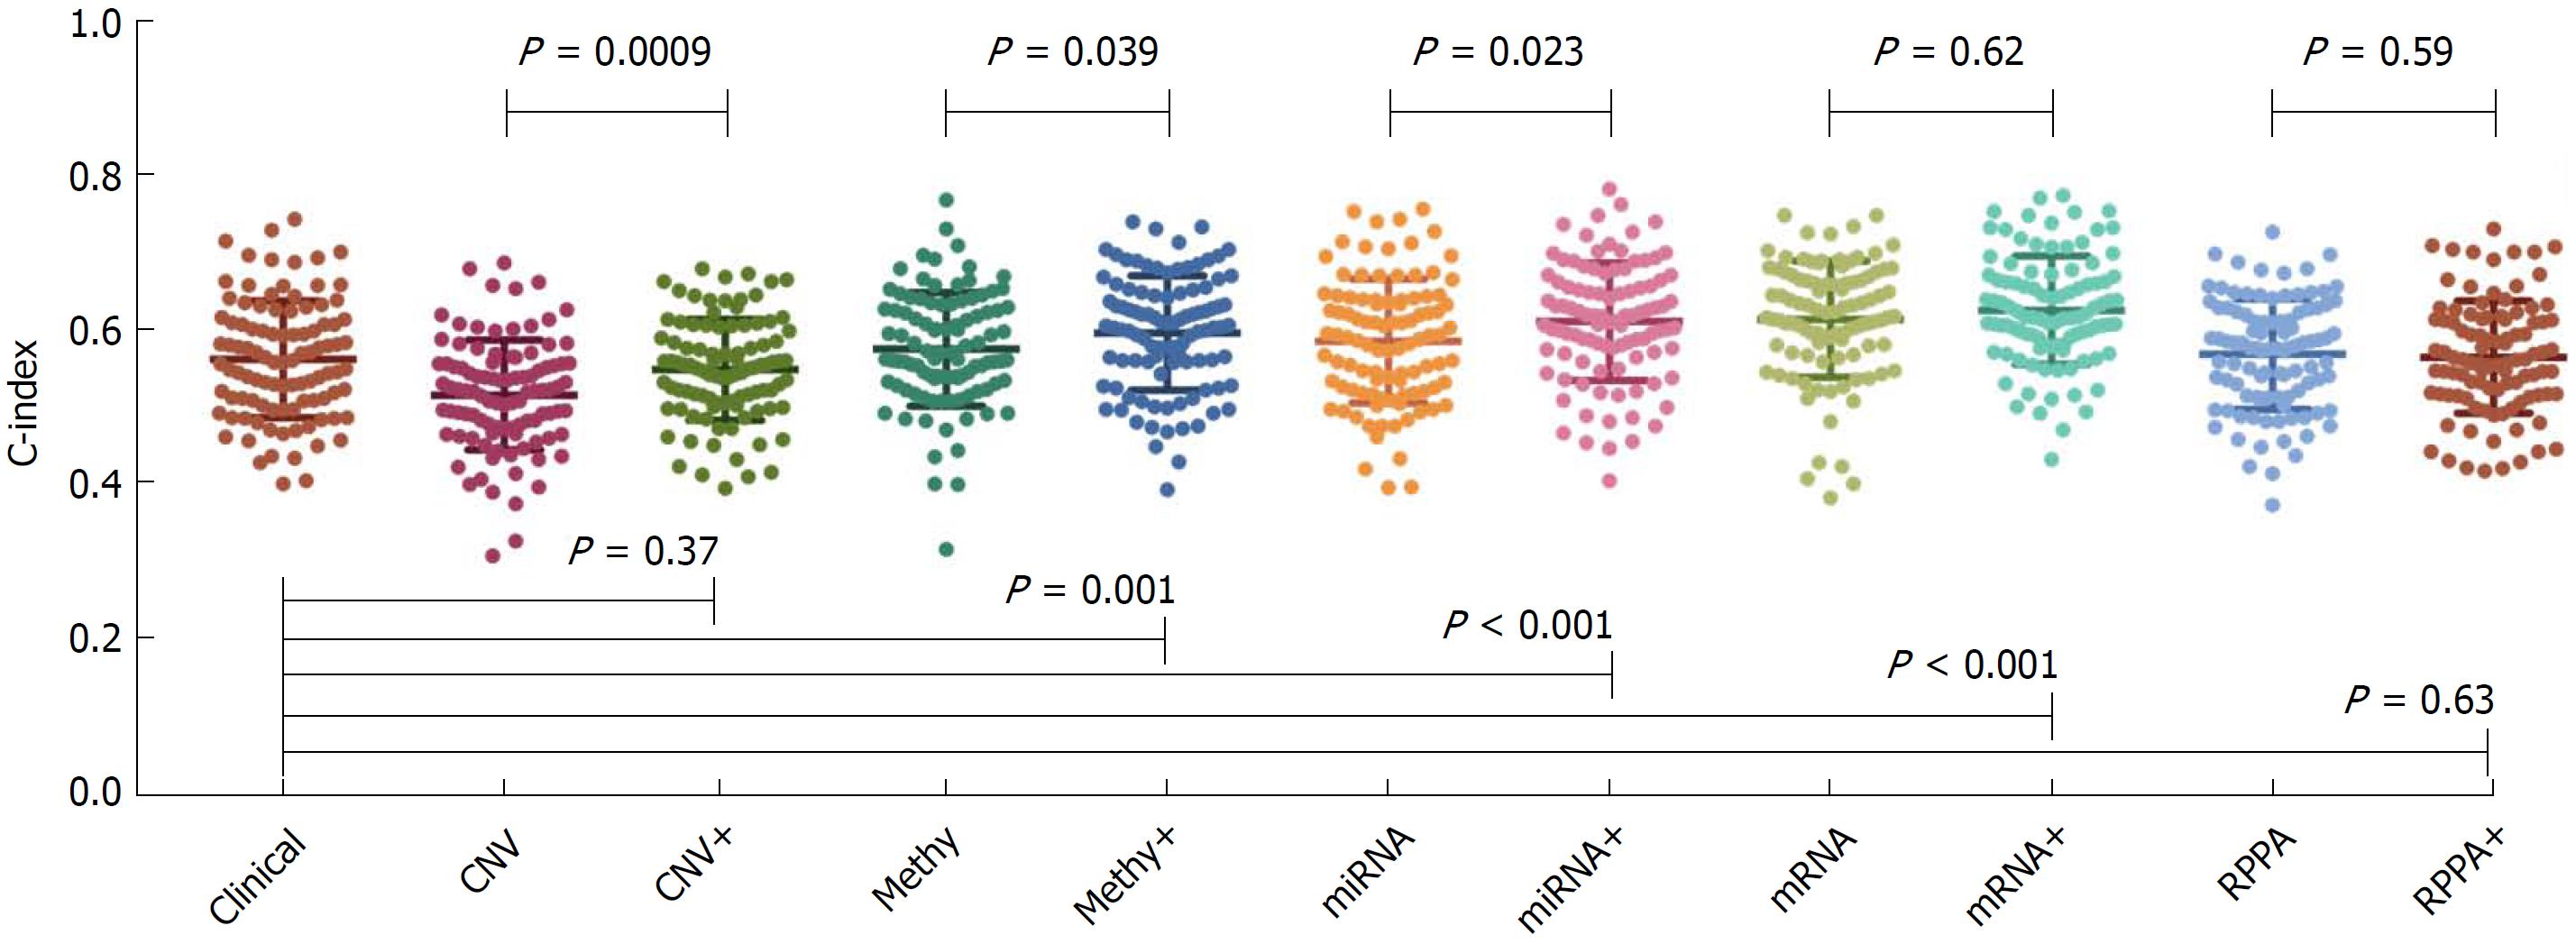
Figure 2 Prognostic powers of clinical data and different types of molecular data.
The concordance index (C-index) value on the left Y-axis indicated the prognostic power of each data type. The P values on the top half of the figure represented the comparisons between the molecular data alone and the combination data. The P values on the lower half of the figure represented the comparisons between the clinical data alone and the combination data.
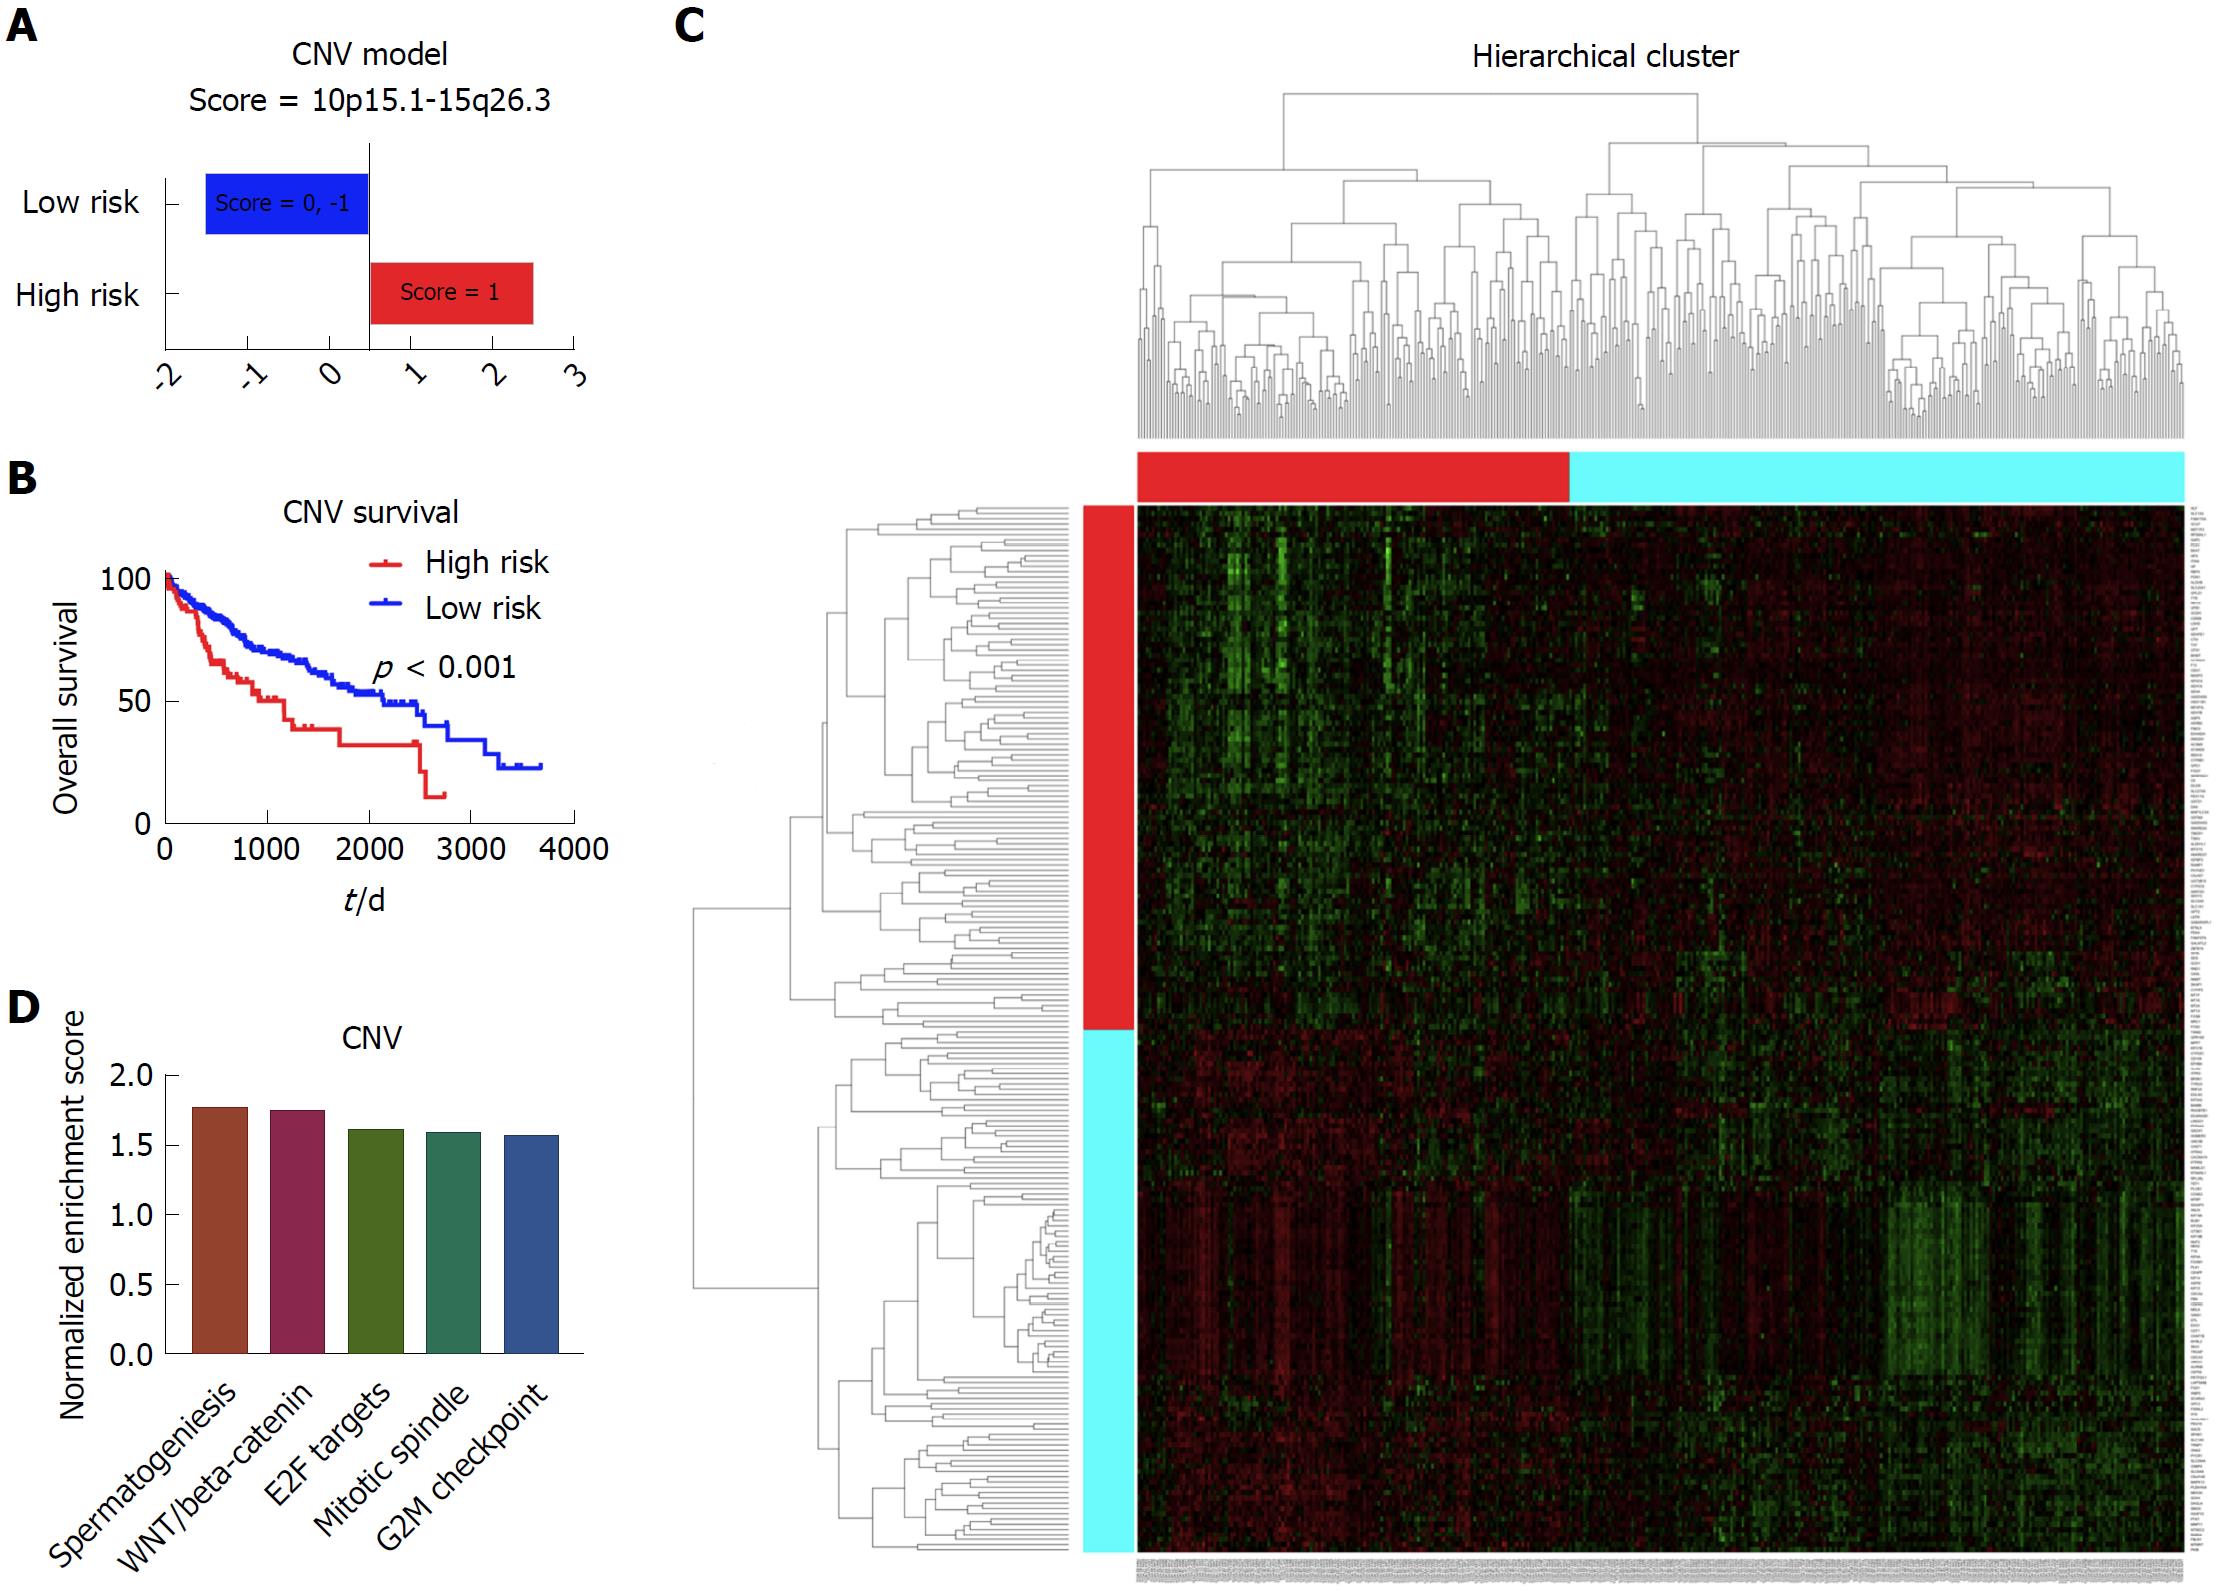
Figure 3 Establishment of prognostic model based on the copy number data.
A: The high risk group and low risk group based on the prognostic score. The patients with the score of 1 were considered as high risk, and patients with the score of 0 and -1 were considered as low risk; B: The Kaplan-Meier survival curves of the high risk group and low risk group, which showed that there was significant difference of survival between the high risk patients and low risk patients; C: The heatmap showing the different gene expression patterns of the high risk group and low risk group. It showed that the gene expression patterns of high risk group and low risk group were obviously distinct; D: The top enriched pathways in the high risk group, as indicated by gene set enrichment analysis. It showed that spermatogenesis, WNT/beta-catenin, E2F targets, mitotic spindle and G2M checkpoint were the top five enriched pathways in the high risk group patients.
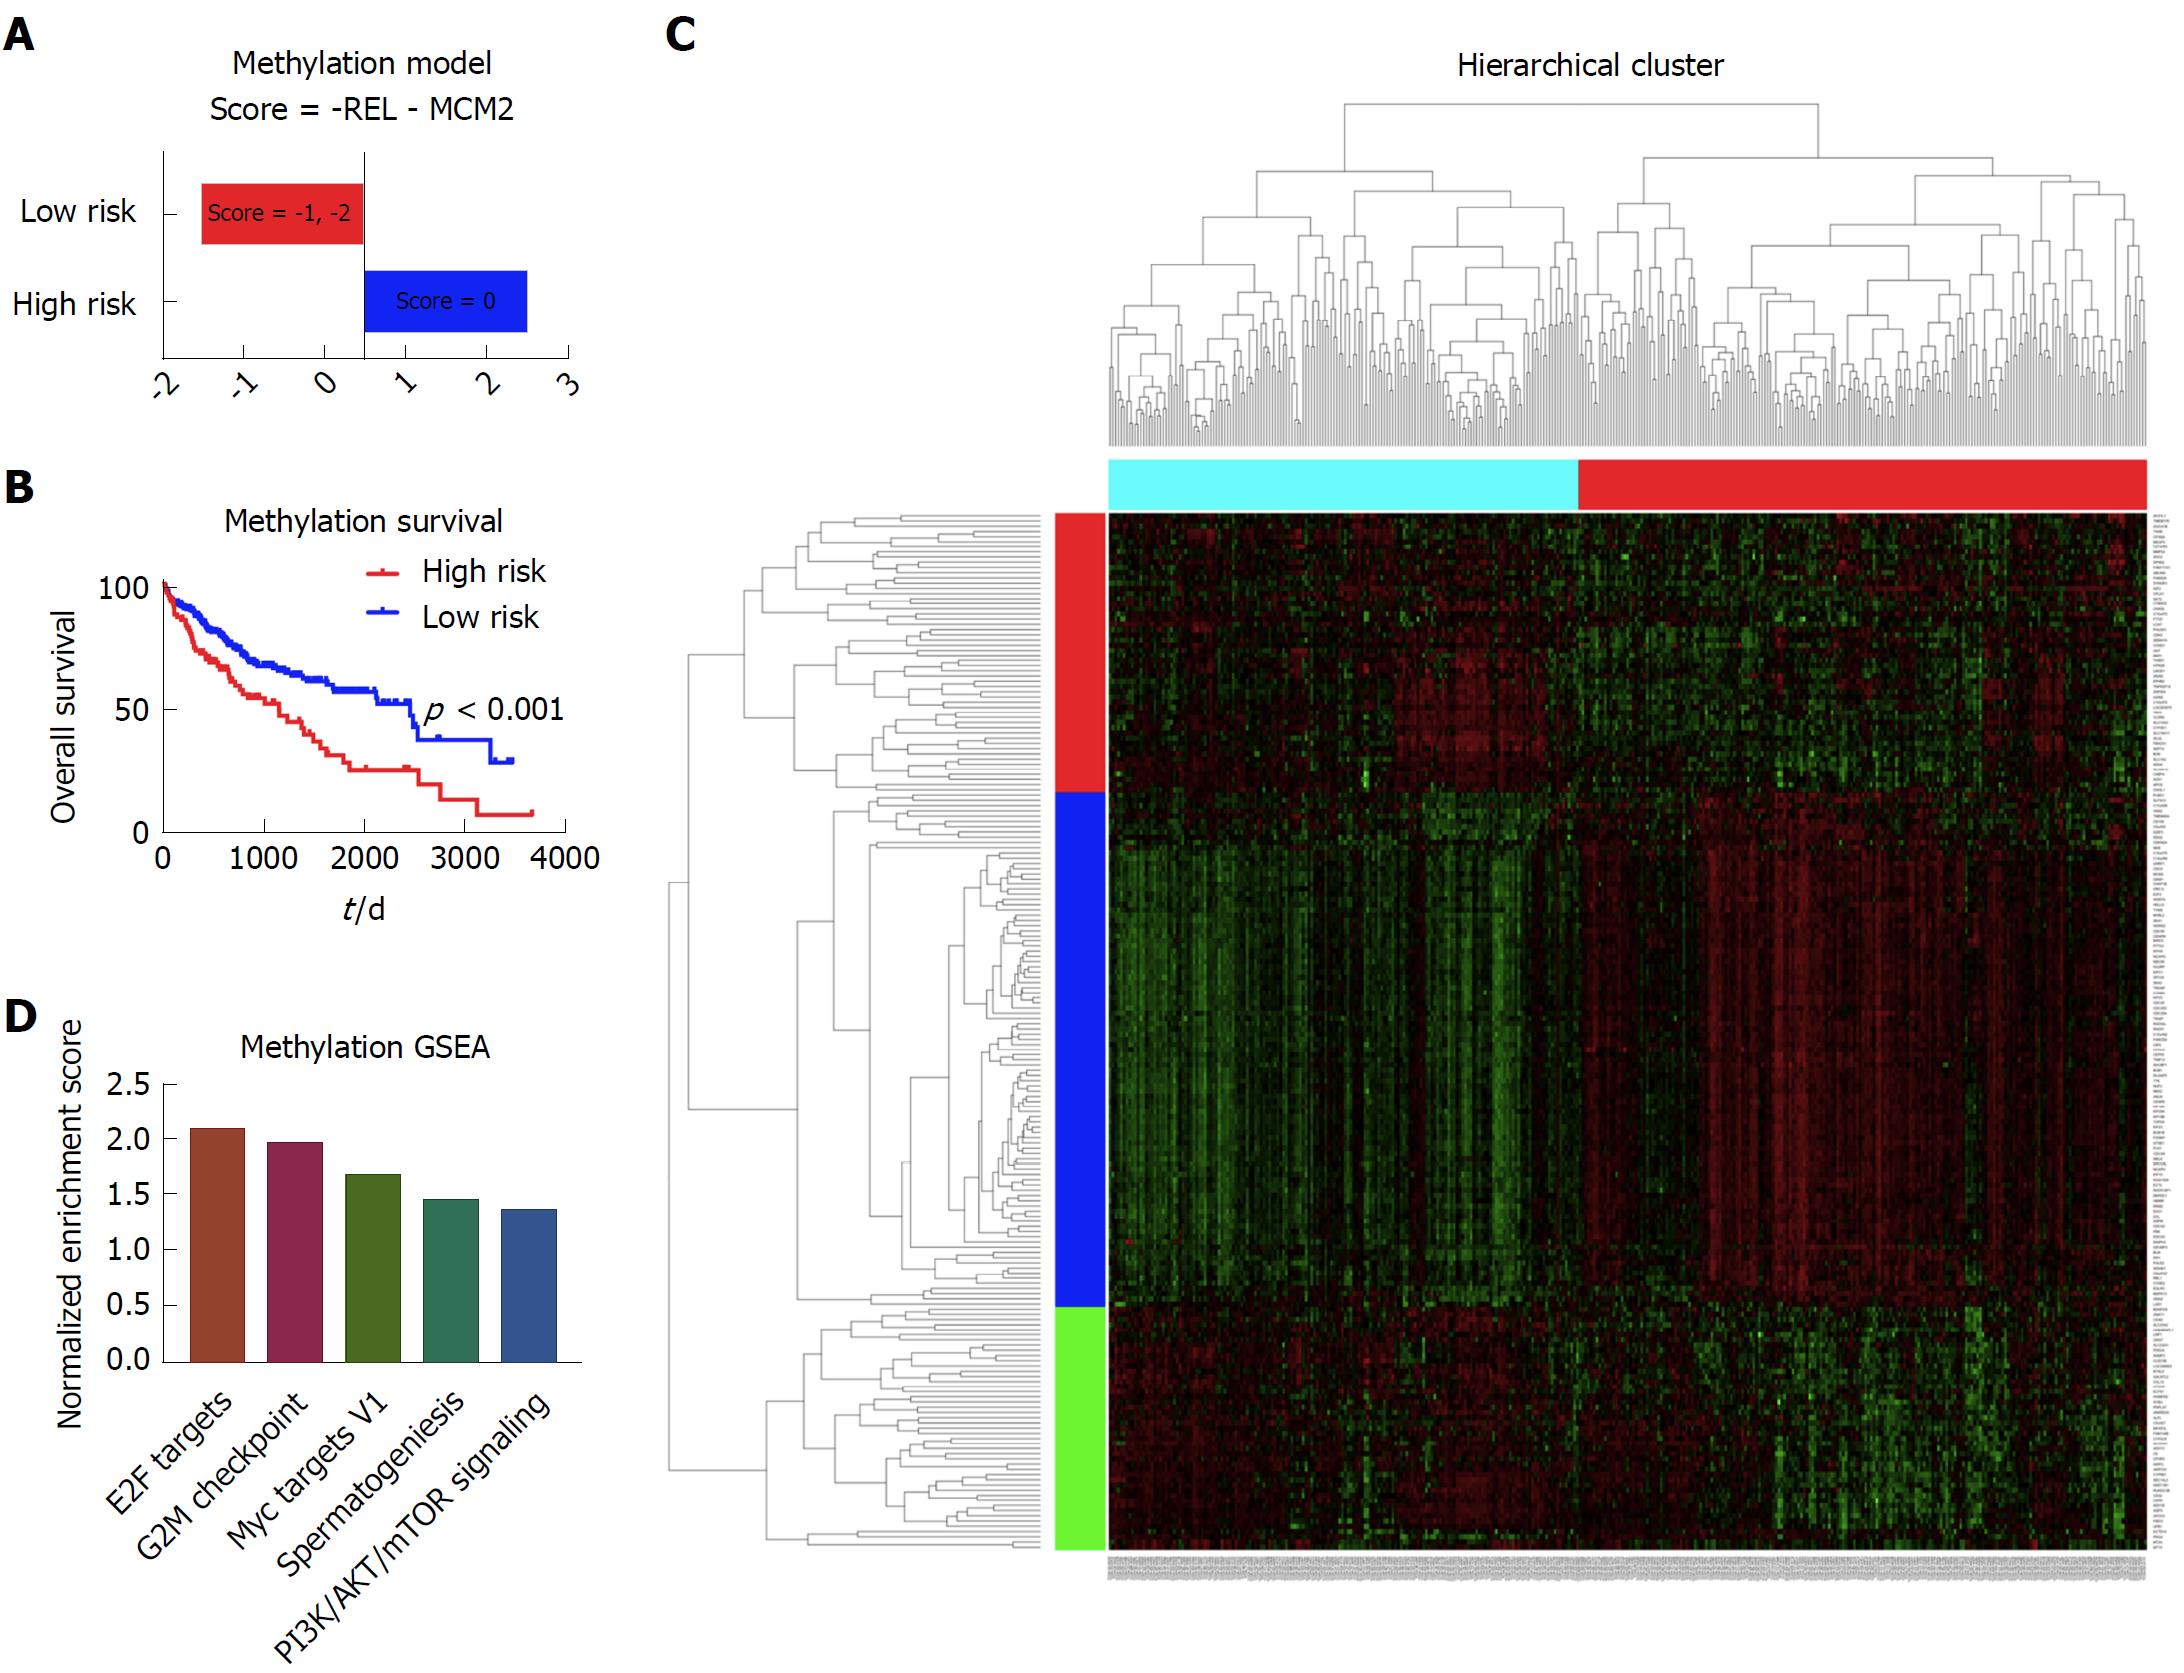
Figure 4 Establishment of the prognostic model based on the methylation data.
A: The high risk group and low risk group based on the prognostic score. The patients with the score of 0 were considered as high risk, and patients with the score of -1 and -2 were considered as low risk; B: The Kaplan-Meier survival curves of the high risk group and low risk group, which showed that there was a significant difference of survival between the high risk patients and low risk patients; C: The heatmap showing the different gene expression patterns of the high risk group and low risk group. It showed that the gene expression patterns of high risk group and low risk group were obviously distinct; D: The top enriched pathways in the high risk group, as indicated by the gene set enrichment analysis. It showed that the E2F targets, G2M checkpoint, Myc targets V1, spermatogenesis and PI3K/AKT/mTOR pathway signaling were among the top five enriched pathways in the high risk group of patients.
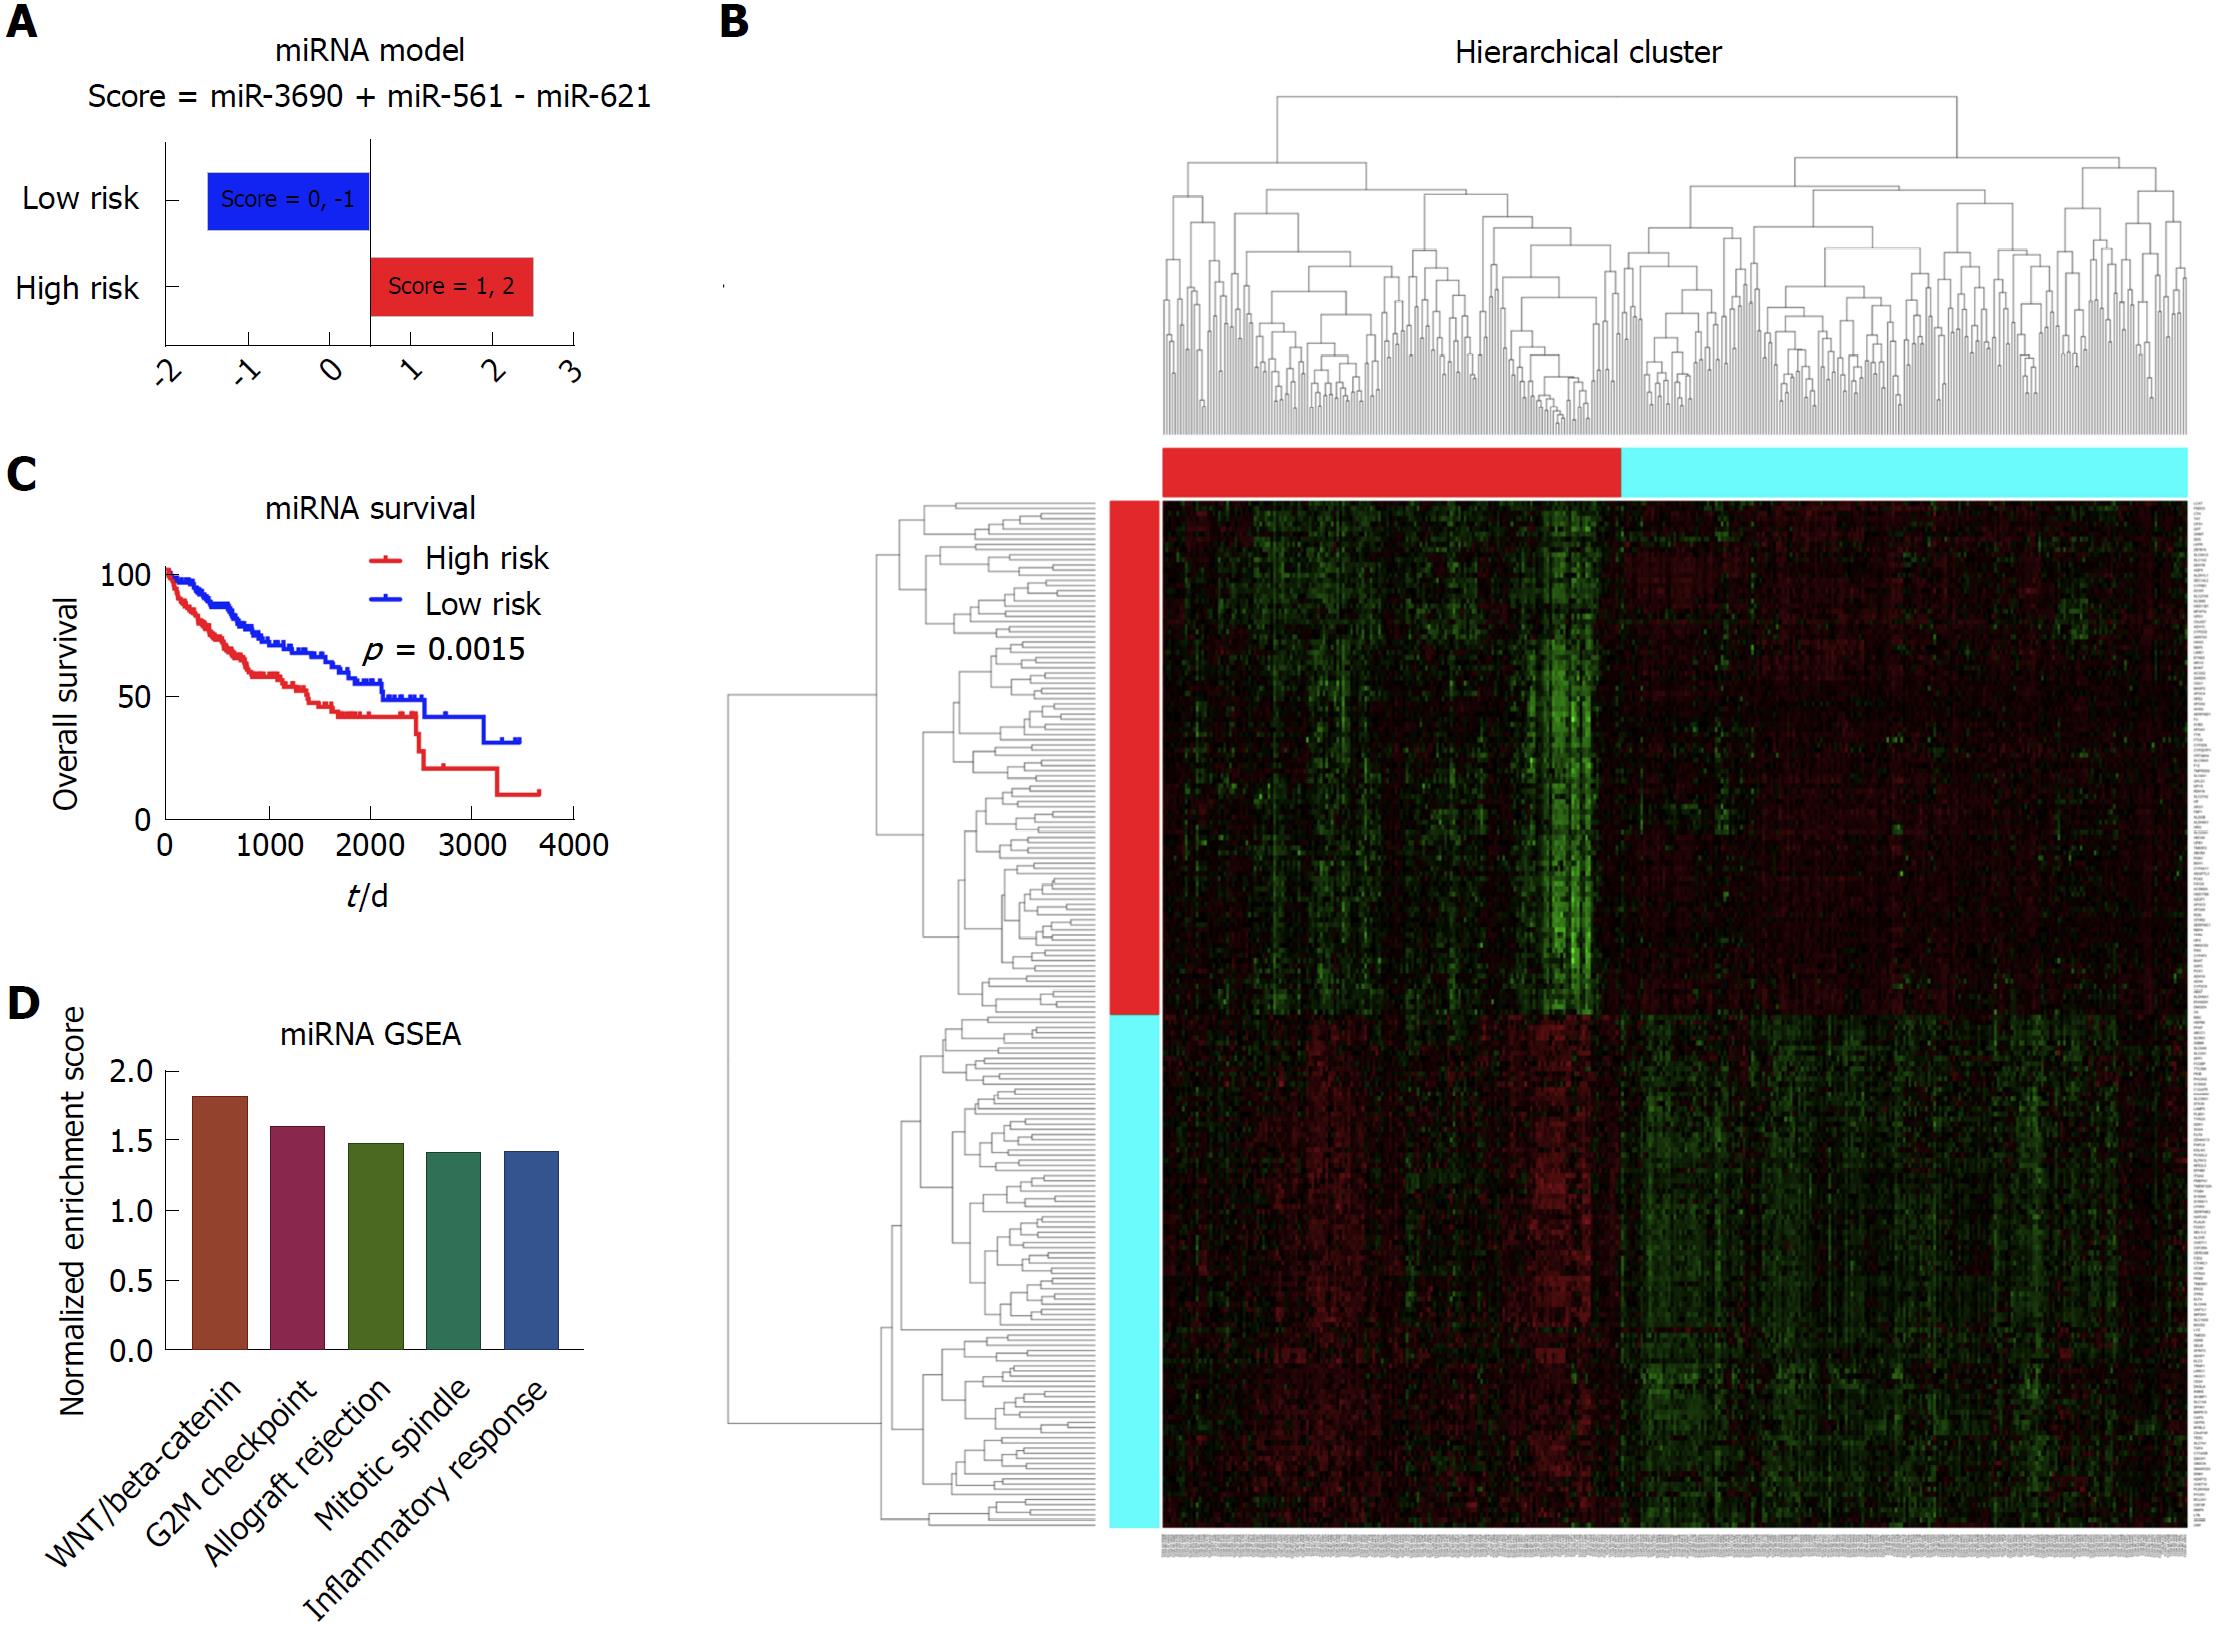
Figure 5 Establishment of the prognostic model based on the miRNA data.
A: The high risk group and low risk group based on the prognostic score. The patients with the score of 1 and 2 were considered as high risk, and patients with the score of 0 and -1 were considered as low risk; B: The Kaplan-Meier survival curves of the high risk group and low risk group, which showed that there was significant difference of survival between the high risk patients and low risk patients; C: The heatmap showing the different gene expression patterns of the high risk group and low risk group. It showed that the gene expression patterns of high risk group and low risk group were obviously distinct; D: The top enriched pathways in the high risk group, as indicated by the gene set enrichment analysis. It showed that the WNT/beta-catenin, G2M checkpoint, allograft rejection, mitotic spindle, and inflammatory response were among the top five enriched pathways in the high risk group patients.
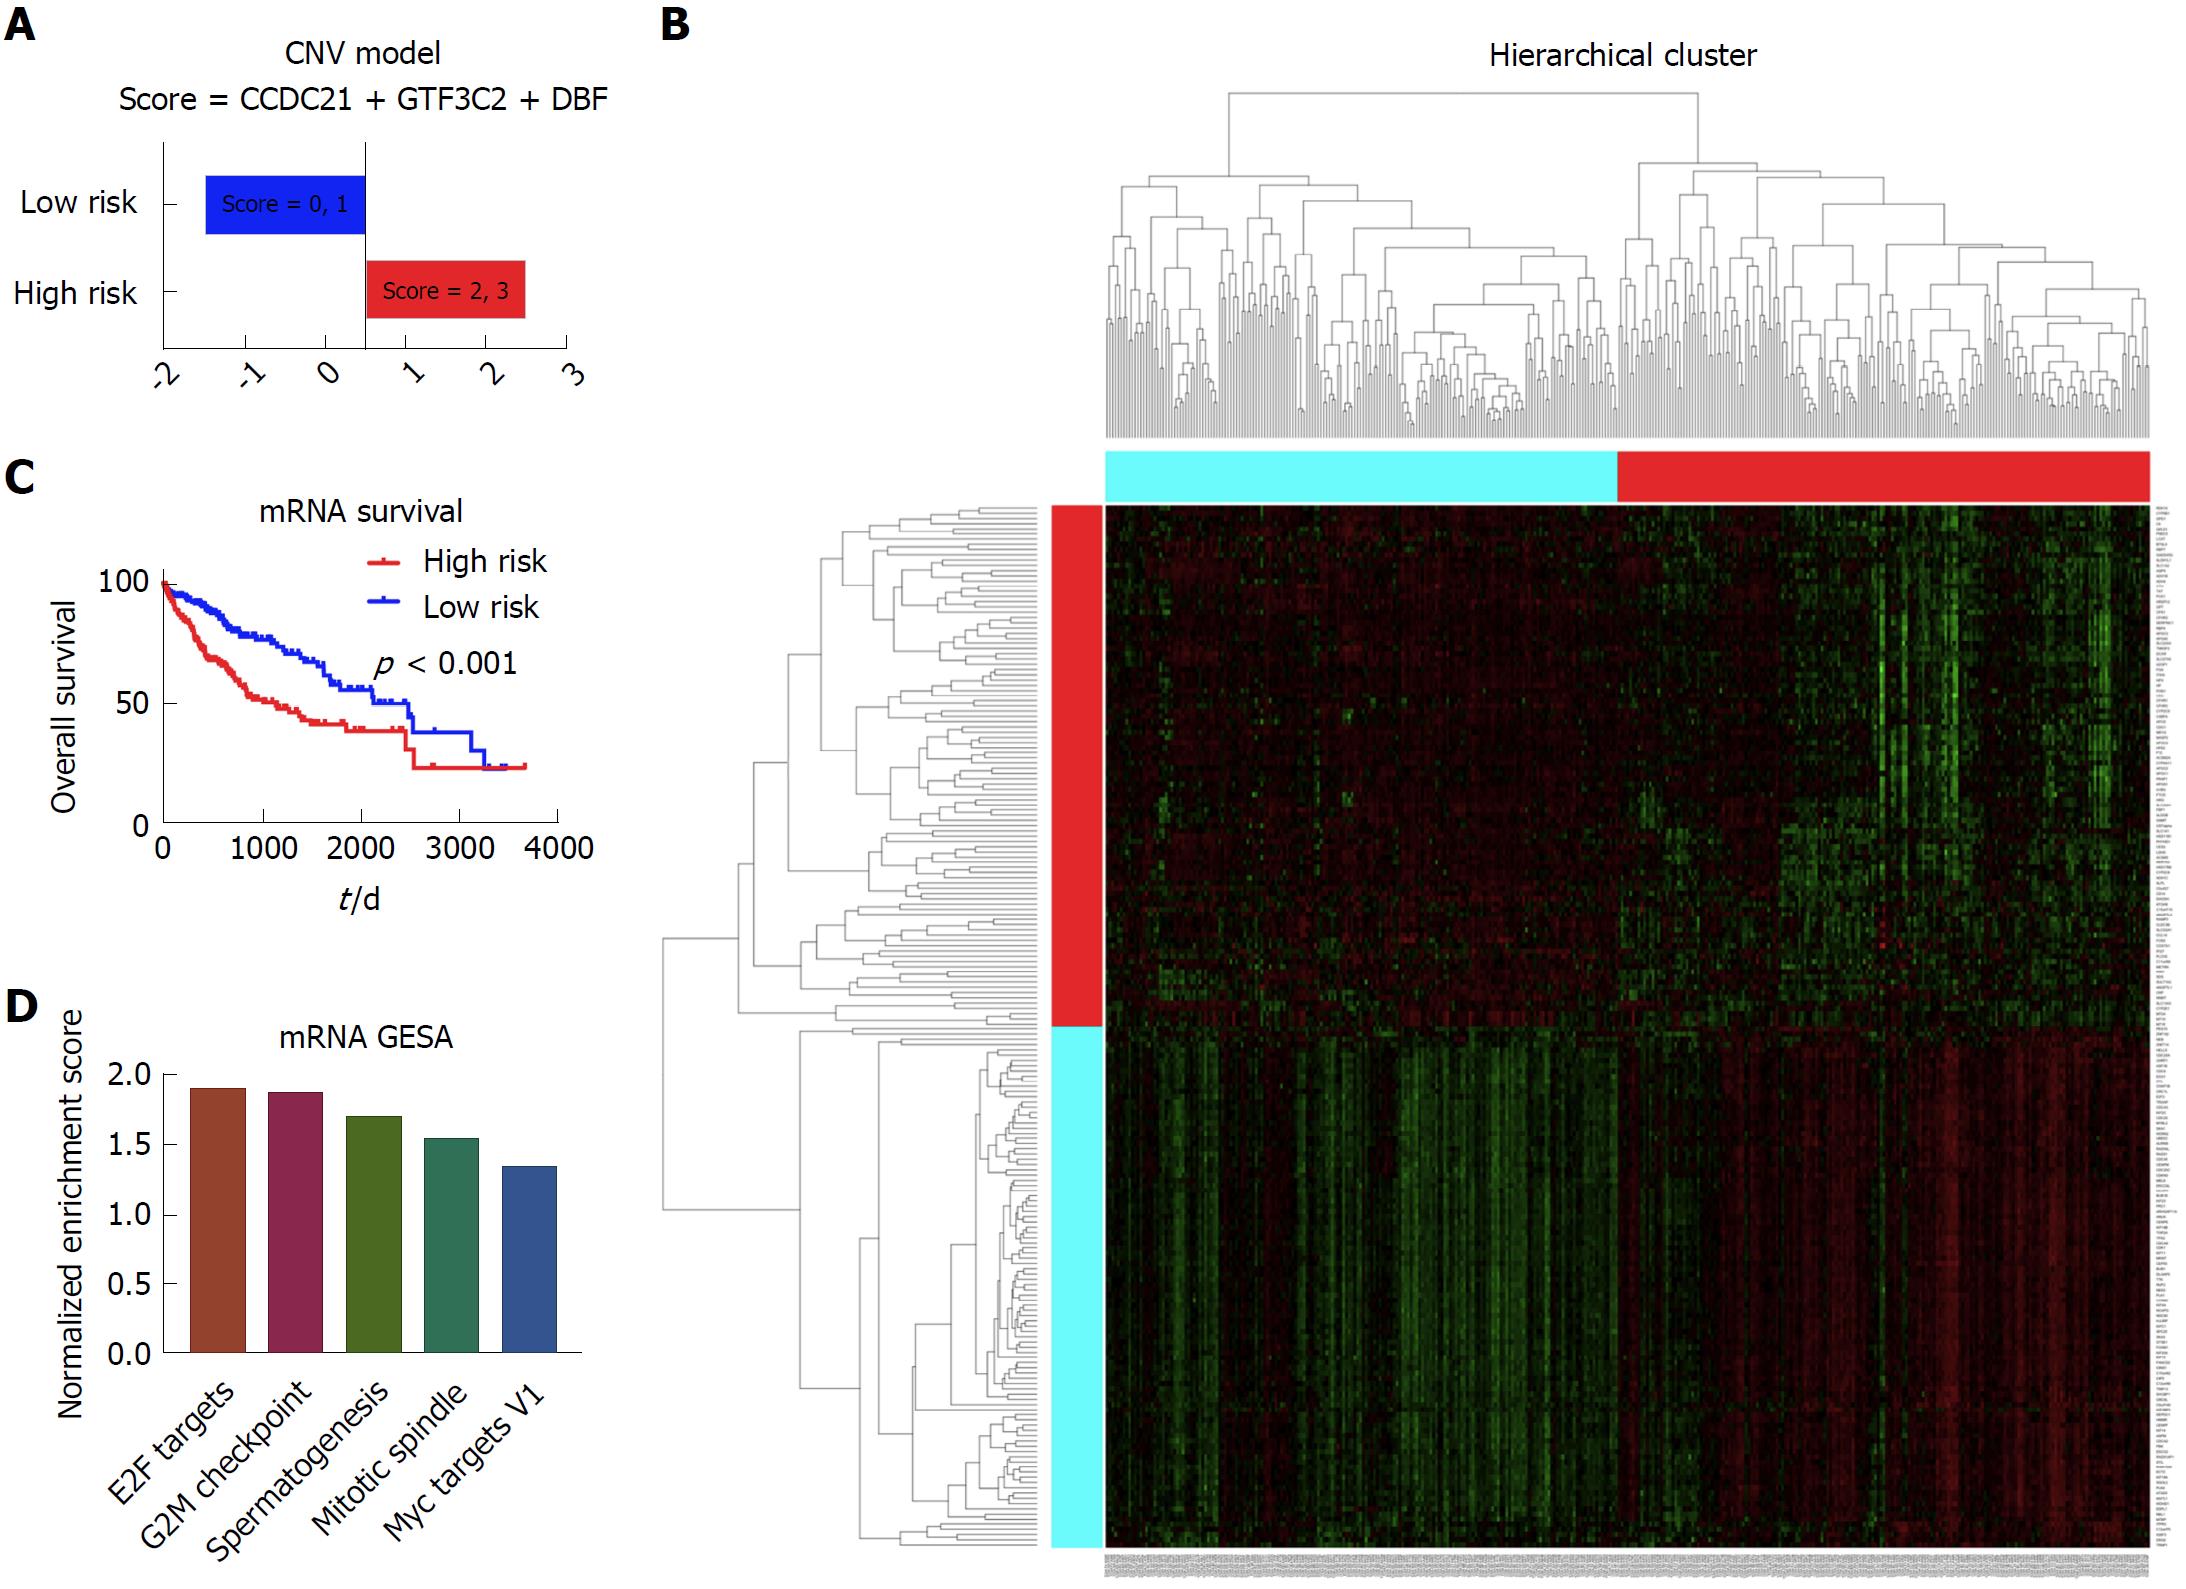
Figure 6 Establishment of the prognostic model based on the mRNA data.
A: The high risk group and low risk group based on the prognostic score. The patients with the score of 2 and 3 were considered as high risk, and patients with the score of 0 and 1 were considered as low risk; B: The Kaplan-Meier survival curves of the high risk group and low risk group, which showed that there was significant difference of survival between the high risk patients and low risk patients; C: The heatmap showing the different gene expression patterns of the high risk group and low risk group. It showed that the gene expression patterns of high risk group and low risk group were obviously distinct. D: The top enriched pathways in the high risk group, as indicated by the gene set enrichment analysis. It showed that the E2F targets, G2M checkpoint, spermatogenesis, mitotic spindle, and Myc targets V1 were significantly enriched in the high risk group patients.
- Citation: Song YZ, Li X, Li W, Wang Z, Li K, Xie FL, Zhang F. Integrated genomic analysis for prediction of survival for patients with liver cancer using The Cancer Genome Atlas. World J Gastroenterol 2018; 24(28): 3145-3154
- URL: https://www.wjgnet.com/1007-9327/full/v24/i28/3145.htm
- DOI: https://dx.doi.org/10.3748/wjg.v24.i28.3145


