Copyright
©The Author(s) 2017.
World J Gastroenterol. Oct 7, 2017; 23(37): 6833-6844
Published online Oct 7, 2017. doi: 10.3748/wjg.v23.i37.6833
Published online Oct 7, 2017. doi: 10.3748/wjg.v23.i37.6833
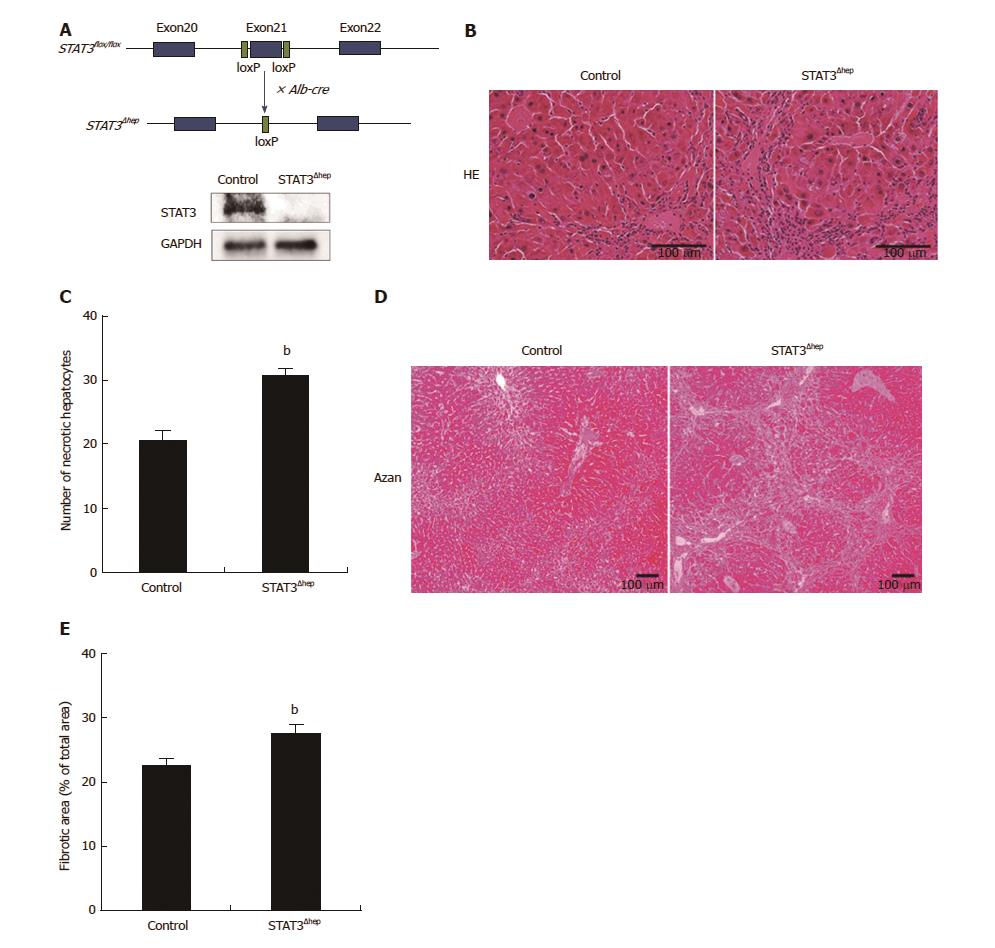
Figure 1 Establishment of hepatic-STAT3 deficient (STAT3Δhep) mice.
Hepatic-STAT3 deficiency enhanced thioacetamide-induced liver injury. A: The exon 21 of STAT3 was flanked by two identically oriented loxP sites (STAT3flox/flox). To disrupt hepatic-STAT3 gene, STAT3flox/flox mice were crossed with mice carrying albumin promoter-driven Cre transgene (Alb-Cre). Deficiency of hepatic-STAT3 protein was confirmed by immunoblotting analysis. B: Representative hematoxylin and eosin (H&E) staining images of control and STAT3Δhep livers with TAA treatment for 16 wk. Hepatic-STAT3 deficiency accelerated inflammation cells infiltration and hepatocytes necrosis. C: Quantification of necrotic hepatocytes. Necrotic hepatocyte was identified with the eosinophilic/vacuolated cytoplasm and nuclear destruction such as karyolysis or Pyknosis. Values represent means ± SE of the mean. bP < 0.01 (P = 0.000269) vs control. D: Representative Azan staining of control and STAT3Δhep livers with TAA treatment for 16 wk. E: Quantification of the ratio of fibrosis area to the total area in control and STAT3Δhep livers. Values represent means ± SE of the mean. bP < 0.01 (P = 0.00235) vs control. TAA: Thioacetamide.
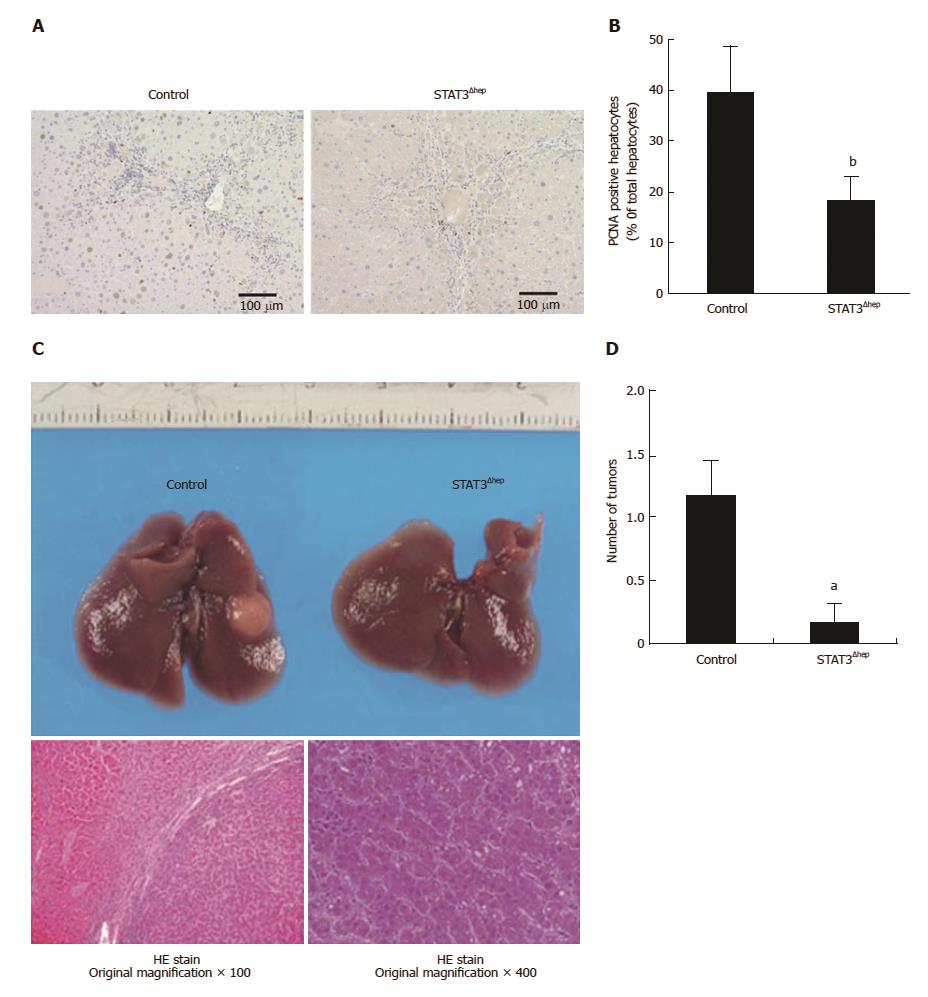
Figure 2 Hepatic STAT3 deficiency reduced hepatocyte proliferation and inhibited the development of hepatocellular carcinoma.
A: Representative immunohistochemical staining for PCNA in livers of control and STAT3Δhep mice with TAA treatment for 16 wk. PCNA positive hepatocytes were decreased in STAT3Δhep mice. Original magnification × 200. B: The number of PCNA positive hepatocytes. The ratio of PCNA positive hepatocytes to all hepatocytes was quantified in three different samples per a group. Values represent means ± standard error of the mean. bP < 0.01 (P = 0.000232) vs control. C: Gross liver appearance of control and STAT3Δhep mice with TAA treatment for 30 wk. Tumor formation with TAA treatment for 30 wk (upper panel). HE staining of representative sections of hepatocellular carcinoma. Original magnification × 100 (lower left panel) and × 400 (lower right panel). D: The number of HCC in control and STAT3Δhep mice. Values represent means ± SE of the mean (n = 6). aP < 0.05 (P = 0.0219) vs control. TAA: Thioacetamide.
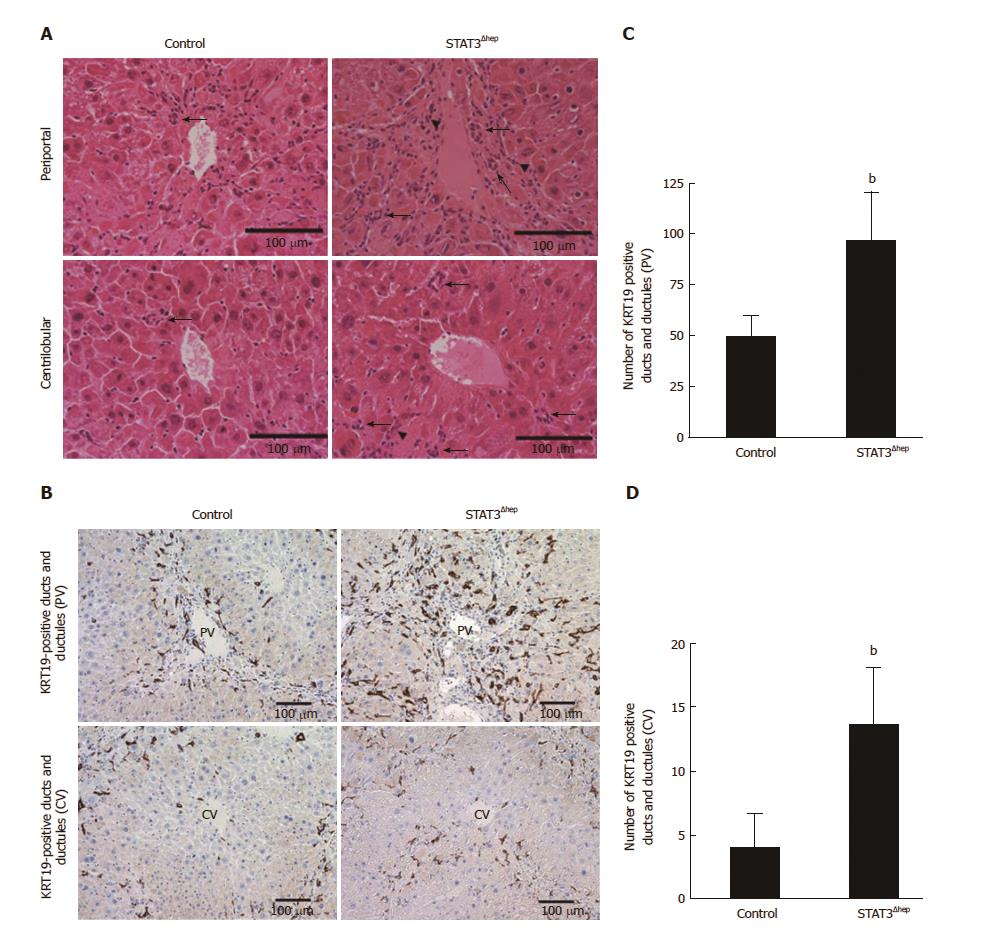
Figure 3 Increase in the formation of bile ducts and ductular structure in hepatic STAT3 deficient liver.
A: Hematoxylin and eosin staining images of representative areas around portal vein (PV) and central vein (CV) of control and STAT3Δhep livers following treatment with TAA for 16 wk. TAA treatment caused bile ducts/ductular formation (arrow). B: Immunohistochemistry staining for keratin 19 (KRT19) in control and STAT3Δhep livers following TAA treatment for 16 wk. Original magnification × 200. C and D: The number of KRT19-positive bile ducts/ductules around PV and CV. To quantify the number of bile ducts/ductules around PV and CV, we observed three different samples per group using 20 × objective lens, imaged five randomly selected cross-sectional veins in the center of field, and calculated the average value after counting the bile duct/ductule number in the total area of the image. Values represent means ± SE of the mean. bP < 0.01 [(C) P = 0.00272, (D) P = 0.00187] vs control. TAA: Thioacetamide.
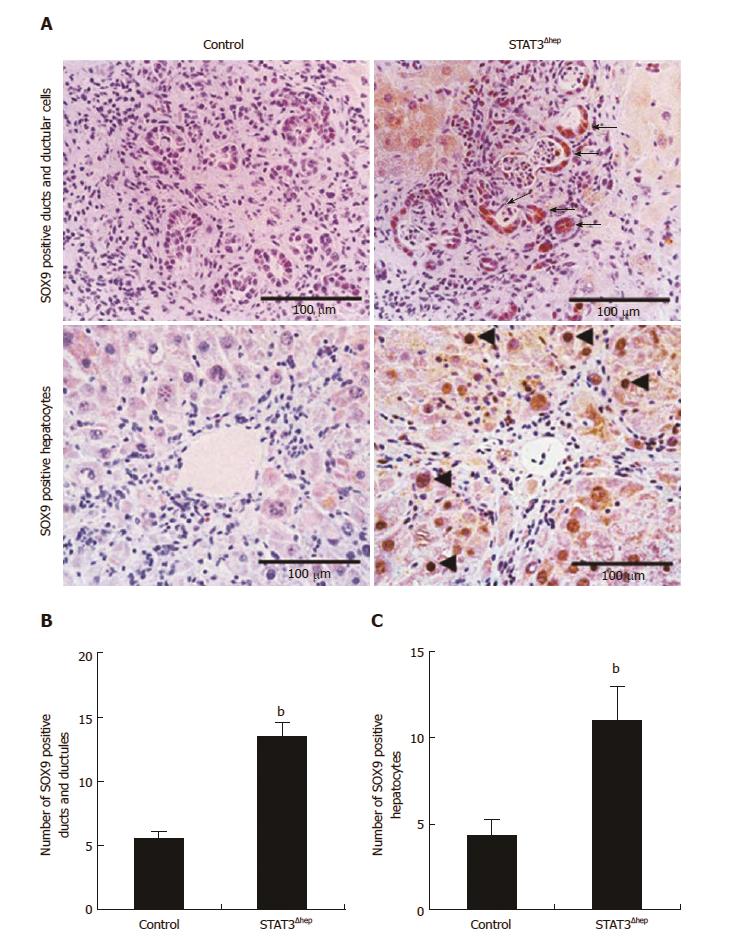
Figure 4 Hepatic STAT3 deficiency upregulated SOX9 expression in thioacetamide-induced liver injury.
A: Immunohistochemistry staining for SOX9 in control and STAT3Δhep livers with TAA treatment for 16 wk. SOX9 expression was markedly enhanced in bile ducts/ductular structure (upper panel) and hepatocytes (lower panel) of STAT3Δhep livers. Original magnification × 200 (upper panel) and × 400 (lower panel). B and C: The number of SOX9 positive bile ducts/ductular structure and hepatocytes. For quantification of SOX9 positive bile ducts/ductular structure, three different samples per a group were observed using a 20 × objective lens and SOX9 positive ducts/ductular structure was counted at five PV areas. For quantification of SOX9 positive hepatocytes, three different samples per a group were observed using a 40 × objective lens and SOX9 positive hepatocytes was counted at five PV areas. Values represent means ± standard error of the mean. bP < 0.01 [(B) P = 0.0000103, (C) P = 0.00834] vs control. TAA: Thioacetamide.
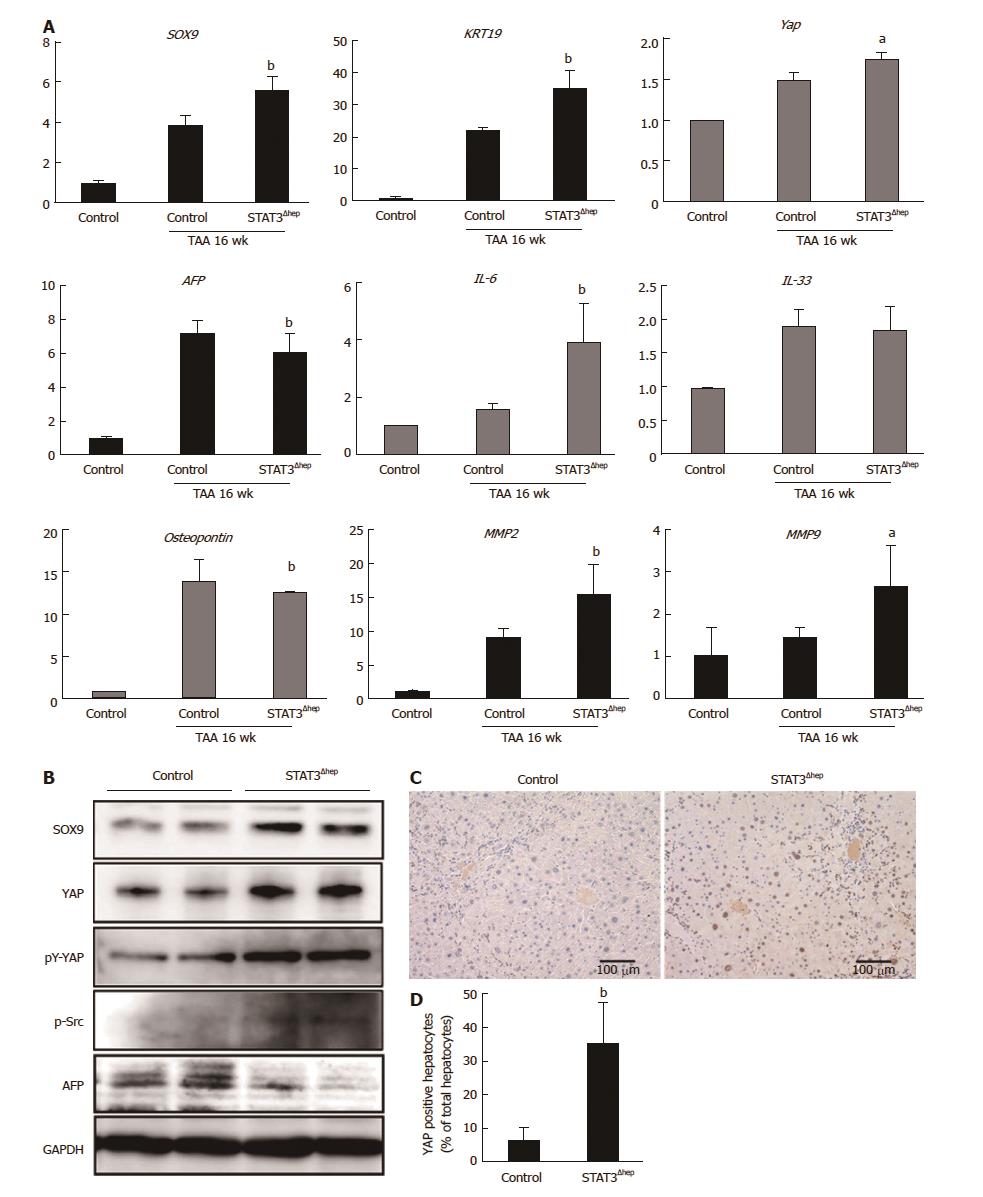
Figure 5 YAP activation in STAT3-deficient hepatocyte with thioacetamide treatment.
A: Quantitative real-time RT-PCR analysis for SOX-9, KRT 19, YAP, AFP, IL-6, IL-33, Osteopontin, MMP2, and MMP9 mRNA expression levels. The relative expression of each gene mRNA was normalized to GAPDH mRNA (n = 6). aP < 0.05 (YAP; P = 0.0134, AFP; P = 0.00347, MMP9; P = 0.00271) and bP < 0.01 (SOX9; P = 0.00274, KRT19; P = 0.00402, IL-6; P = 0.00147, MMP2; P = 0.00404) vs control (TAA treatment for 16 wk). B: Immunoblotting analysis for SOX-9, YAP, pY-YAP, p-Src and AFP protein expression levels. GAPDH served as loading control. C: Representative immunohistochemical staining for YAP in livers of control and STAT3Δhep mice with TAA treatment for 16 wk. Nuclear YAP was augmented in STAT3Δhep hepatocytes with TAA treatment for 16 wk. Original magnification × 200. D: The number of nuclear YAP positive hepatocytes. Ratio of nuclear YAP positive hepatocytes to all hepatocytes was quantified in three different samples per a group. Values represent means ± SE of the mean. bP < 0.01 (P = 0.00312) vs control. TAA: Thioacetamide.
- Citation: Abe M, Yoshida T, Akiba J, Ikezono Y, Wada F, Masuda A, Sakaue T, Tanaka T, Iwamoto H, Nakamura T, Sata M, Koga H, Yoshimura A, Torimura T. STAT3 deficiency prevents hepatocarcinogenesis and promotes biliary proliferation in thioacetamide-induced liver injury. World J Gastroenterol 2017; 23(37): 6833-6844
- URL: https://www.wjgnet.com/1007-9327/full/v23/i37/6833.htm
- DOI: https://dx.doi.org/10.3748/wjg.v23.i37.6833


